September 2021 climate report
22 Oct 2021, 11:24 AM
Summary
- September 2021 was a wet month for Northland
- River flows were nearly universally “Above Normal” across the region
- Groundwater levels were near normal in most groundwater systems, but Mangawhai remains “Very Low”
- Soil moisture remains near field capacity with frequent rain events and is wetter than normal for this time of year
- The long-range outlook predicts near normal rainfall for the next three months, but warmer than typical temperature
Outlook
October to December 2021
The NIWA long-range outlook for October to December 2021 calls for near normal rainfall, and a near equal likelihood of normal of below normal soil moisture and river flows, likely influenced by higher than normal temperatures and increased evapotranspiration. NIWA note that the continuation of La Nina conditions is quite likely, but it is less advanced than last year. The upshot of this is that the weather patterns we have observed over the last year are likely to continue, meaning that there is a risk of south-western areas remaining dry. The likelihood of ex tropical cyclones landing in our neck of the woods is generally increased in La Nina conditions, but we can expect to get a better outlook for this closer to summer.
NIWA Temperature, Rainfall, Soil Moisture and River Flows probabilities (% likelihood) October to December 2021
| Temperature | Rainfall | Soil moisture | River flows | |
| Above average | 60• | 30 | 15 | 15 |
| Near average | 35 | 45• | 40 | 40 |
| Below average | 05 | 25 | 45• | 45• |
Rainfall
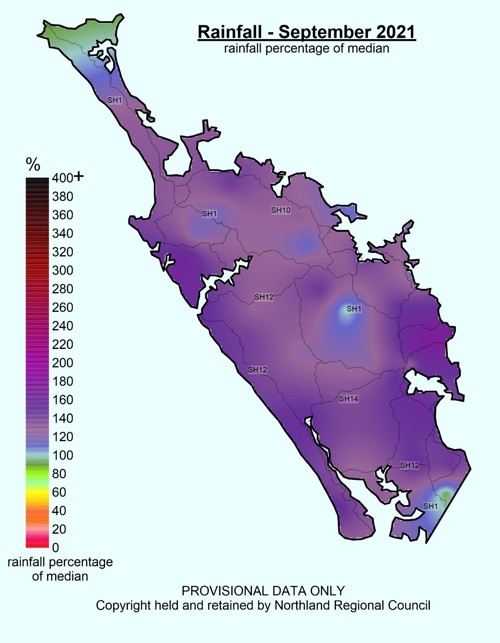
September 2021 was a wet month for the region with the region overall receiving around 135% of typical rainfall. The wettest areas compared to a typical September were around the eastern hills north of Whangārei, with these areas receiving around 170% of typical rainfall. The bulk of the rainfall fell during three weather events categorised as “Severe Weather” events by MetService, on 1, 15, and 22 September. Some flooding was reported around Rangiahua SH1 during 15 September rainfall event.
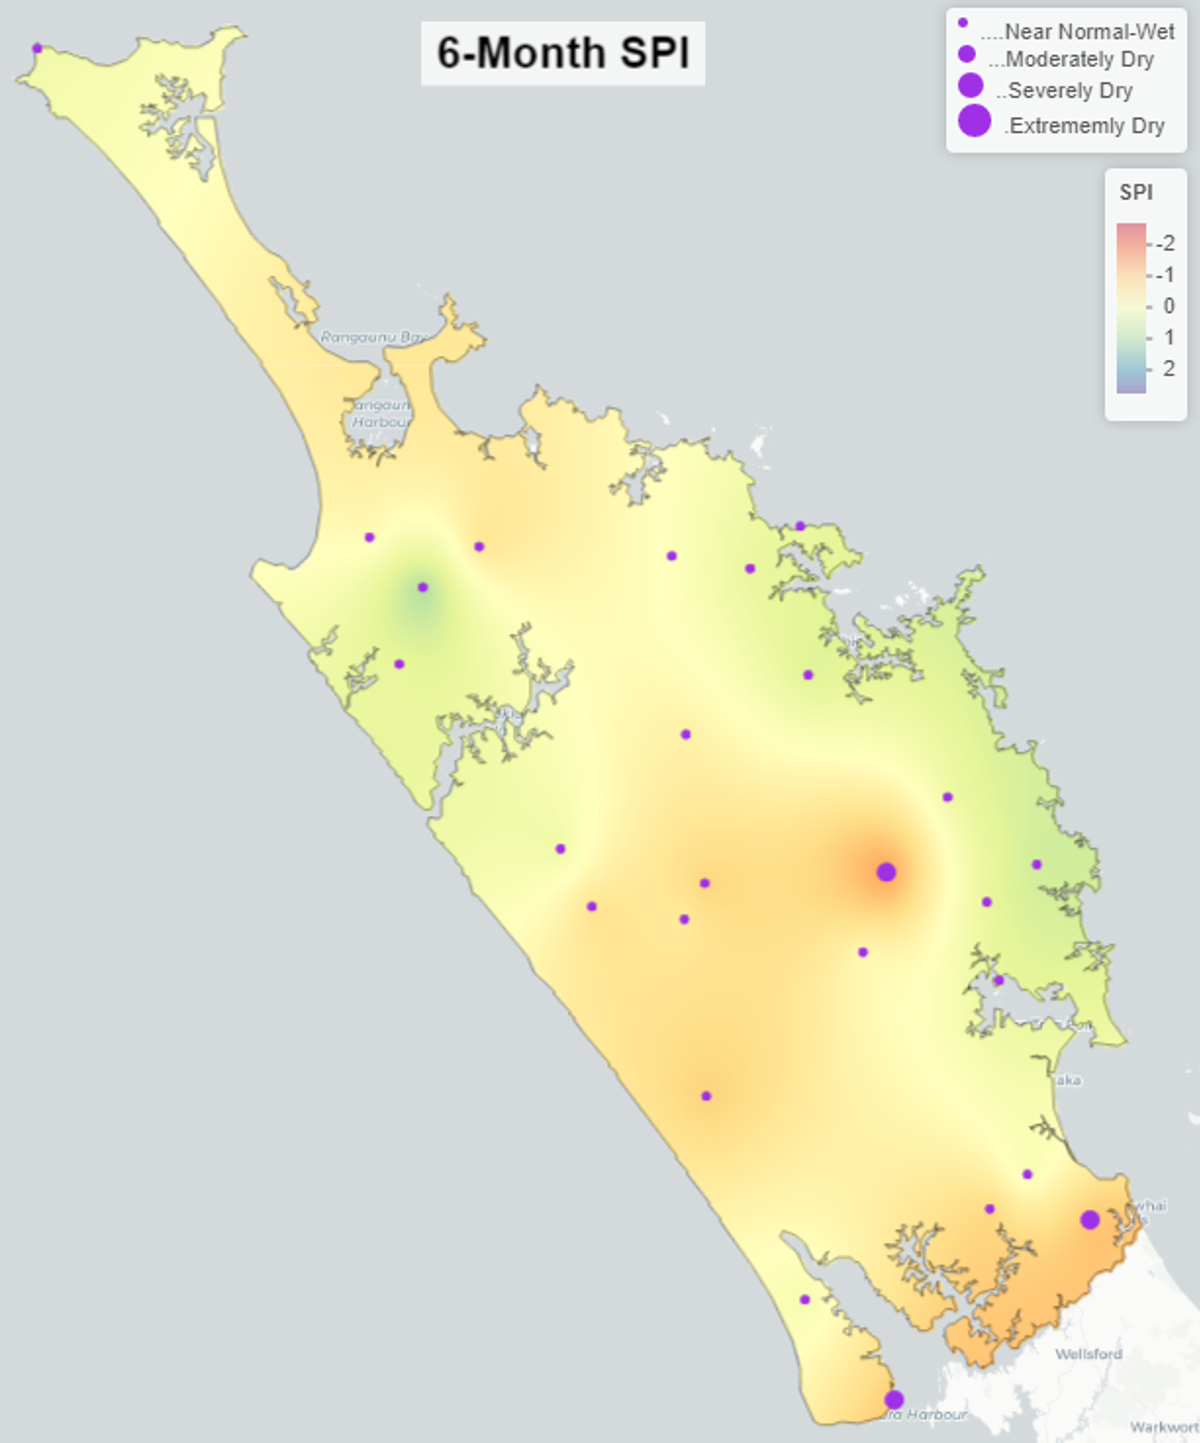
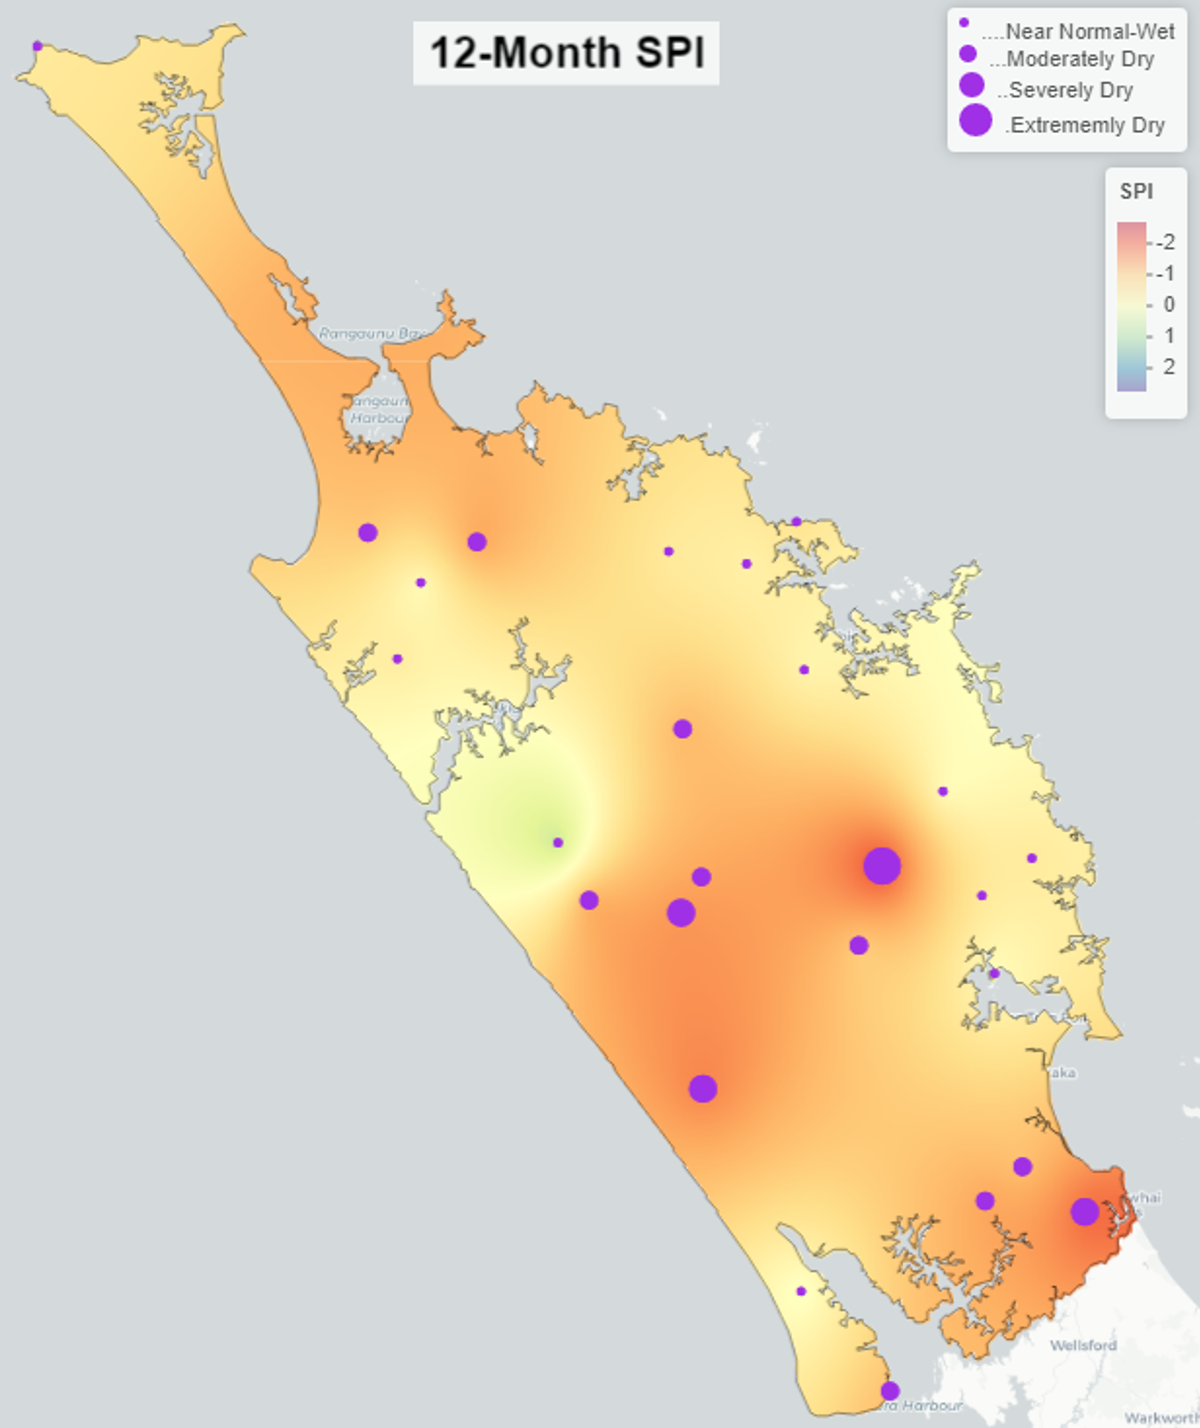
The SPI maps below show that rainfall for the last 6-months has been near normal or slightly wet in comparison to normal in most locations. Over the previous 12-month period there remains some dry areas. This 12-Month SPI period is useful to assess risk to aquifers and water storage. Most notably this aligns with low groundwater levels in the Mangawhai aquifer (see groundwater section below).
Rainfall % median map for September 2021
SPI Index map for 6 and 12 months to the end of September 2021


Rainfall deficit values (mm)
| Site | End date | 1 Month | 3 Months | 6 Months | 12 Months |
| Kaitaia Ews | September 2021 | 48.49 | 33.25 | -25.05 | -115.25 |
| Kerikeri Ews | September 2021 | 63.80 | 97.72 | 74.16 | 12.71 |
| Kaikohe Aws | September 2021 | 36.10 | 39.72 | -54.56 | -186.14 |
| Whangārei Aero Aws | September 2021 | 80.62 | 120.64 | 158.77 | 92.68 |
| Hokianga Harbour at Omapere/Opononi | September 2021 | 54.68 | 23.18 | -10.88 | -22.96 |
| Dargaville 2 Ews | September 2021 | 53.57 | -46.57 | -83.13 | -196.11 |
River flow
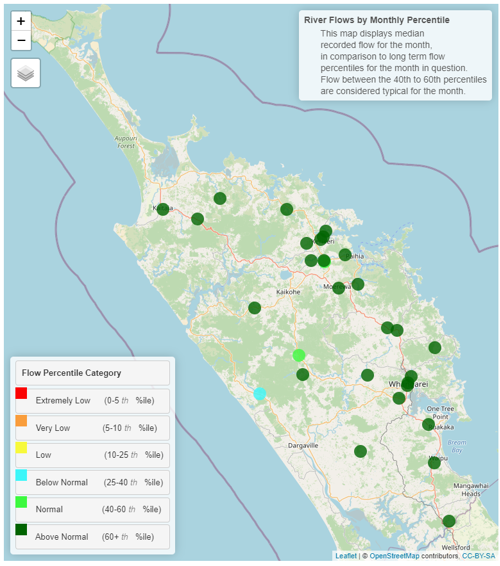
River flows during September 2021 were nearly universally above normal for the month compared to typical September average flow, largely driven by the frequent severe weather events that occurred during the month. The exception to this is the Kaihu River, NRC’s western most flow recorder. Rainfall in this catchment was above normal for September, but has been below normal in this western area for previous months of May, June, July and August.
Flow map September 2021
Groundwater
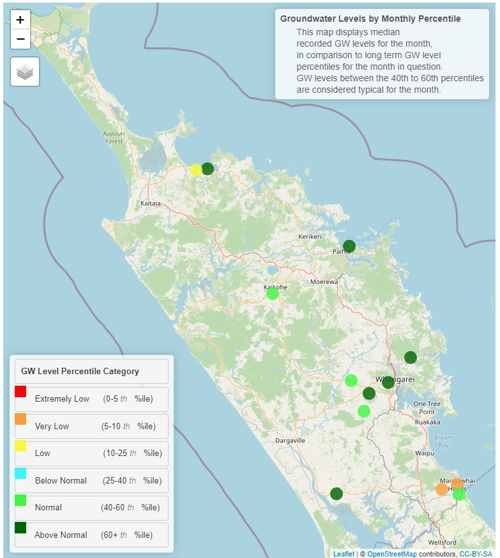
During September 2021 groundwater levels were normal in most locations, but classified as “Very Low” in the Mangawhai aquifer. This is due to a continuation of below normal rainfall in this area over the last 6-months. Thankfully, water levels in the Ruawai aquifer, which have previously been low also, has increased during September to “Above Normal” in response to a wet September.
| Groundwater systems | Status | Percentile |
| Aupōuri | Above normal | 60th+ |
| Taipā | Low | 10-25th |
| Russell | Above normal | 60th+ |
| Kaikohe | Above normal | 60th+ |
| Poroti | Normal | 40-60th |
| Whangārei | Above normal | 60th+ |
| Mangawhai | Very low | 5-10th |
| Marsden - Ruakākā | Normal | 40-60th |
| Ruawai | Above normal | 60th+ |
Northland aquifer status map September 2021
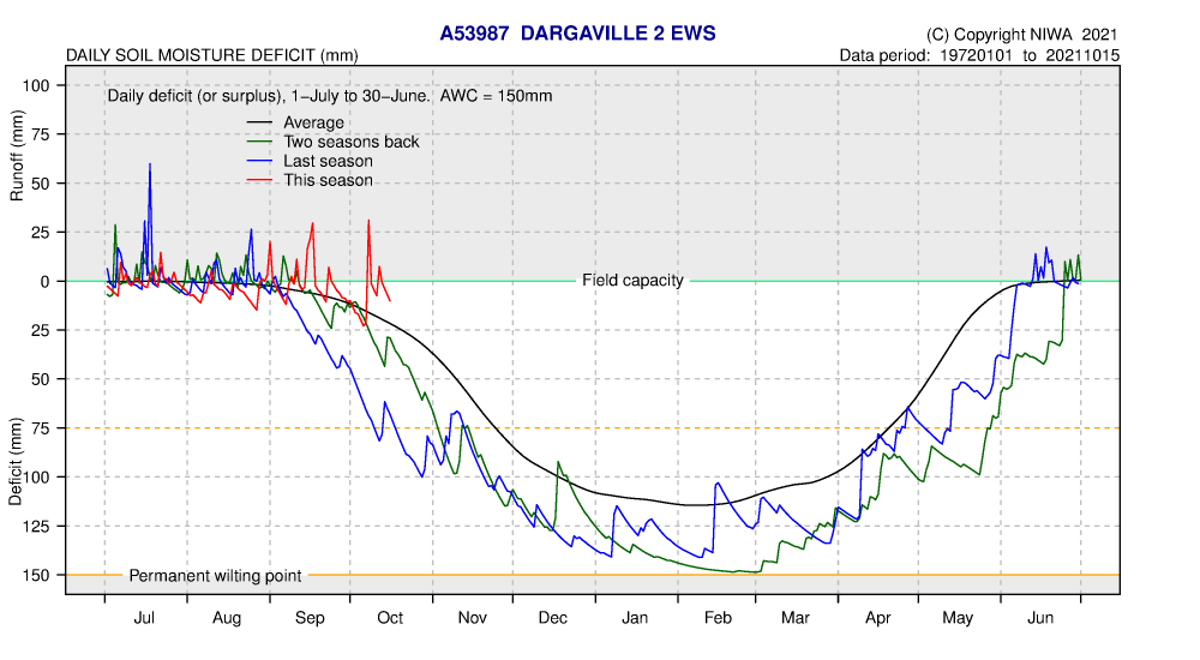
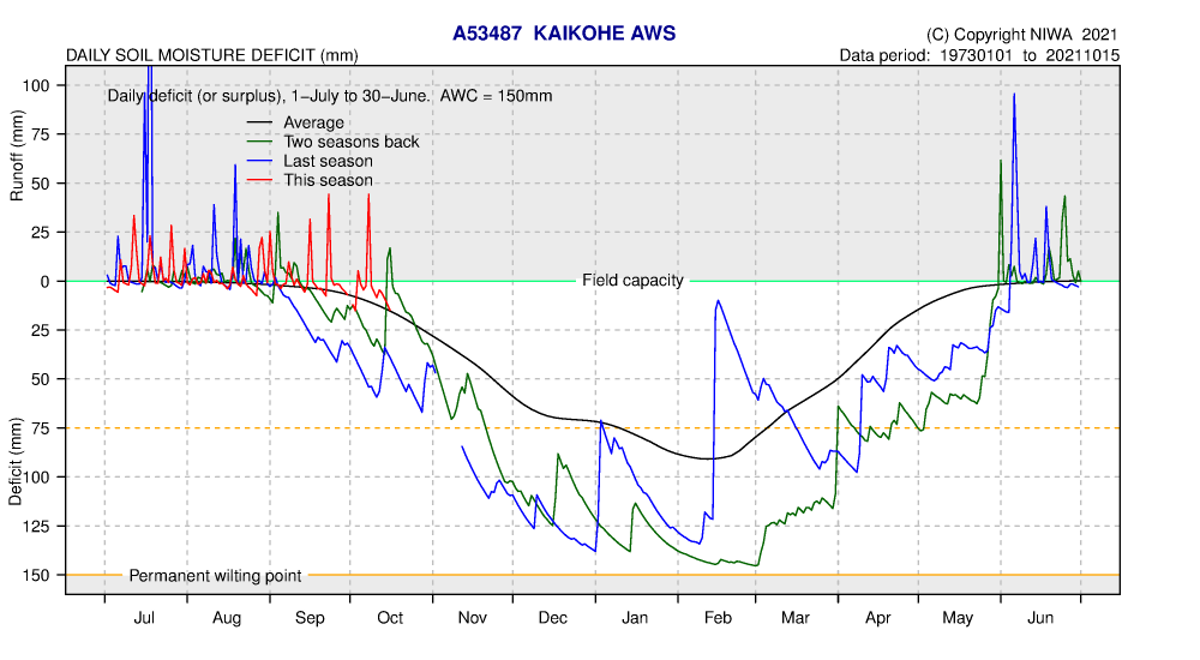
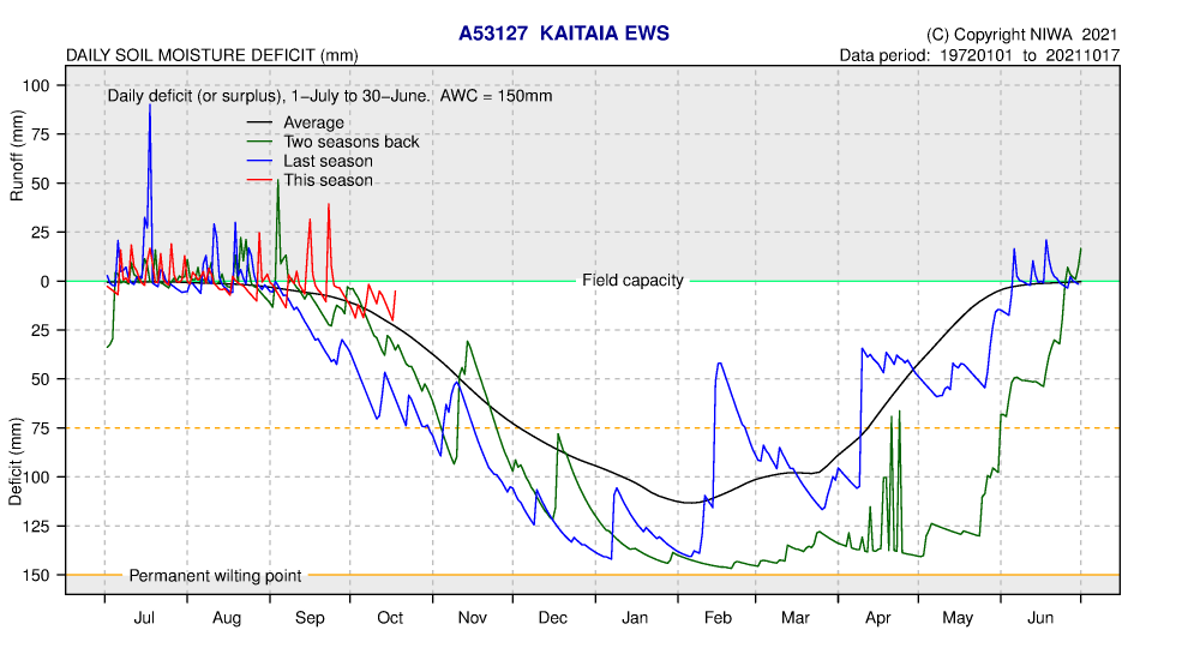
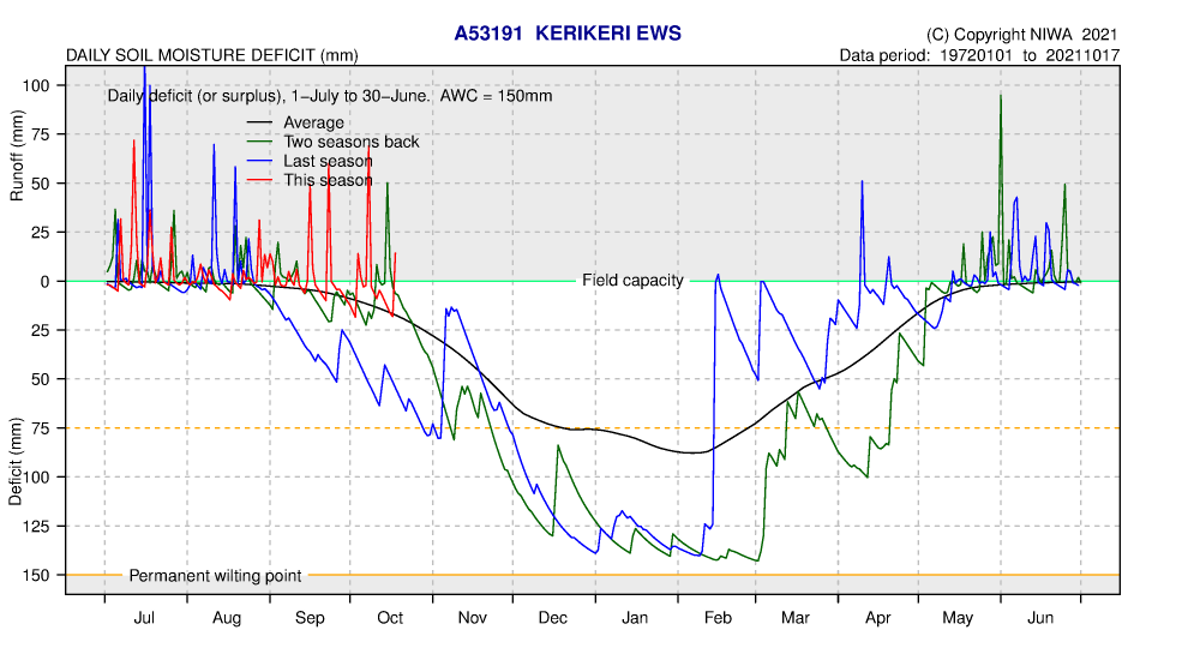
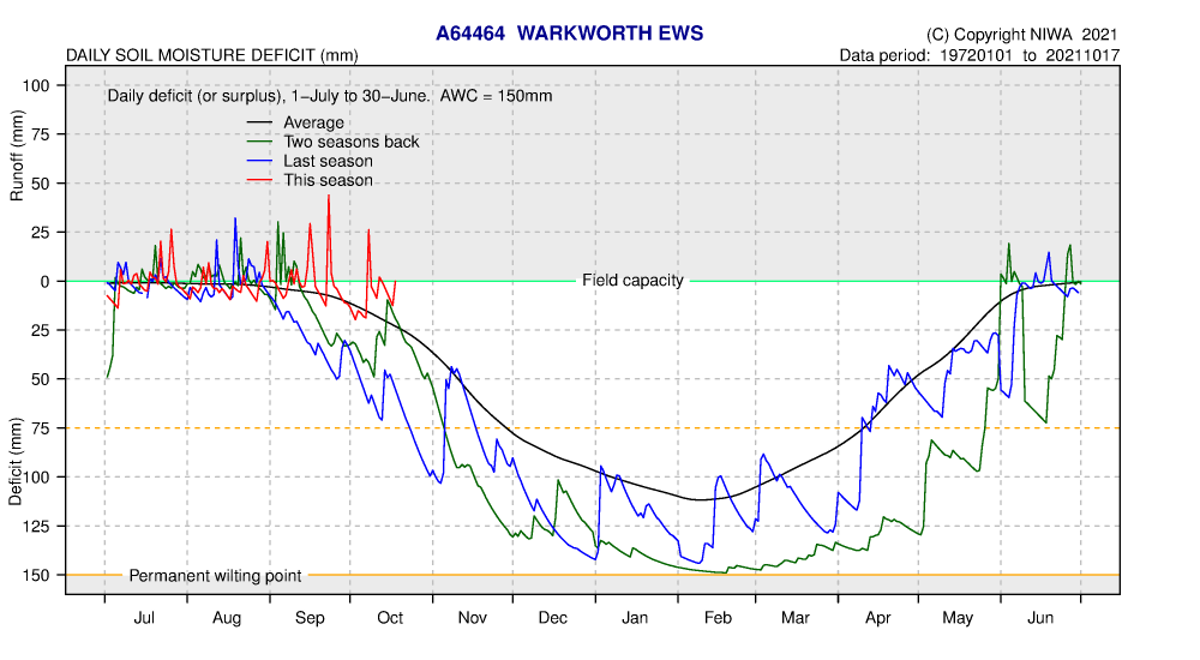
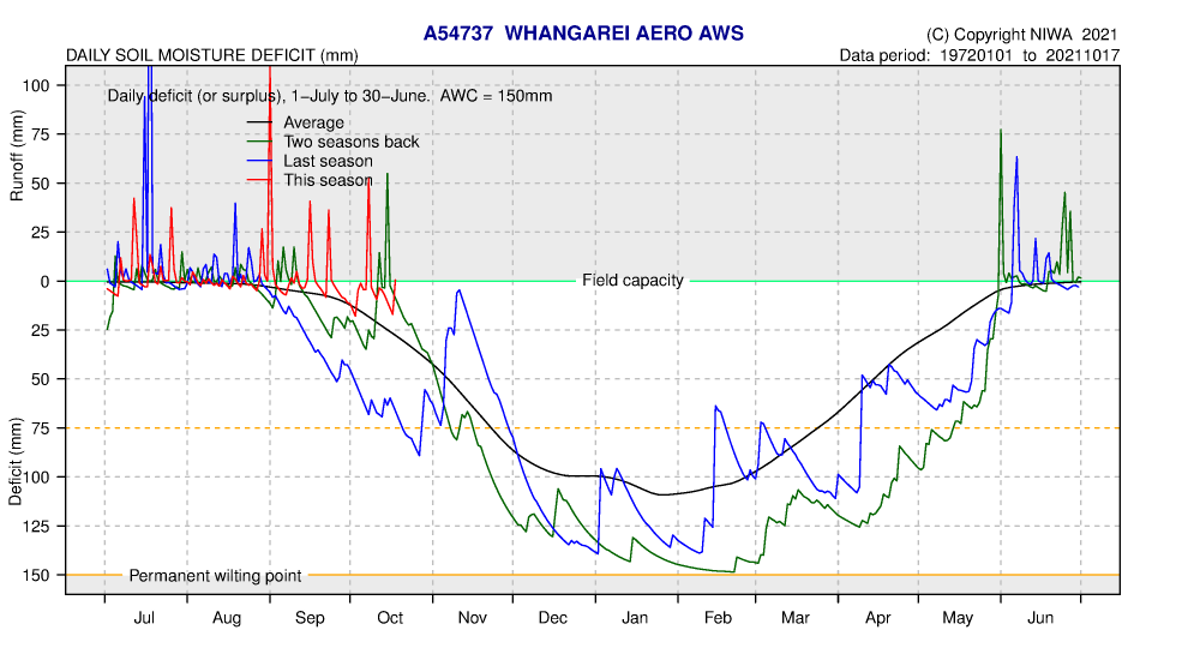
Soil moisture deficits
NIWA water balance modelling indicates soil moisture deficit is near or above normal at all NIWA climate stations and remains close to or at field capacity. “SMD is calculated based on incoming daily rainfall (mm), outgoing daily potential evapotranspiration (PET, mm), and a fixed available water capacity (the amount of water in the soil 'reservoir' that plants can use) of 150 mm” (NIWA).