October 2021 climate report
22 Nov 2021, 11:26 AM
Summary
- October 2021 was another wet month for Northland
- River flows were nearly universally “Above Normal” across the region, similar to September 2021
- Groundwater levels were near normal in most groundwater systems in response to above normal rainfall
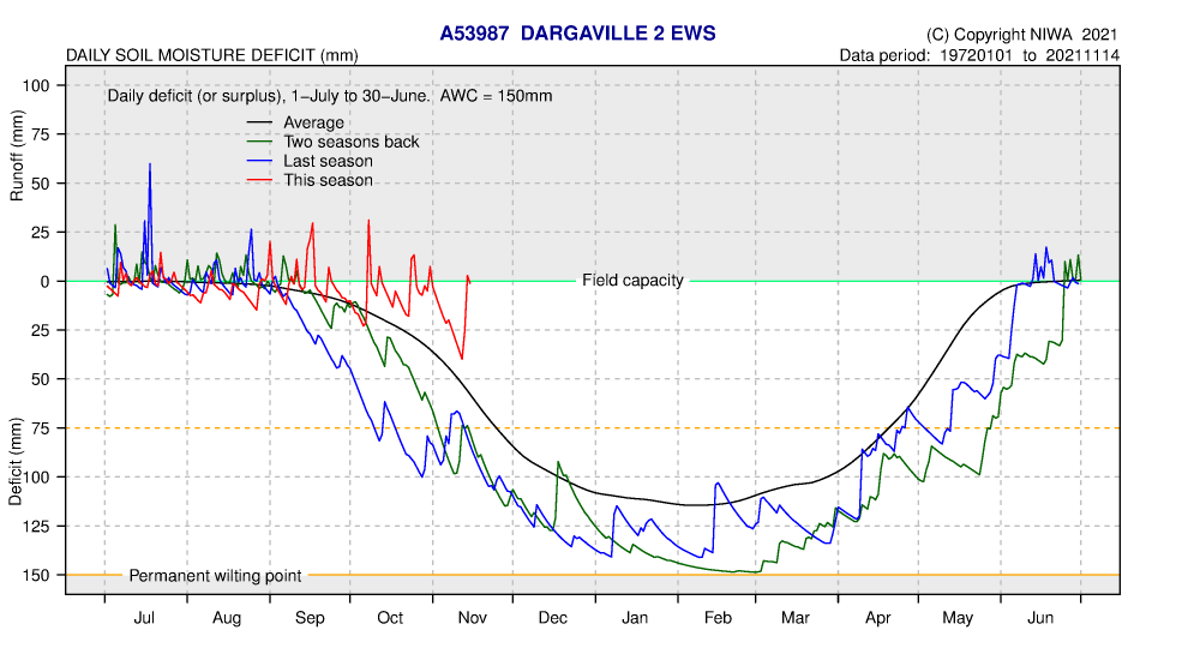
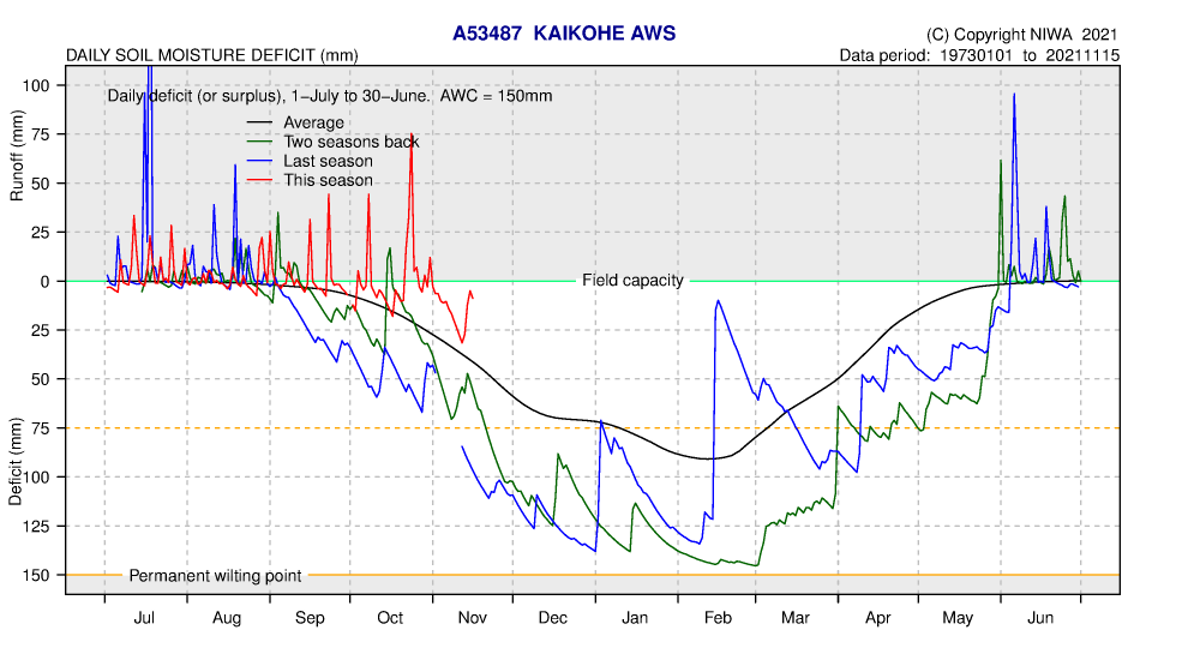
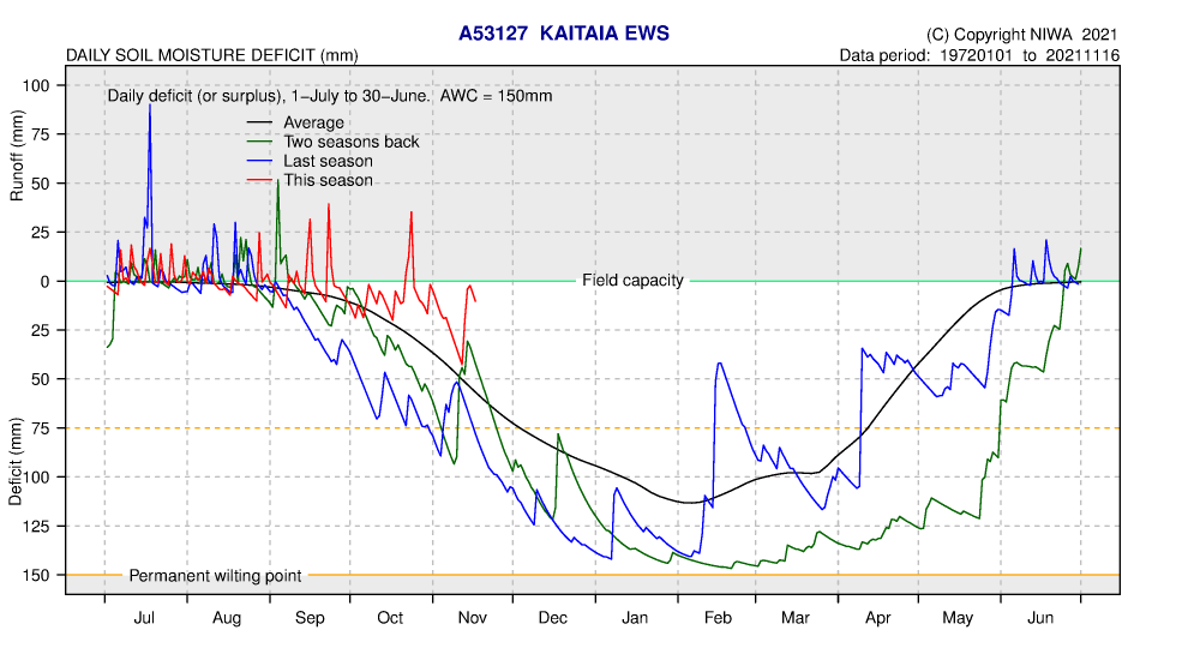
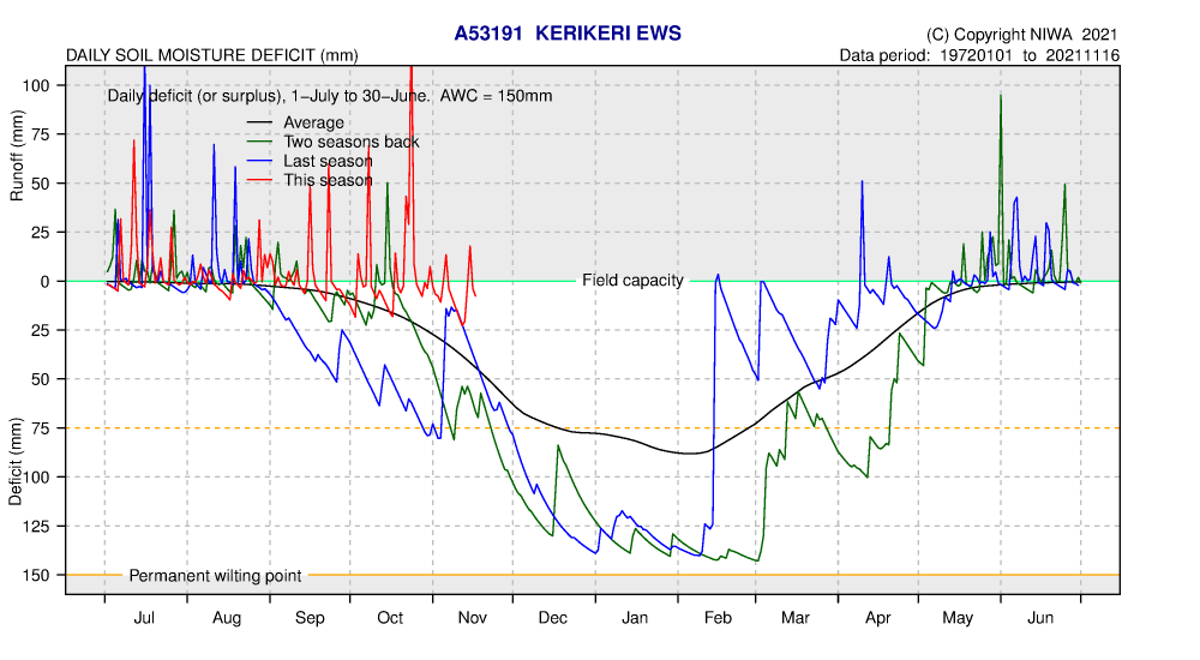
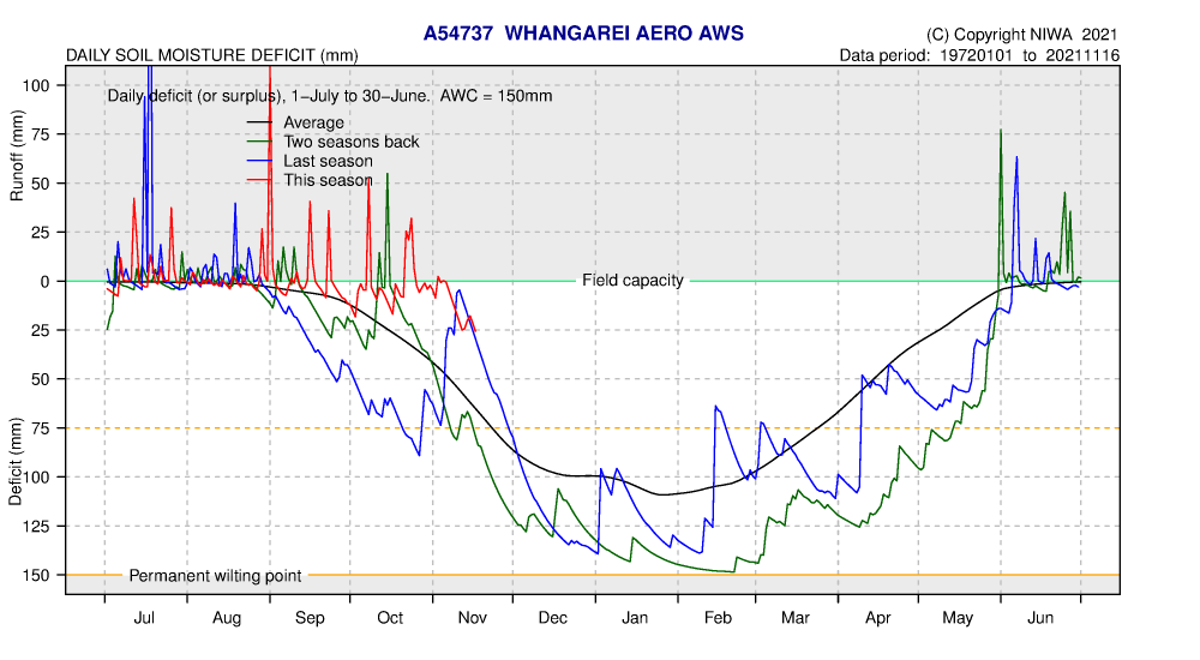
- Soil moisture remains near field capacity with frequent rain events and is much wetter than normal for this time of year
- The long-range outlook predicts near normal rainfall for the next three months, but warmer than typical temperature is very likely. NIWA note that heat wave conditions are possible over summer
Outlook
November 2021 to January 2022
The NIWA long-range outlook for November 2021 to January 2022 calls for near normal rainfall, and a near equal likelihood of normal or below normal soil moisture and river flows, likely influenced by higher than normal temperatures and increased evapotranspiration. NIWA note that La Nina conditions over summer is quite likely.
See the seasonal climate outlook on NIWA's website
The upshot of this is that the weather patterns we have observed over the last year are likely to continue, meaning that eastern areas likely to be wetter than normal, but there is a risk of south-western areas missing the rain from north-easterly rain systems and becoming dry. The likelihood of ex-tropical cyclones landing in our neck of the woods is generally increased in La Nina conditions. Typically, over the long term in New Zealand, an average of one ex-tropical cyclone reaches New Zealand shores per year. This is increased to one to two ex-tropical cyclones for 2021/22 which is considered an “Elevated” risk.
For more information, go to NIWA’s tropical cyclone outlook
NIWA Temperature, Rainfall, Soil Moisture and River Flows probabilities for the period Nov 2021 to Jan 2022
Expressed as % likelihood for either Above Average, Near Average or Below Average conditions.
| Temperature | Rainfall | Soil moisture | River flows | |
| Above average | 65• | 30 | 15 | 10 |
| Near average | 30 | 45• | 45• | 45• |
| Below average | 05 | 25 | 40 | 45• |
Rainfall
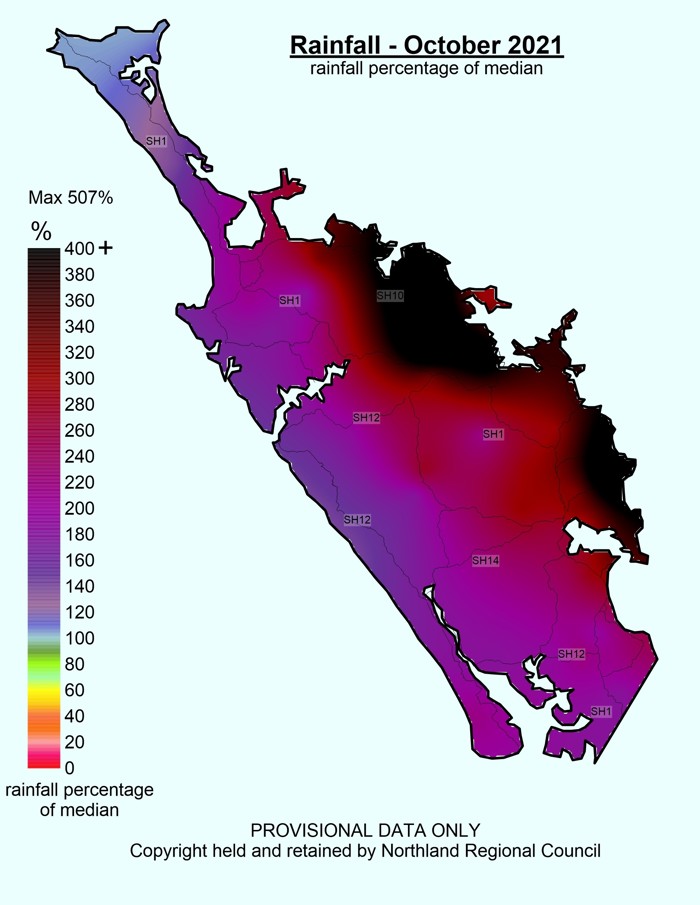
October 2021 was a very wet month for the region overall. Cape Rēinga was the “driest” monitored location in Northland during October with 79.6mm followed by Kimberly Road (Houhora) a bit further south with 115mm. The wettest sites were Touwai at Weta with 463.5mm, Ngunguru at Dugmores Rock 421mm and Waitangi at Wiroa Road 409mm. Across all Northland stations, the region received an average of 244mm for October. Percentages of median in October were very high (median as an indication of what we would usually expect).
No rainfall monitoring stations had less than expected rainfall (less than 100%). Cape Rēinga recorded 105% while both Ngunguru and Waitangi Wiroa Road were nearly 500% of typical October rainfall - significantly wet. The region averaged 264% of typical rainfall as a whole. Two severe weather warnings were issued during October, the first on the 7th with no notable flooding and the second on the 22nd, which was a very drawn-out event and caused some minor flooding around the Oruru River flats and Kaeo.
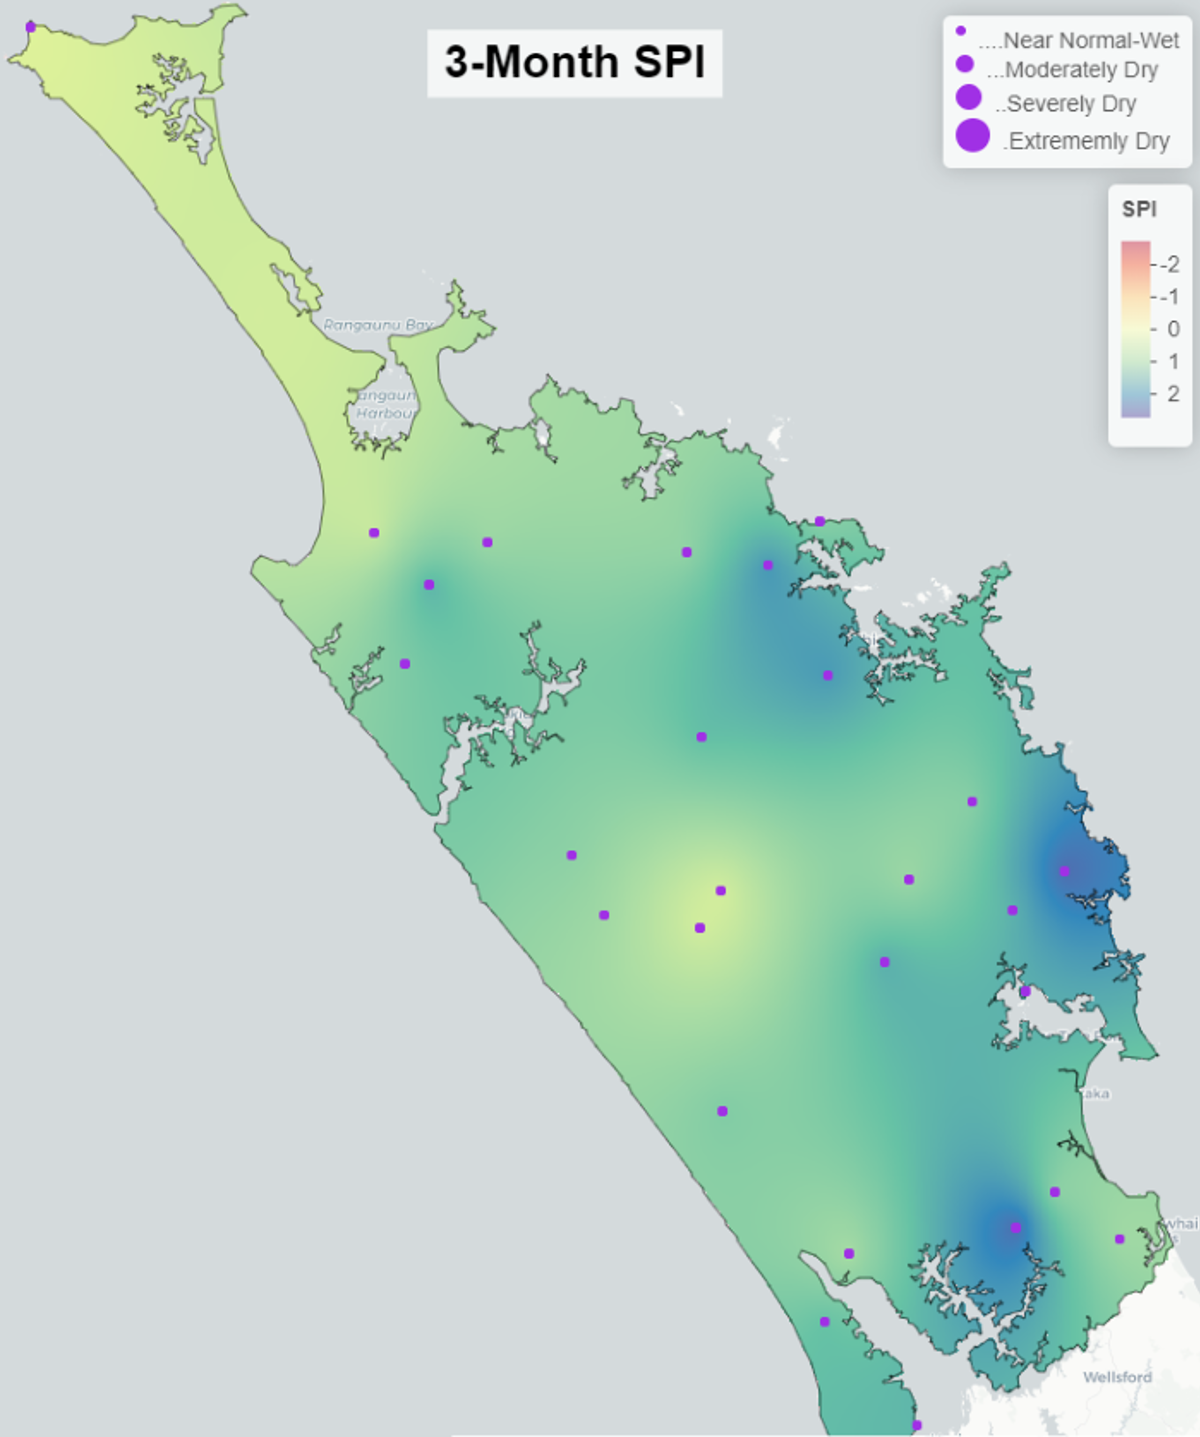
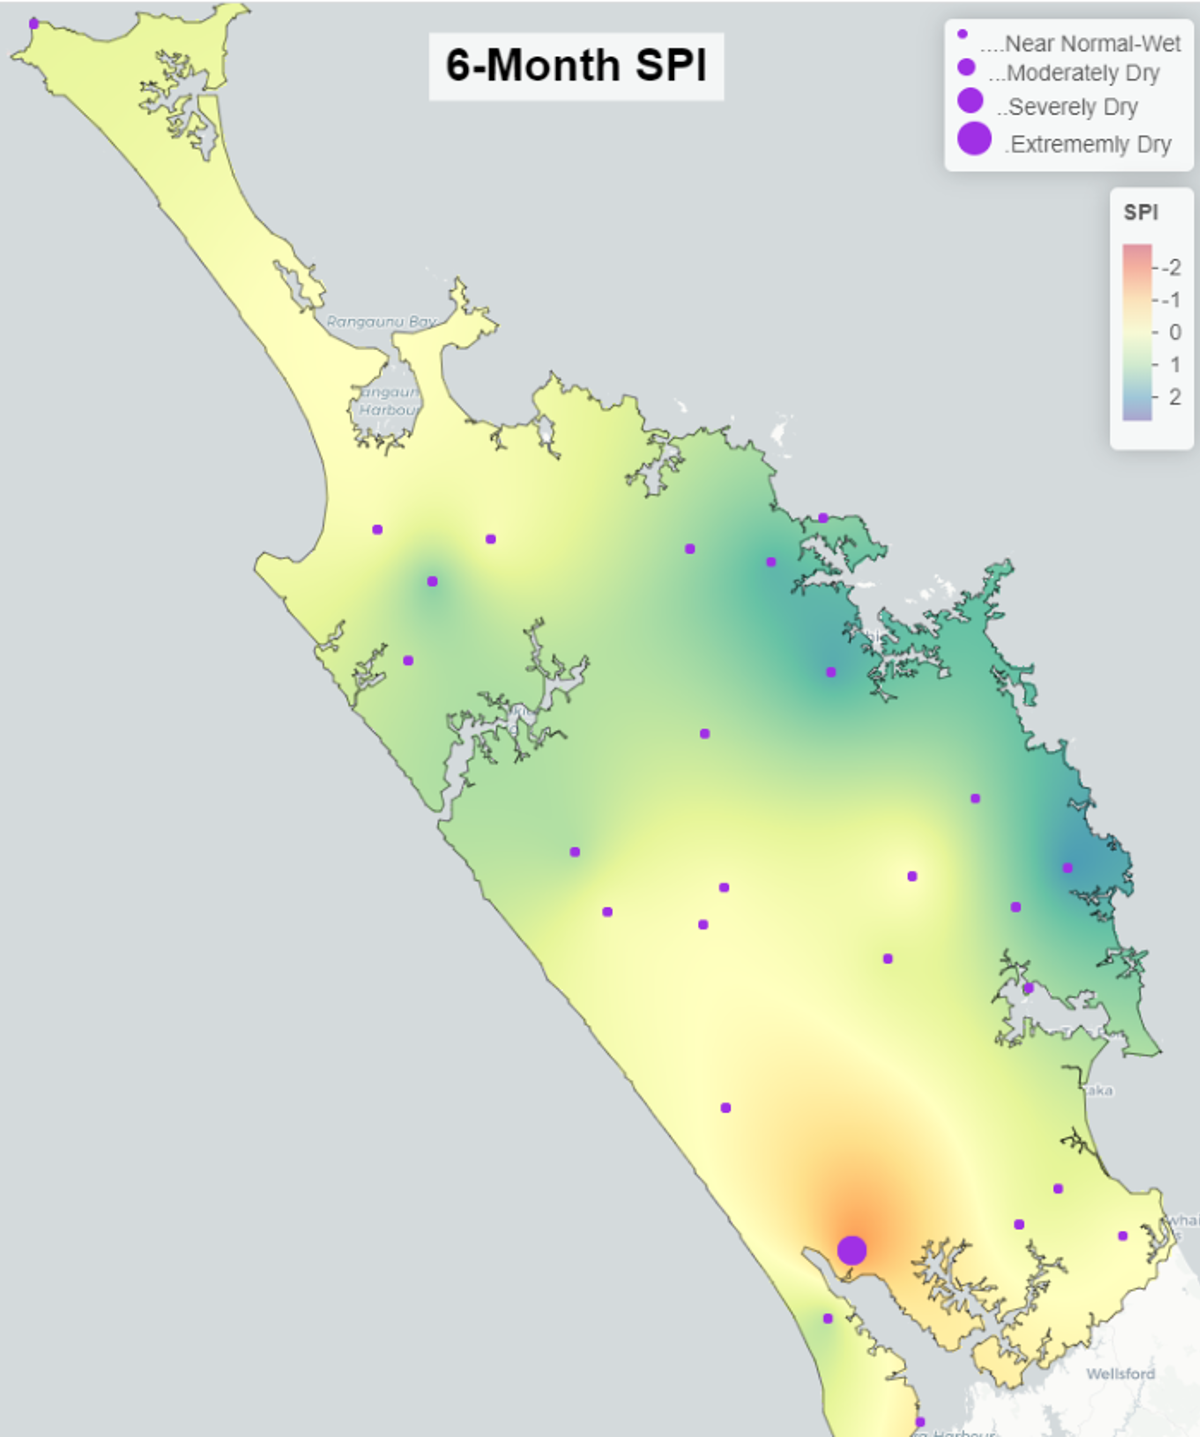
Three-month SPI (Standardised Precipitation Index) values for the last three months reflect the very wet conditions experienced in September and October 2021 (see the map below). SPI over the 6-month period are similar, with the exception of Ruawai which was consistently drier than other areas during Winter. Dryness in this area is not uncommon in La-Nina type weather conditions when north-easterly rain systems prevail.
Rainfall % median map for October 2021
SPI Index map for 3 and 6 months to the end of October 2021


Rainfall deficit values (mm)
Negative values represent rainfall deficit, positive values represent rainfall in excess of “typical” rainfall
| Site | End date | 1 Month | 3 Months | 6 Months | 12 Months |
| Kaitaia Ews | October 2021 | 64.30 | 79.54 | 28.70 | -19.77 |
| Kerikeri Ews | October 2021 | 317.80 | 340.12 | 400.09 | 360.09 |
| Kaikohe Aws | October 2021 | 194.25 | 200.25 | 190.52 | 33.46 |
| Whangārei Aero Aws | October 2021 | 150.23 | 249.59 | 285.18 | 253.10 |
| Hokianga Harbour at Omapere/Opononi | October 2021 | 48.91 | 60.08 | 24.53 | 36.24 |
| Dargaville 2 Ews | October 2021 | 87.60 | 110.43 | -9.58 | -85.68 |
| Awaroa at Wallace Road | October 2021 | 60.11 | 48.77 | -109.74 | -53.14 |
River flow
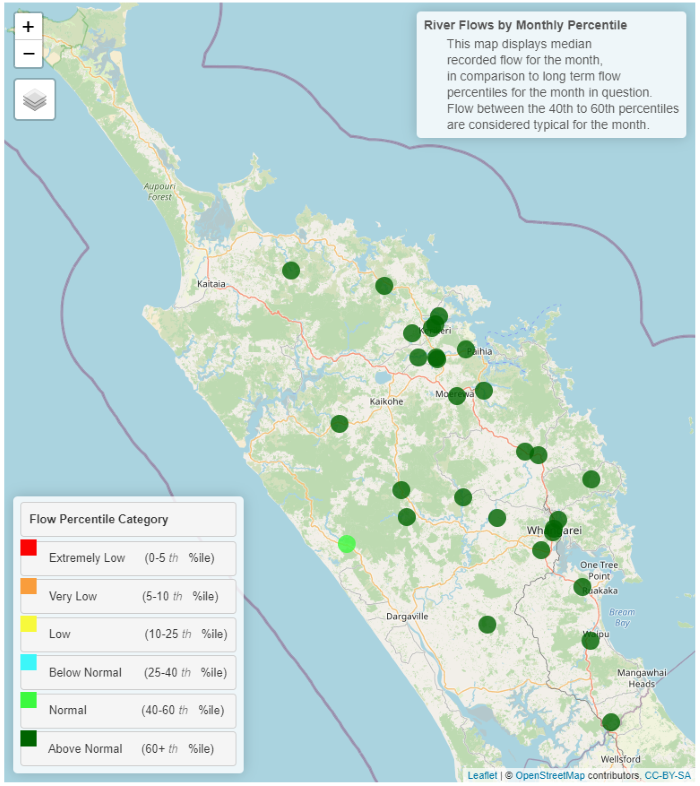
River flows during October 2021 were similar to September and nearly universally above normal for the month compared to average October flow. This is largely driven by the frequent rain events that occurred during the month, particularly the two severe weather events on the 7 and 22 October.
Flow map October 2021
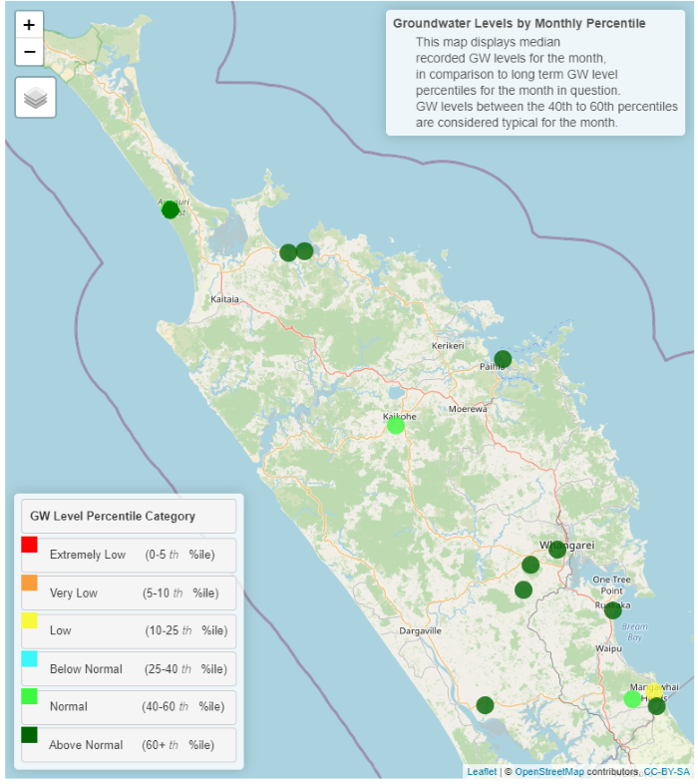
Groundwater
During October 2021 groundwater levels were “Normal” or “Above Normal” in most locations and classified as “Low” in the Mangawhai aquifer, but water level recovery here is continuing. A wet winter and spring in most areas has enabled groundwater to recover well from low summer levels.
Northland aquifer status table for October 2021
| Groundwater systems | Status | Percentile |
| Aupōuri | Above normal | 60th+ |
| Taipā | Above normal | 60th+ |
| Russell | Above normal | 60th+ |
| Kaikohe | Normal | 40-60th |
| Poroti | Above normal | 60th+ |
| Whangārei | Above normal | 60th+ |
| Mangawhai | Low | 10-25th |
| Marsden - Ruakākā | Above normal | 60th+ |
| Ruawai | Above normal | 60th+ |
Northland aquifer status map October 2021