February 2021 climate report
3 Mar 2021, 8:17 AM
Summary
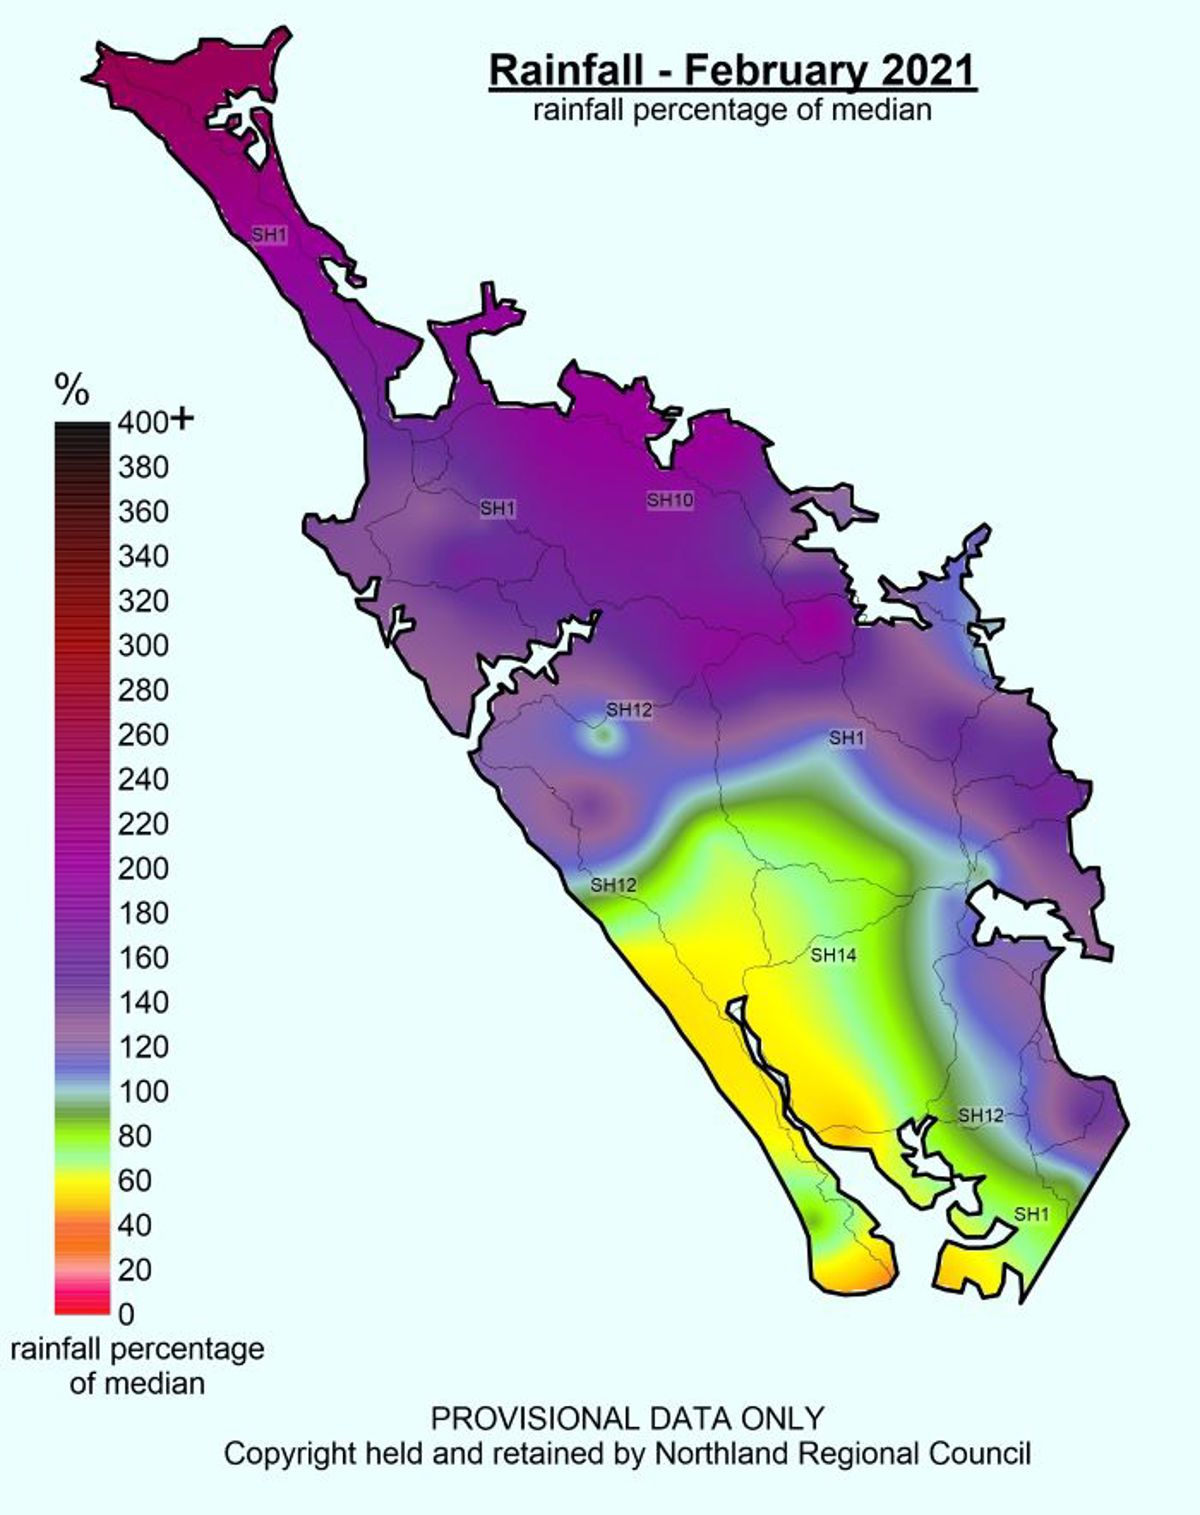
- February 2021 was a wet month for the north of the region, but drier than normal in Dargaville, Ruawai, Paparoa and Maungaturoto.
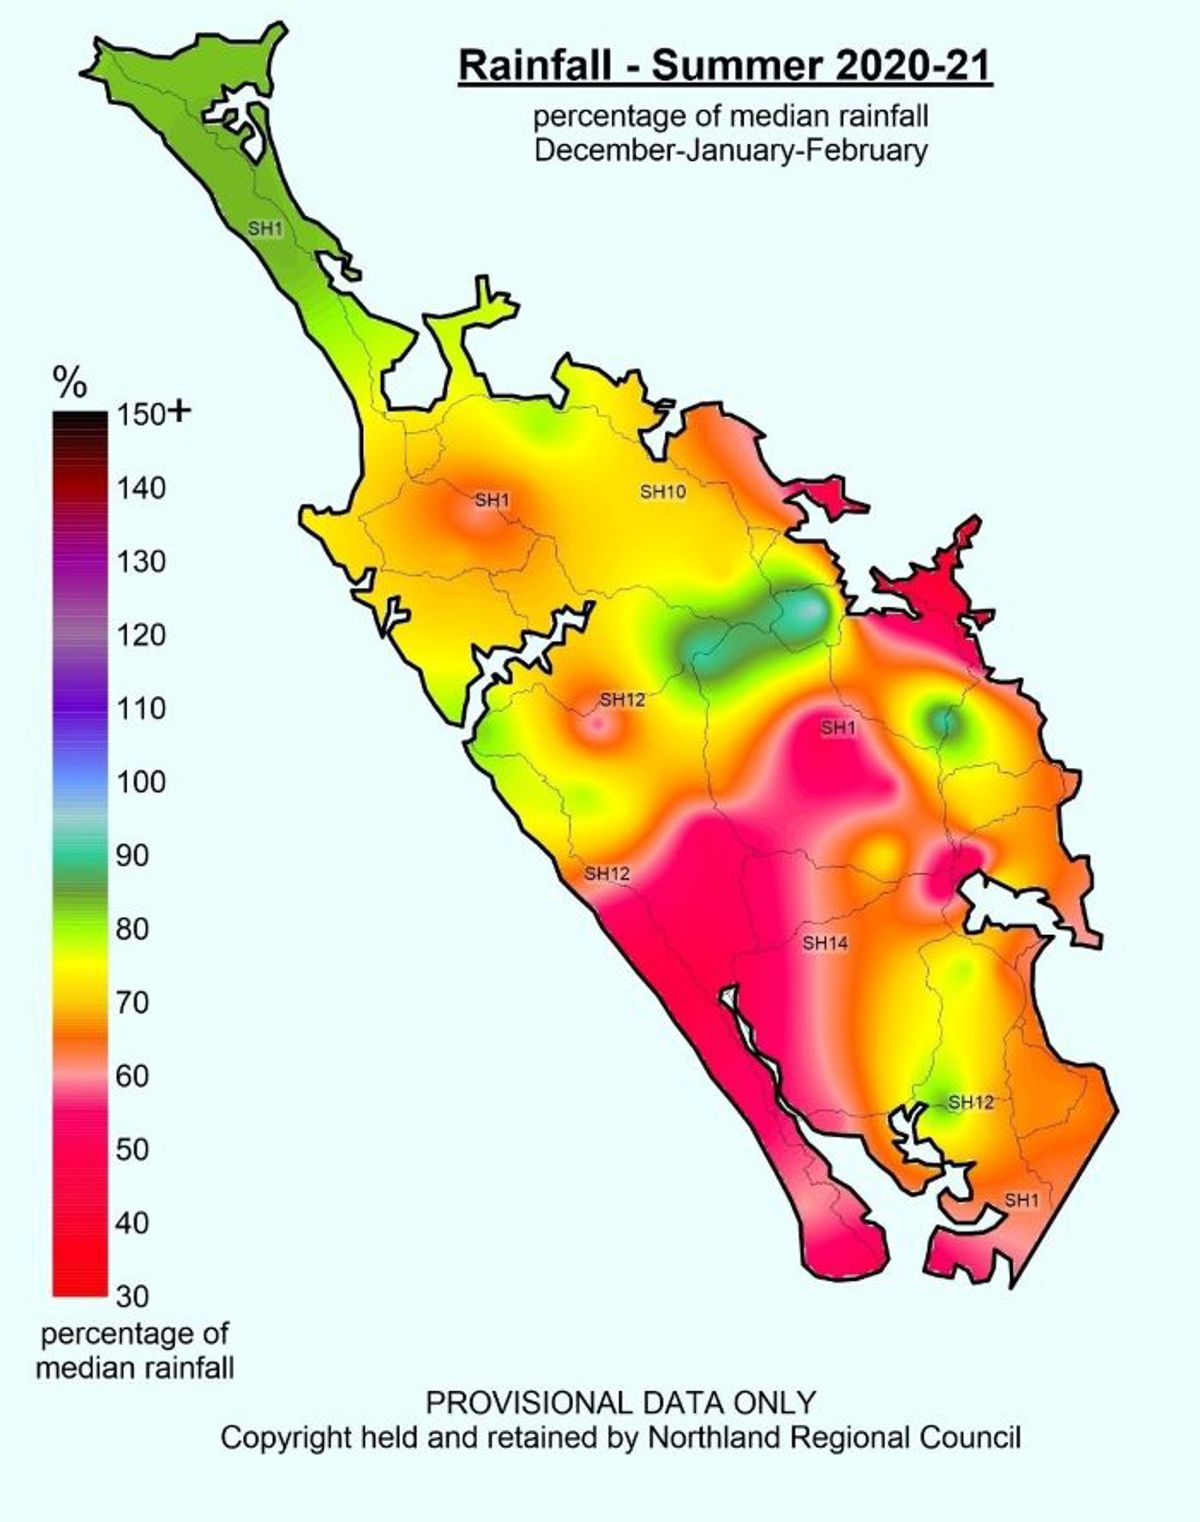
- Summer 2020/21 was drier then typical summers. Areas to the north of the Bay of Islands received 70-90% and areas to the south received around 50-70% of the expected summer rain.
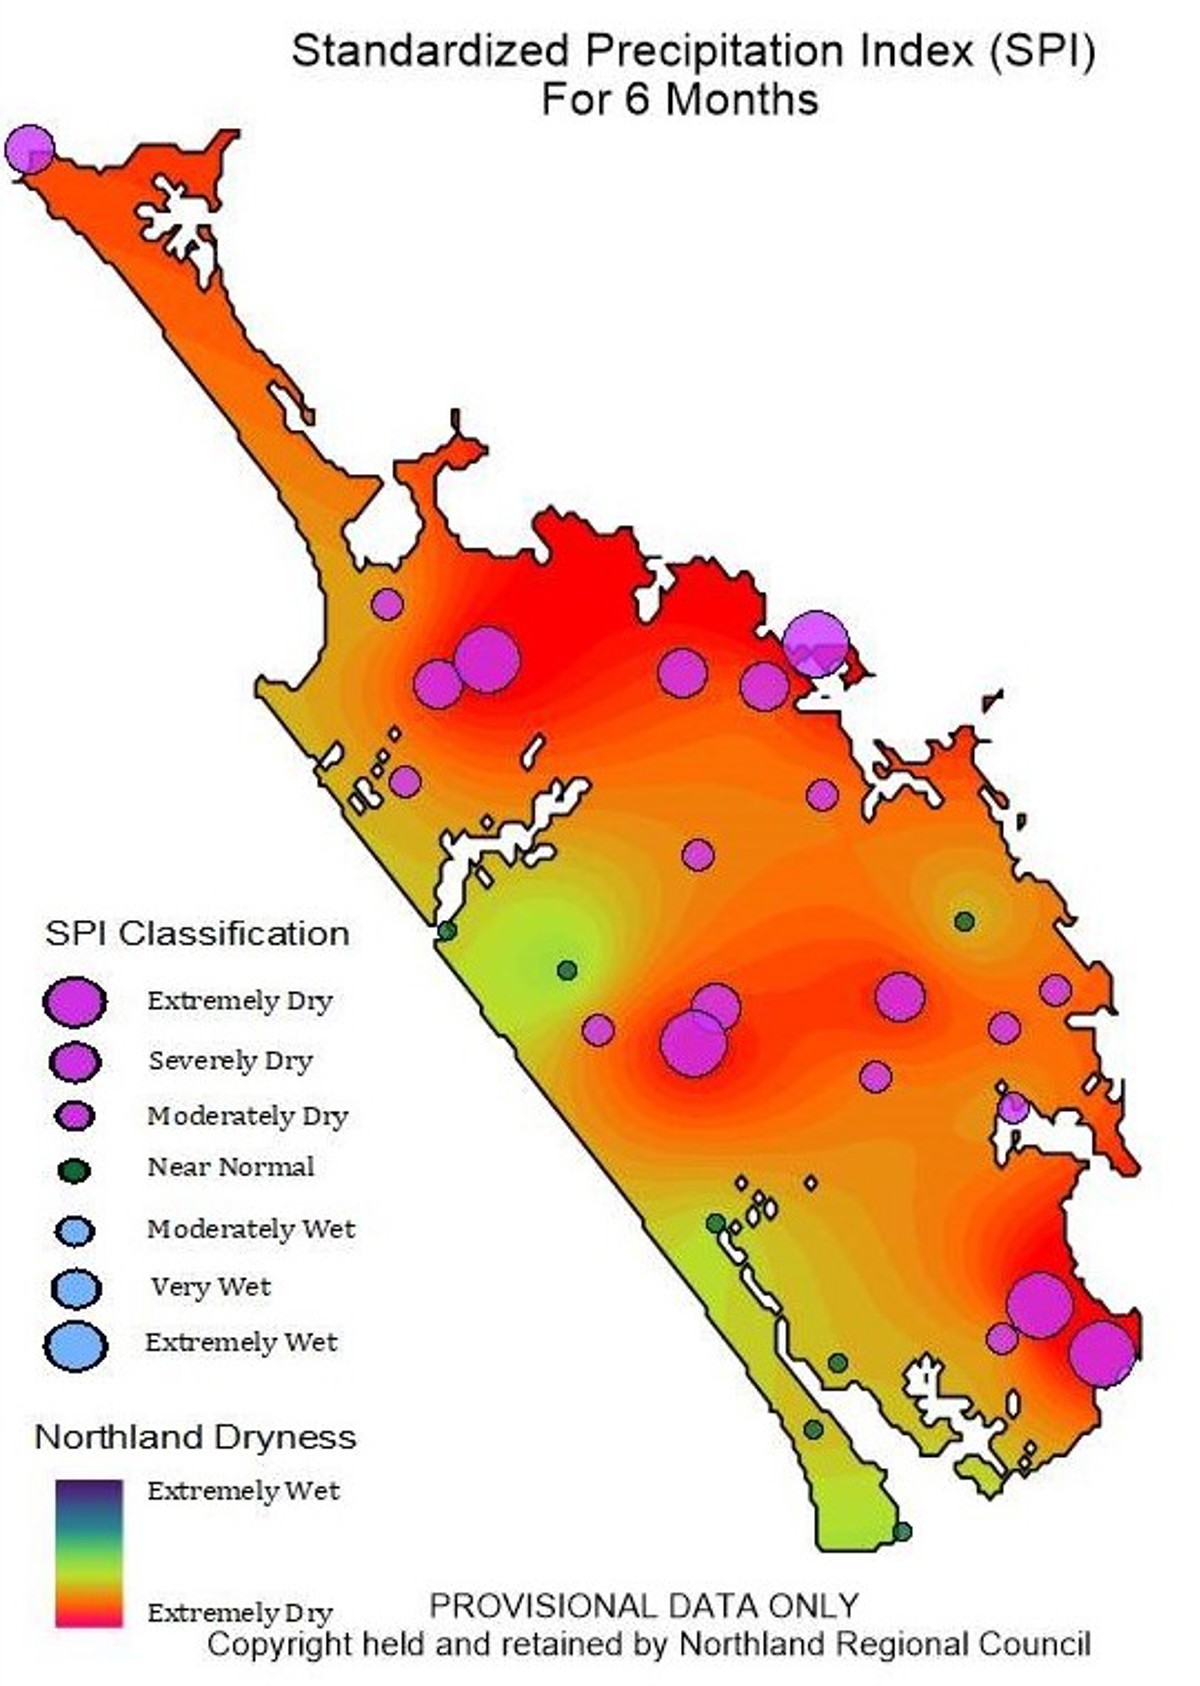
- The previous 6 months from September 2020 to February 2021 can be categorised as drier than normal, with a rainfall deficit of around 25% across the region and an SPI rainfall Index indicating “severely dry” to “extremely dry” conditions in many areas.
- River flows for February were lower than normal across the region, except the Waitangi catchment. There was a wide range in flow conditions with various rivers responding to rainfall in the middle of the month differently.
- Groundwater is generally lower than normal across the region except the Aupouri aquifer. Mangawhai and Poroti are particularly low (0-5th percentile for February).
- Soils are either wetter than average or around average for this time of year at all NIWA climate stations, except Dargaville, which missed out on the rain during the mid-February rain event.
- The three-month outlook is for near normal rainfall and the chance of subtropical storms remains over March.
- Given the dry 6-month period observed, and the prediction for lower than normal soil moisture conditions over the next three months, there remains a risk of low rivers and groundwater conditions over Autumn. One or two good storms could change this outlook.
Outlook
March to May
The long-range outlook for March to May 2021 is for near normal rainfall for Northland. NIWA predict that we may begin to get the more variable weather typical of Autumn and less impact from the La Niña climate conditions. There is still the chance of Northland being impacted from cyclone activity during March which could alter this outlook. Soil moisture conditions are currently near normal, but NIWA predict soil moisture to drop back down to below average conditions over the next 3 months.
NIWA Temperature, Rainfall, Soil Moisture and River Flows probabilities for March to May 2021
| Temperature | Rainfall | Soil moisture | River flows | |
| Above average | 40• | 25 | 20 | 20 |
| Near average | 40• | 45• | 30 | 35 |
| Below average | 20 | 30 | 50• | 45• |
Rainfall
The month of February began dry, until some widespread showers occurred on the 11th. This rainfall did little for Northland rivers but partially alleviated the ongoing soil moisture deficit across the region. The next event from the 14th to 15th provided further rainfall across the region, with some heaver rainfall up to 20mm/hr, further decreasing the regions soil moisture deficit. Parts of the region missed out on this rainfall, with February rainfall totals at Dargaville, Ruawai, Paparoa and Maungaturoto below normal for the month.
Summer 2020/21 was drier than normal across Northland overall, with areas to the north of the Bay of Islands receiving 70-90% and to the south, around 50-70% of the expected summer rain. The majority of this rainfall fell in February.
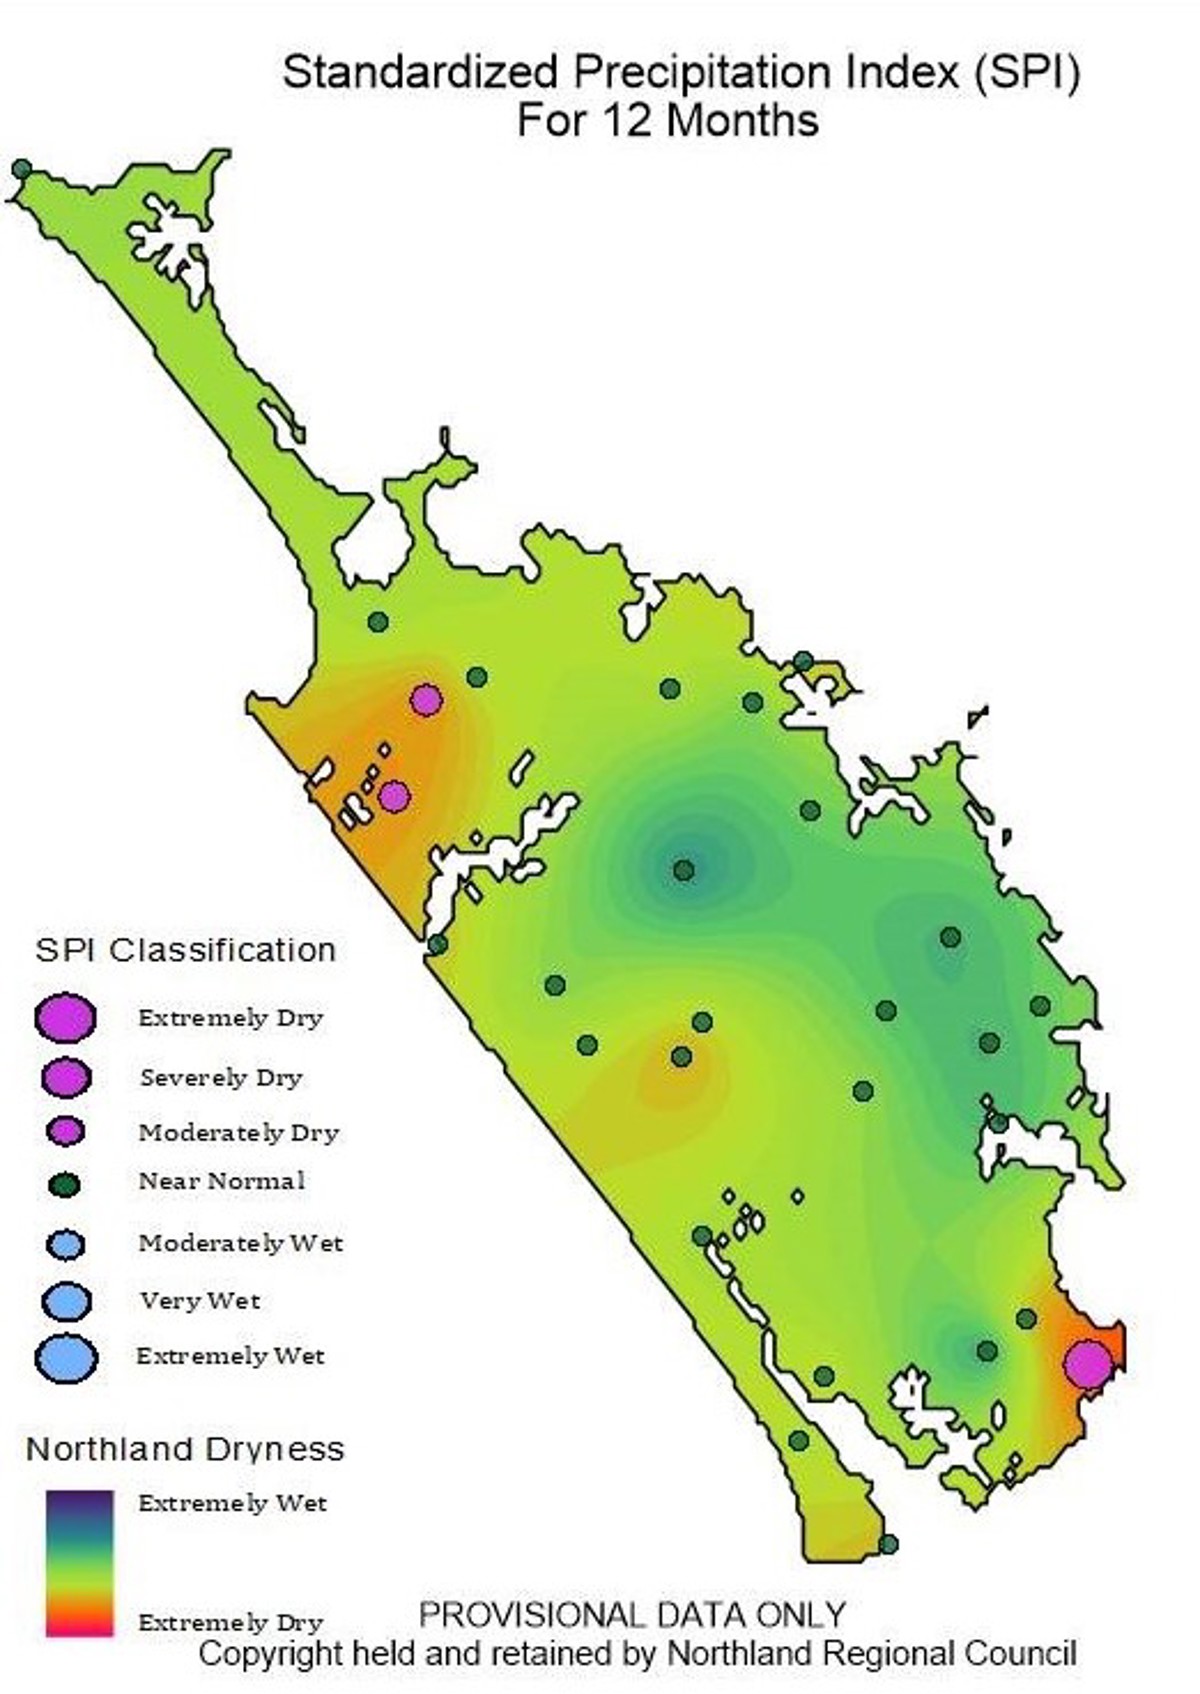
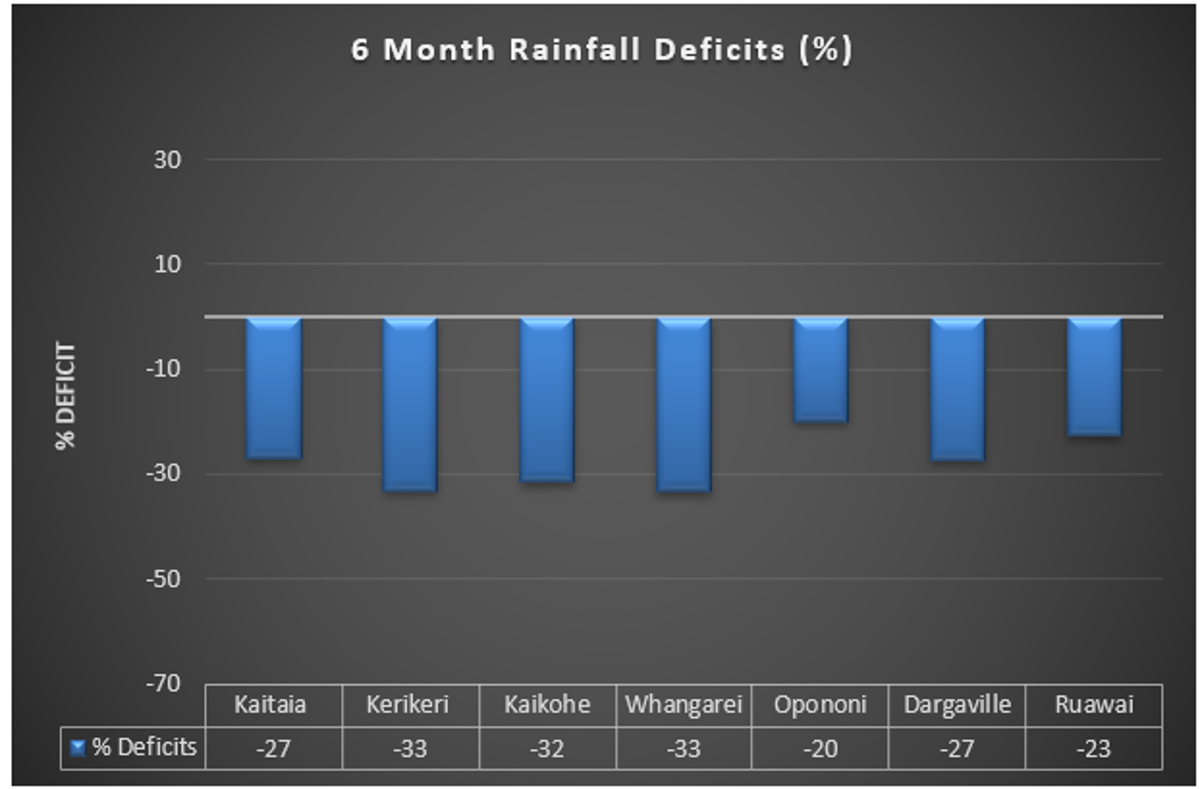
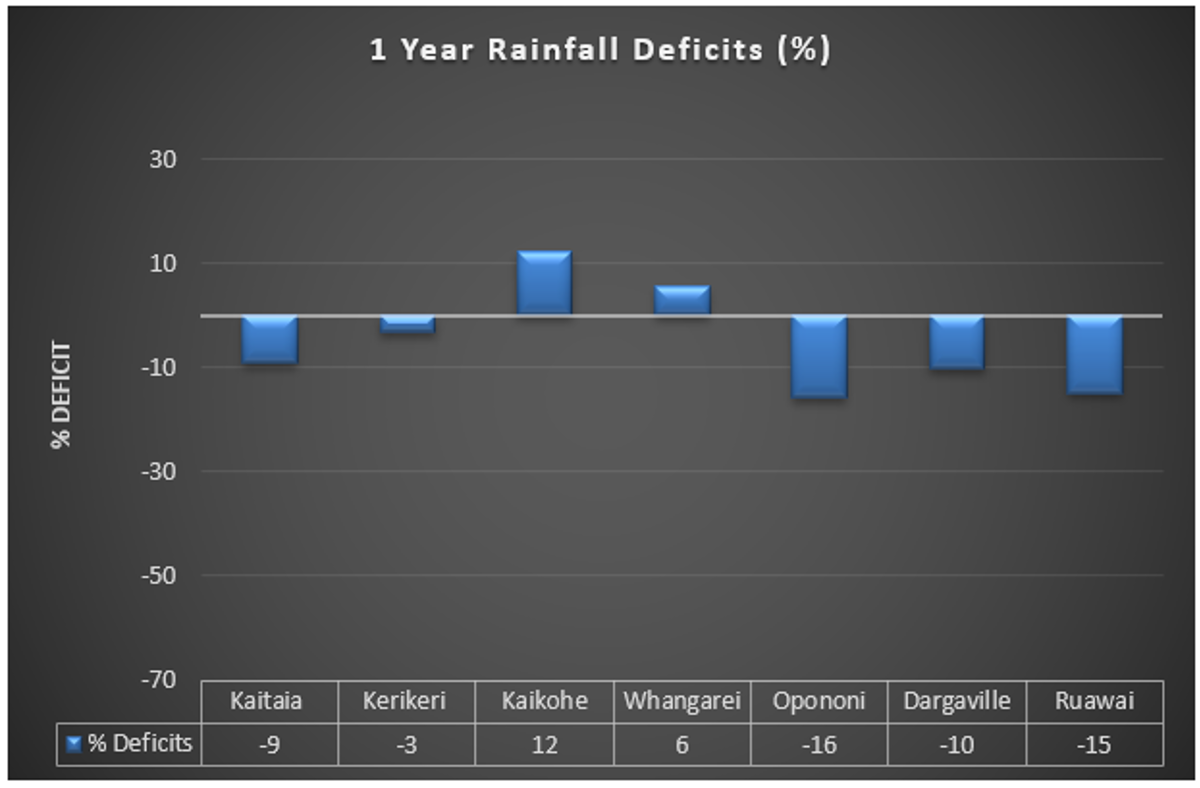
Over longer time scales, rainfall deficit figures and SPI analysis for the last 12 months (see rainfall deficit table and SPI map) show that recorded rainfall has been near normal for most of the region over this period. However, for the 6-month period there is a rainfall deficit of between 20% and 33% across the region and the NRC SPI index reports “severely dry” to “extremely dry” conditions in many areas. Dry conditions over the is 6-month period can lead to low groundwater levels as currently observed across the region.
Rainfall % median maps for February 2021
SPI Index map for 6 and 12 months to the end of February 2021
One year and six-month rainfall deficit percentage values
River flow
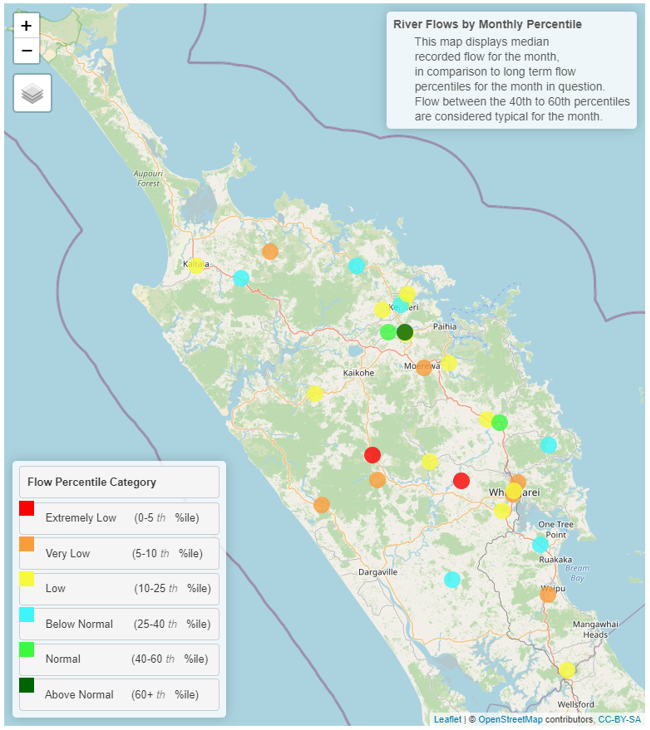
Rainfall on the 14th and 15th February gave most rivers across the region a moderate flushing flow, but with rivers receding quickly thereafter. For the month overall, river flow percentiles varied widely, ranging from “Extremely Low” in the Mangere and Mangakahia rivers to “Normal” in the Waitangi River. It seems that there were a wide range of impacts from the 14th and 15th rainfall event on river flows for the month as a whole. Despite the reasonable rainfall on these days, most rivers are categorised as “Below Normal” or lower for the month.
Flow Map February 2021
Groundwater
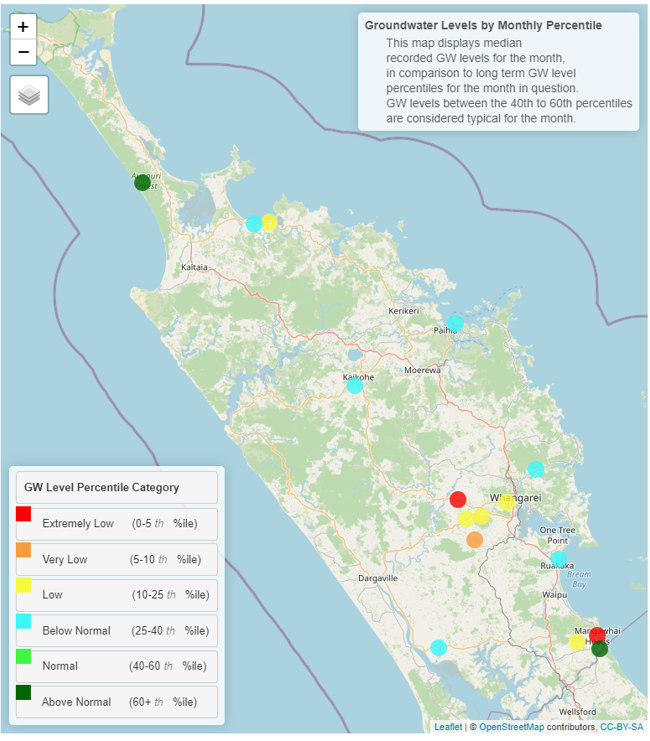
During Feb 2021 Groundwater levels were below normal in the Taipa, Russell, Kaikohe, Poroti, Whangārei, Marsden Point and Ruawai, and well below normal in the Mangawhai and Poroti groundwater systems (0 to 5h percentile). Groundwater levels were above normal in the Aupouri groundwater system.
Northland aquifer status table
| Groundwater systems | Status (February 2021) | Percentile |
| Aupouri | OK | >60th |
| Taipa | LOW | 10-25th |
| Russell | BELOW NORMAL | 25-40th |
| Kaikohe | BELOW NORMAL | 25-40th |
| Whangārei | LOW | 10-25th |
| Poroti | EXTREMEMLY LOW | 0-5th |
| Mangawhai | EXTREMEMLY LOW | 0-5th |
| Marsden-Ruakaka | BELOW NORMAL | 25-40th |
| Ruawai | BELOW NORMAL | 25-40th |
Northland aquifer status map
Soil moisture deficits
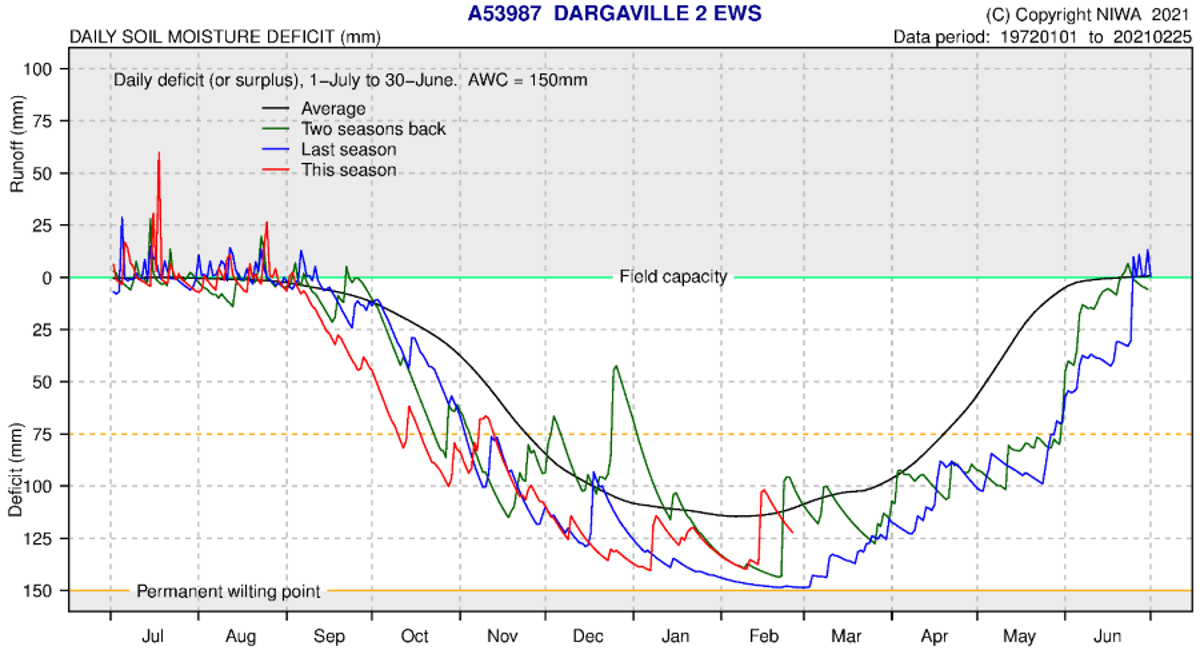
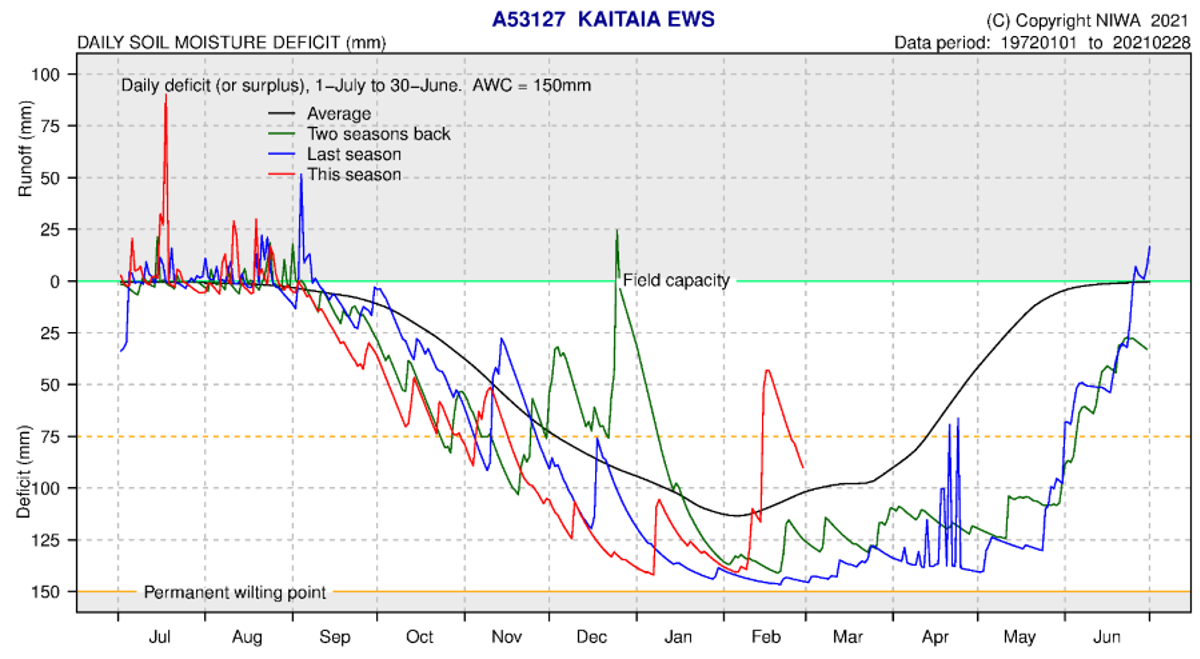
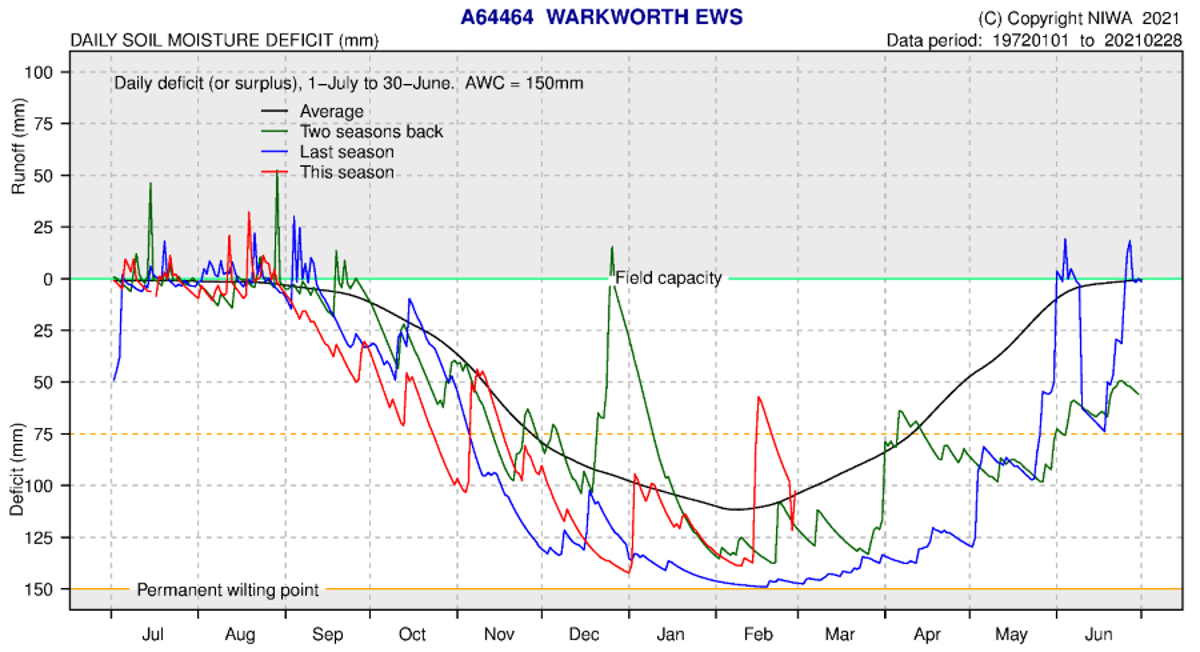
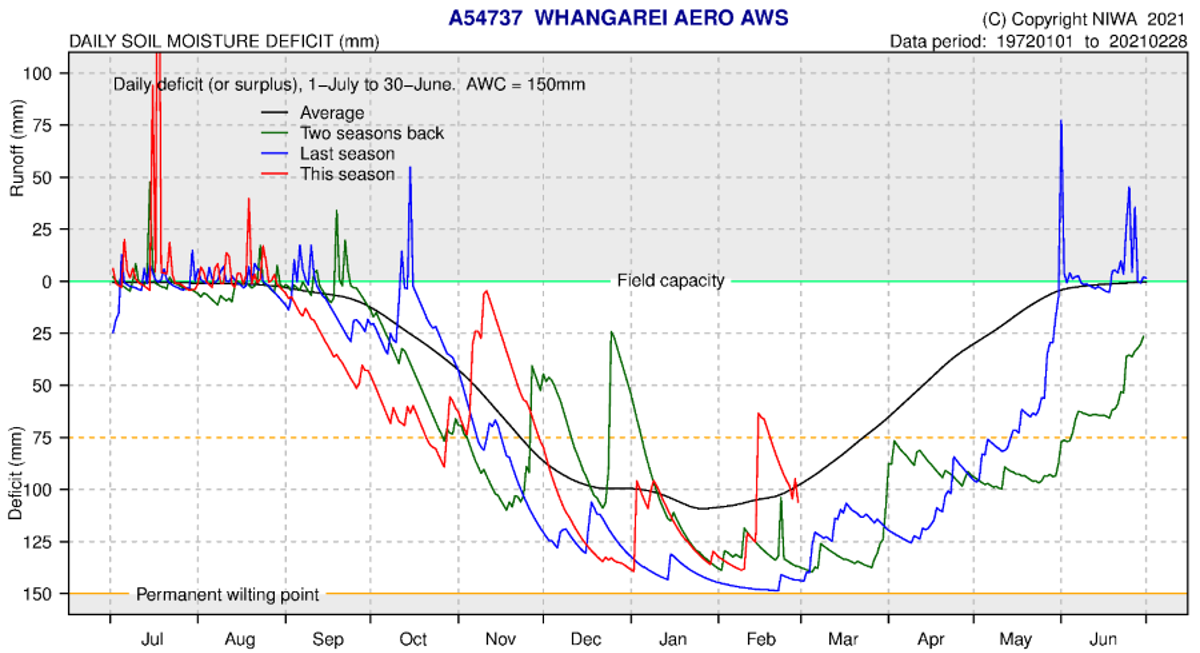
NIWA water balance modelling indicates soil moisture deficit is below average at the Dargaville NIWA climate station, with the other stations recording higher soil moisture than average for this time of year due to the rainfall event beginning on the 14th Feb. “SMD is calculated based on incoming daily rainfall (mm), outgoing daily potential evapotranspiration (PET, mm), and a fixed available water capacity (the amount of water in the soil 'reservoir' that plants can use) of 150 mm” (NIWA).
Soil moisture deficit at NIWA climate stations
| NIWA Climate Stations | Observed Soil moisture deficit (mm) as of 28/02/2021 | Average 28 February soil moisture deficit | Difference between Expected and Average |
| Kaitaia | -90mm | -100mm | 10 |
| Kerikeri | -50mm | -75mm | 25 |
| Whangārei | -100mm | -100mm | 0 |
| Kaikohe | -50mm | -75mm | 25 |
| Dargaville | -125mm | -110mm | -15 |
| Warkworth | -100mm | -100mm | 0 |