May 2021 climate report
22 Jun 2021, 11:00 AM
Summary
- Broadly speaking, May 2021 was a dry month for the region
- Rainfall over longer timeframes (the previous 6 months) can be categorised as “Moderately Dry” to “Severely Dry” in eastern areas
- River flows were generally lower than normal for May, particularly in the northern sub-catchments of the Wairoa River
- Groundwater levels for the month were below normal for most areas except Aupouri and Ruawai, and “Very Low” in Whangarei, Poroti and Mangawhai
- Soil moisture is near average for this time of year at all NIWA climate stations
- The NIWA three-month outlook is for near normal rainfall
Outlook
June to August:
The long-range outlook for June to August 2021 is for near normal rainfall, soil moisture and river flows for Northland. Temperature is still likely to be above normal during this period.
NIWA Temperature, Rainfall, Soil Moisture and River Flows probabilities for June to August 2021
| Temperature | Rainfall | Soil moisture | River flows | |
| Above average | 50• | 30 | 20 | 20 |
| Near average | 45 | 45• | 40• | 45• |
| Below average | 05 | 30 | 40• | 35 |
Rainfall
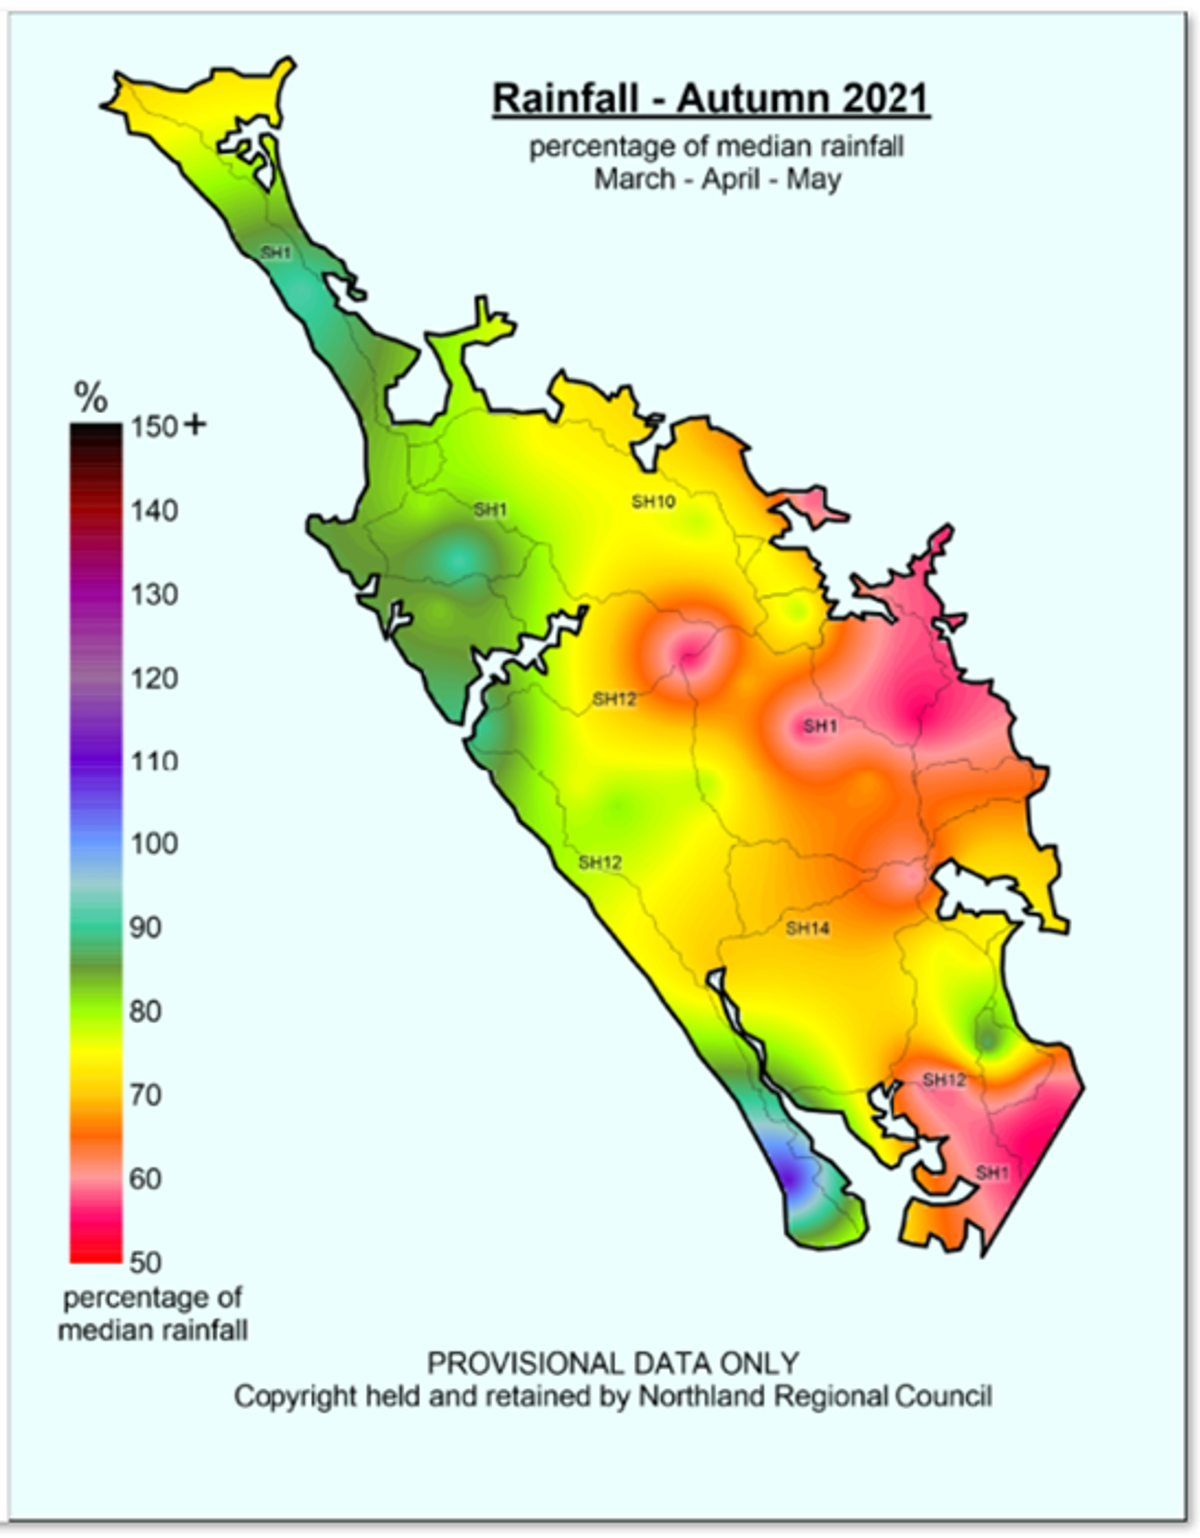
May 2021 was a dry month for Northland overall with rainfall ranging from between 30% of typical rainfall to 75% of typical rainfall. There were no significant weather events during the month.
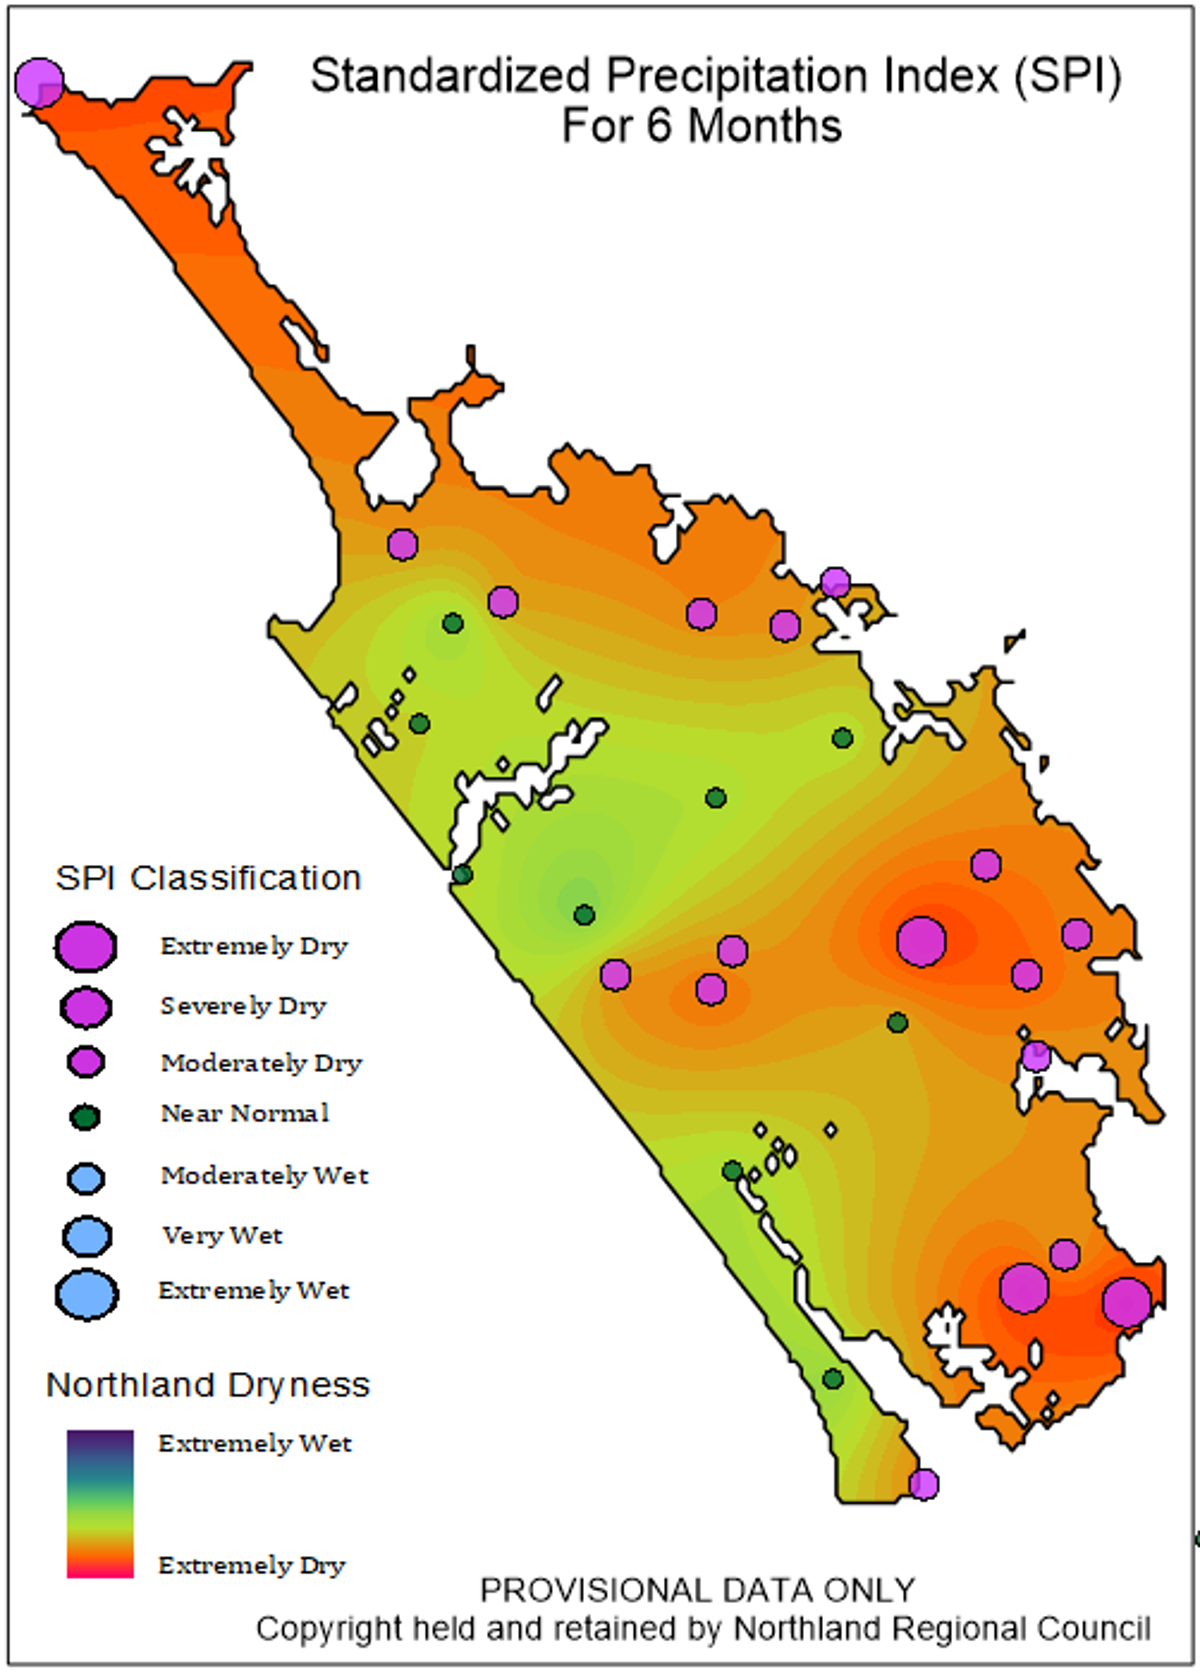
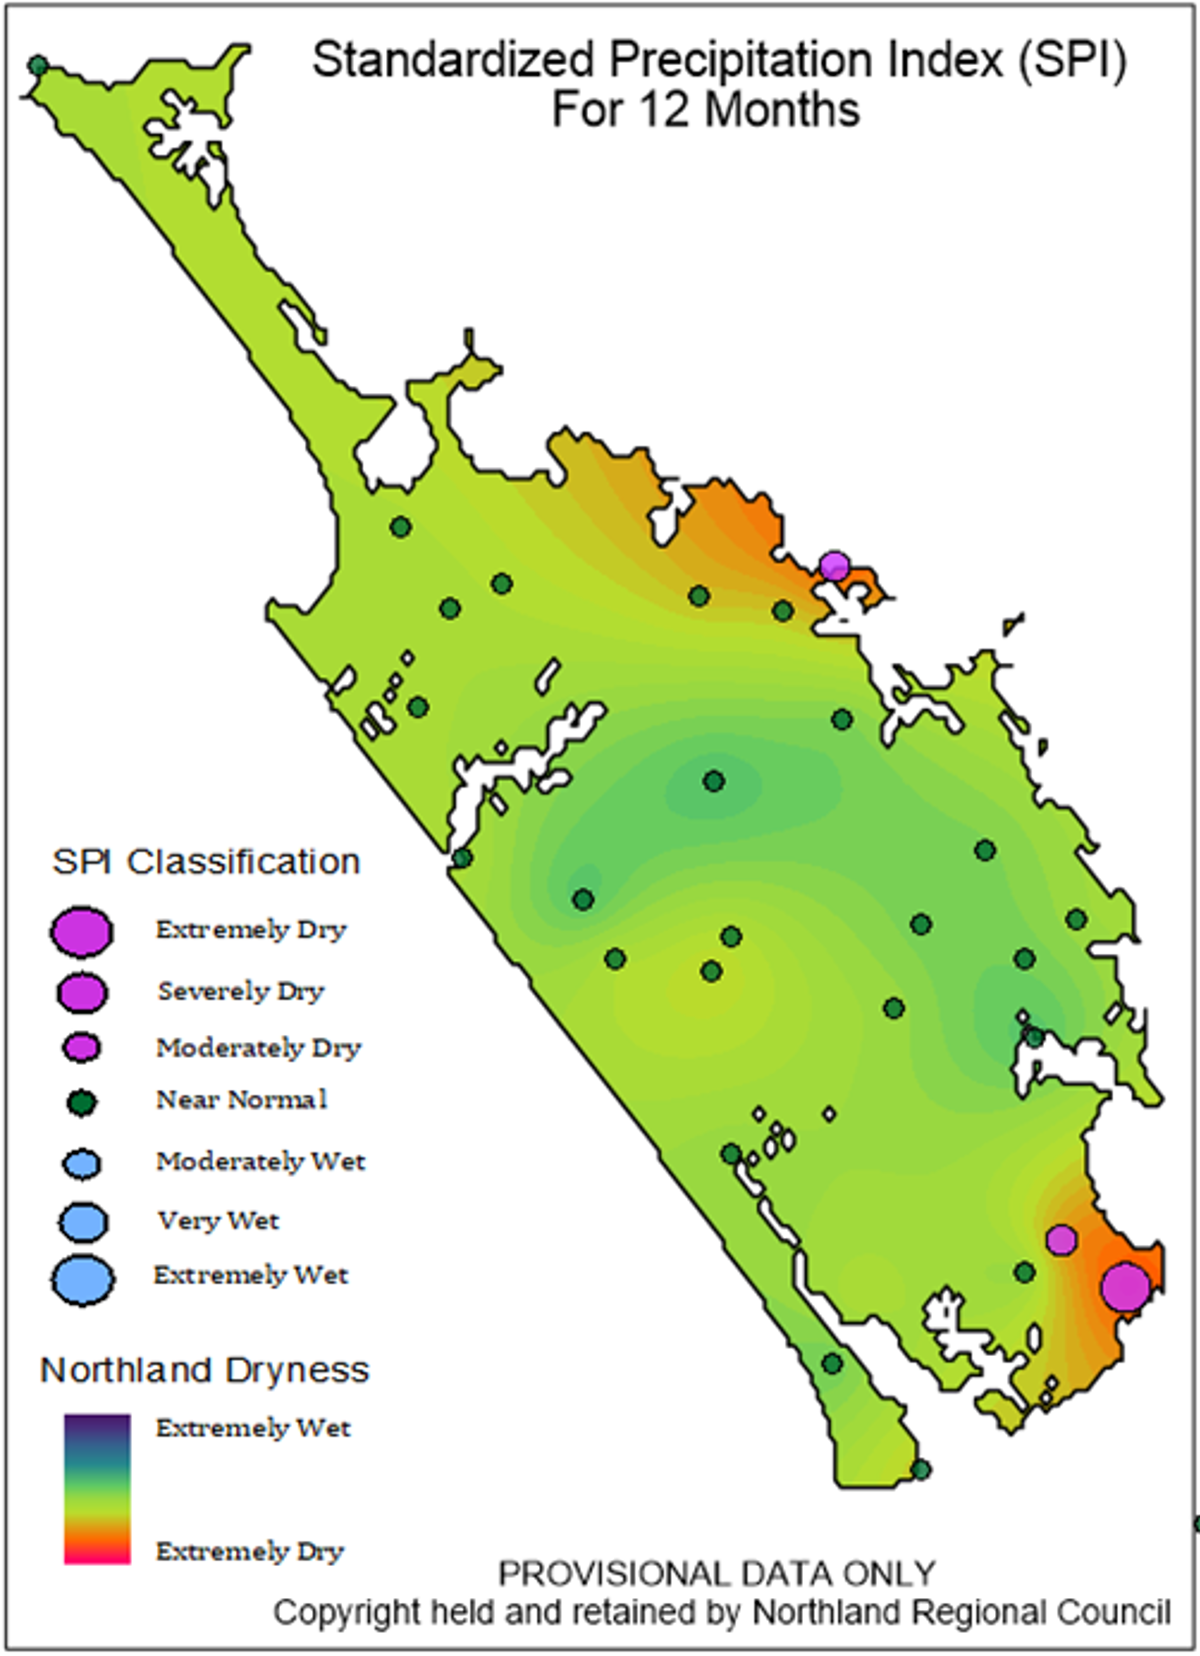
NRC Standardised Precipitation Index is an indicator used to compare rainfall received over extended periods compared to typical rainfall over those periods. This index indicates that over a 6-month period, rainfall across the region has been “Moderately Dry” to “Severely Dry” in eastern areas. Over a 12-month time frame, rainfall has been “Near Normal” in most areas with the exception of the Hakaru catchment (near Mangawhai) which is classified as “Severely Dry” over this period.
Rainfall % median maps for May 2021 and for the three months of Autumn 2021


SPI Index map for 6 and 12 months to the end of May 2021


Rainfall deficit values (mm)
| Site | End Date | 1 Month | 3 Months | 6 Months | 12 Months |
| Kaitaia Aero Ews | May 2021 | -55.67 | -121.87 | -131.50 | -57.40 |
| Kerikeri Ews | May 2021 | -65.59 | -75.91 | -137.40 | -81.95 |
| Kaikohe Aws | May 2021 | -63.10 | -121.88 | -133.41 | 237.28 |
| Whangarei Aero Aws | May 2021 | -38.29 | -50.36 | -100.78 | 231.24 |
| Hokianga Harbour at Omapere/Opononi | May 2021 | -28.53 | -11.84 | -41.50 | -25.54 |
| Dargaville 2 Ews | May 2021 | -33.34 | -23.92 | -73.03 | -42.86 |
| Awaroa at Wallace Road | May 2021 | -42.99 | -4.24 | -44.24 |
-7.2 |
River flow
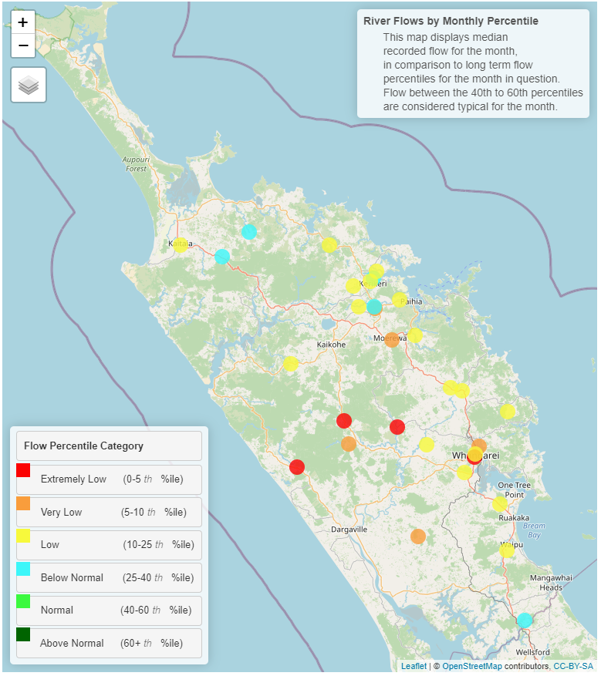
River flows during May 2021 were below normal across most of the region, and particularly low in the northern sub-catchments of the Wairoa River with flow in the categories “Very Low” and “Extremely Low” here (5-10th and 0-5th percentiles respectively).
Flow map May 2021
Groundwater
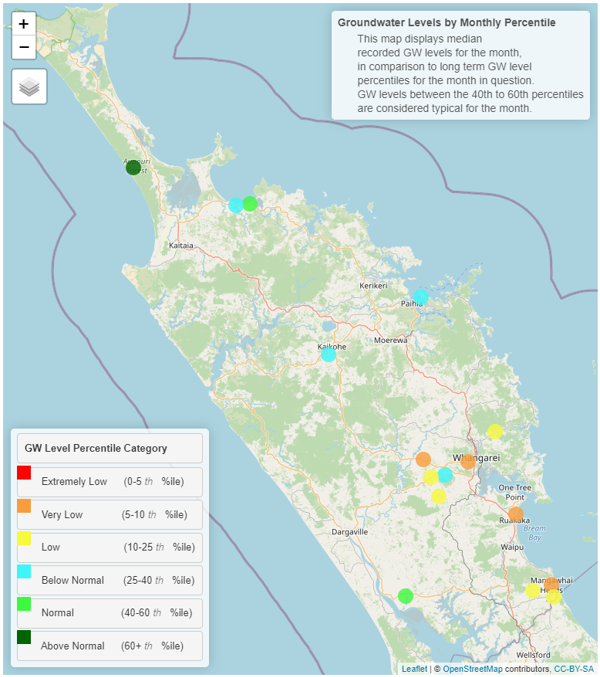
During May 2021 Groundwater levels were “Normal” or “Above Normal” in the Aupouri, and Ruawai groundwater systems, “Below Normal” in Taipa, Russell, Kaikohe and “Very Low” in Whangarei, Poroti and Mangawhai.
Northland aquifer status table
|
Groundwater System |
Status (May 21) |
Percentile |
|
Aupouri |
Above Normal |
>60th |
|
Taipa |
Below Normal |
25th-40th |
|
Russell |
Below Normal |
25th-40th |
|
Kaikohe |
Below Normal |
25th-40th |
|
Whangarei |
Very Low |
5-10th |
|
Poroti |
Very Low |
5-10th |
|
Mangawhai |
Very Low |
5-10th |
|
Rauwai |
Normal |
40-60th |
Northland aquifer status map May 2021
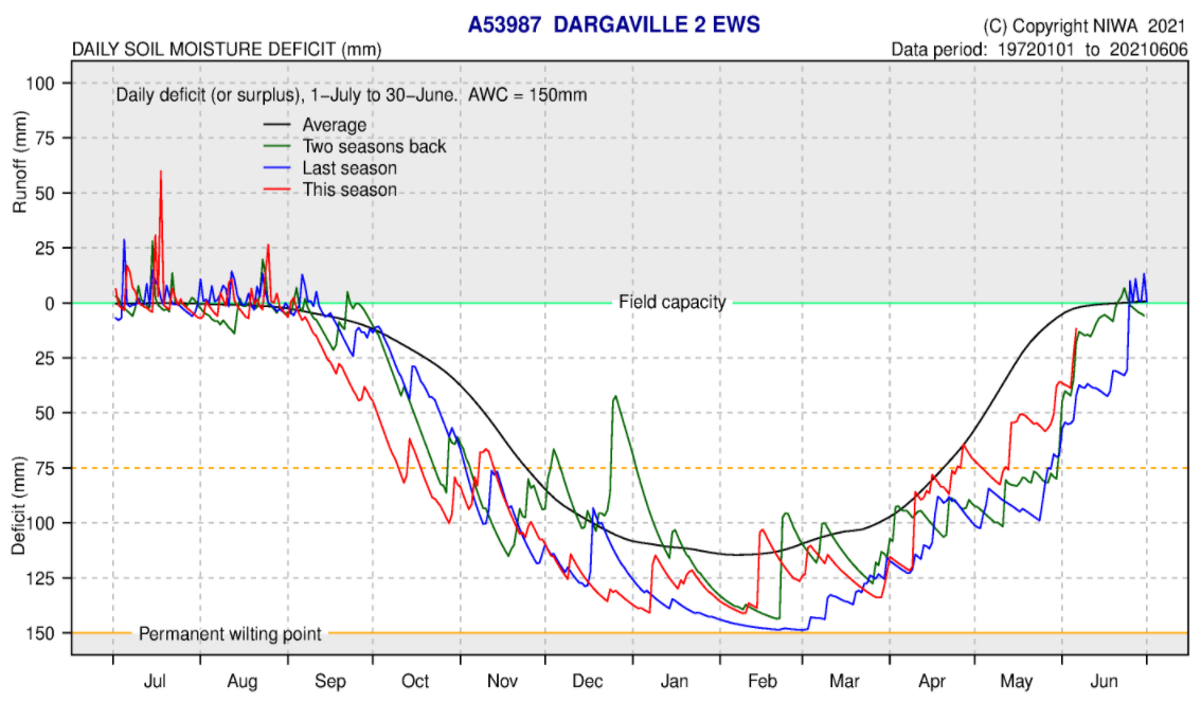
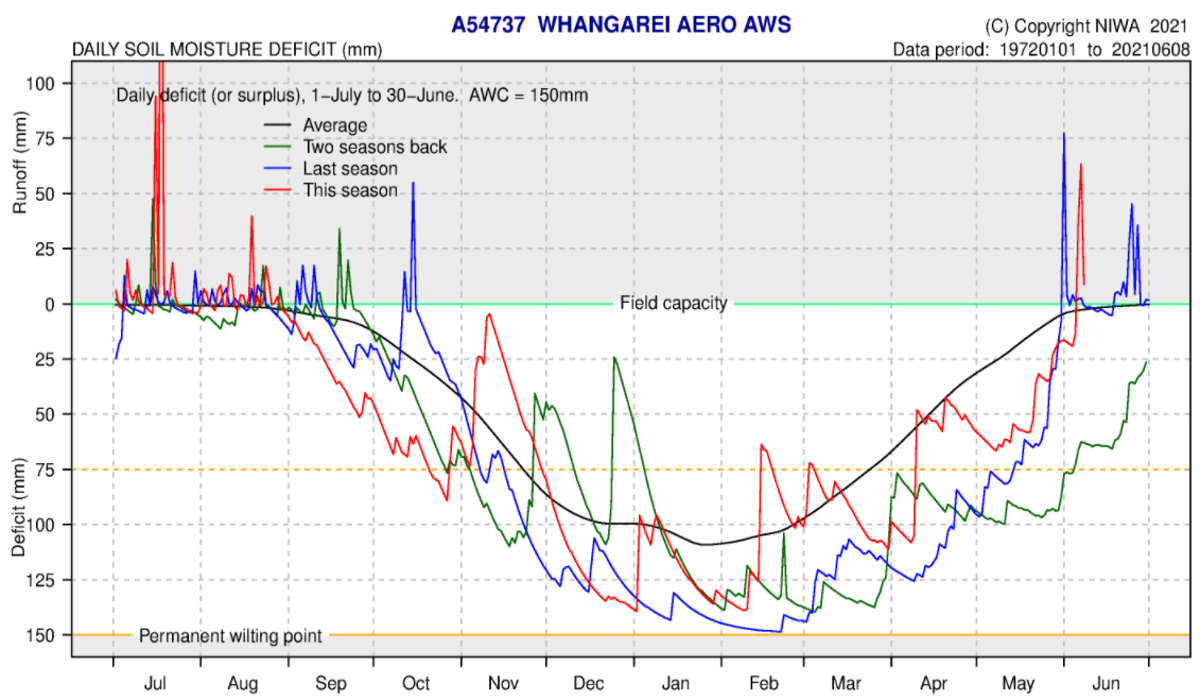
Soil moisture deficits
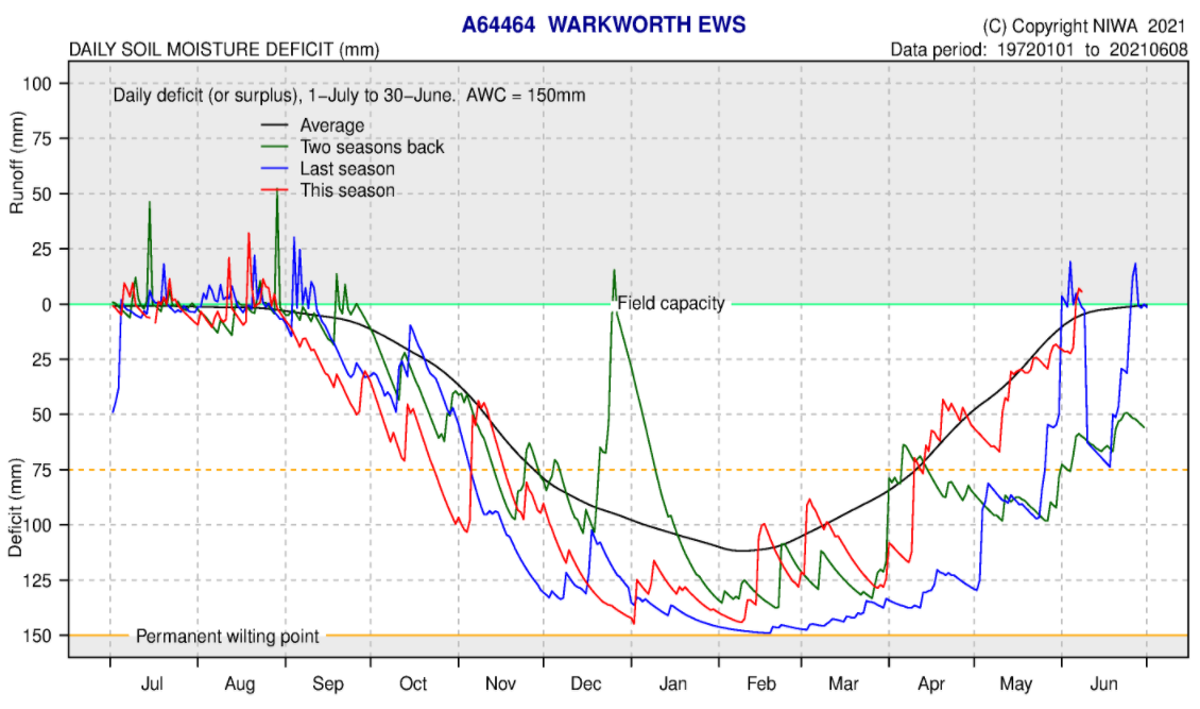
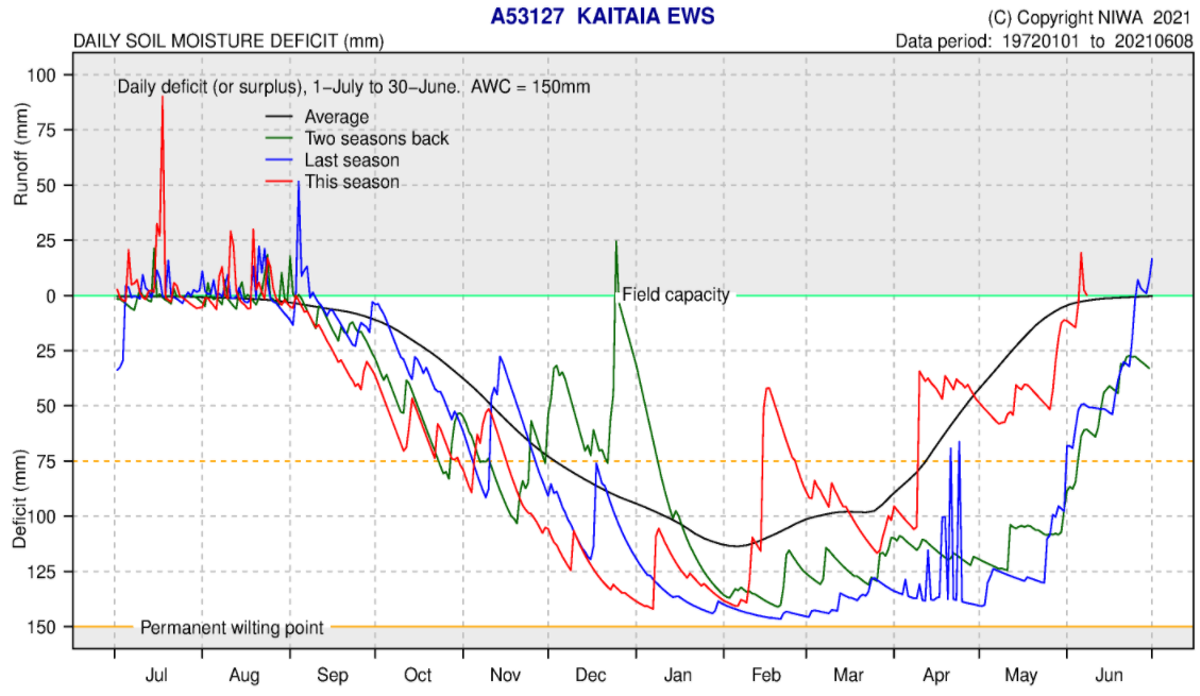
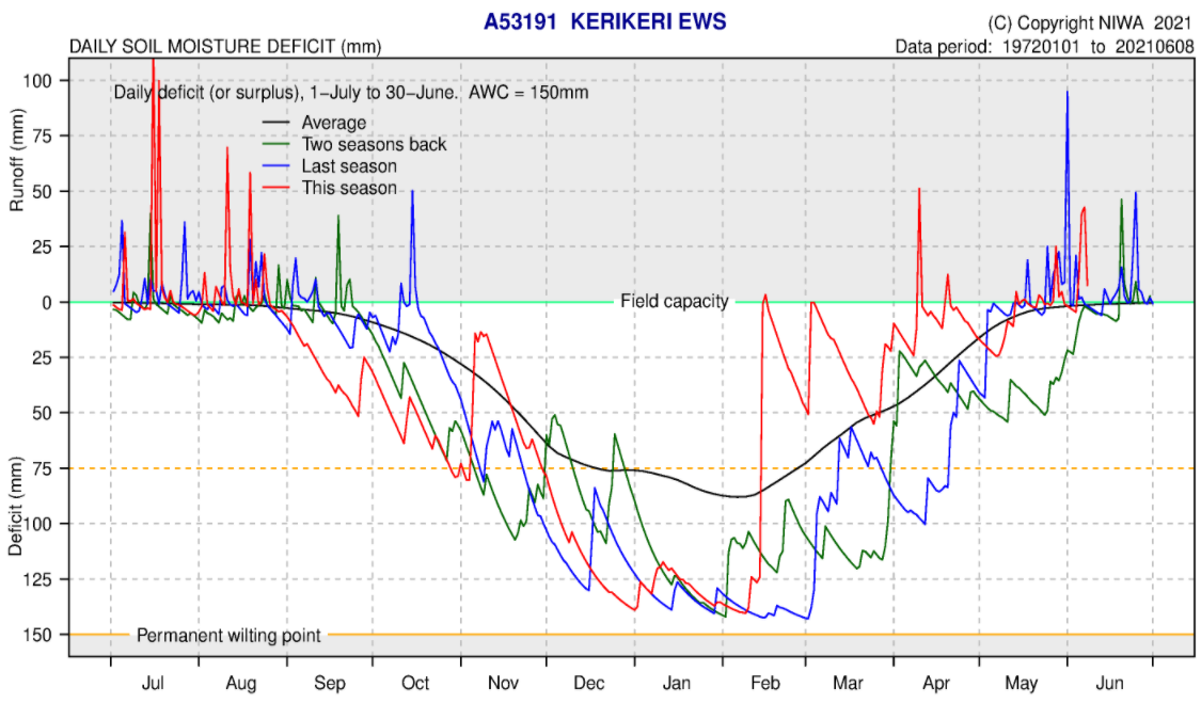
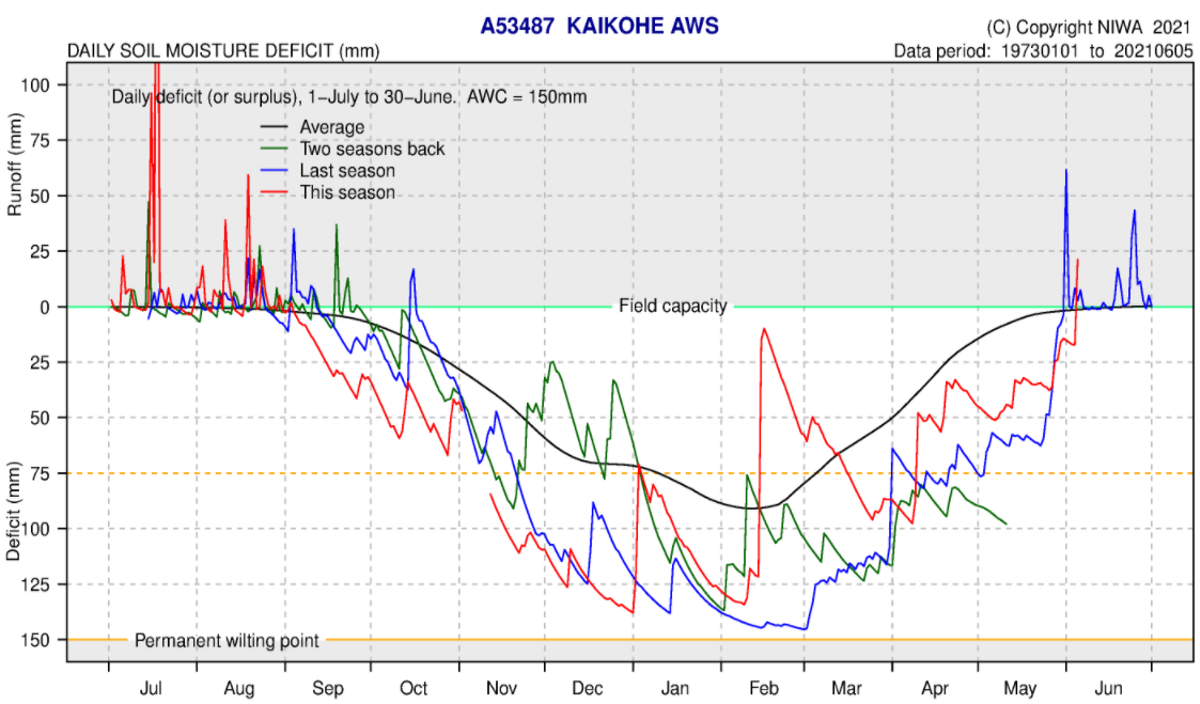
NIWA water balance modelling indicates soil moisture deficit is near normal at all NIWA climate stations, and close to or at field capacity. “SMD is calculated based on incoming daily rainfall (mm), outgoing daily potential evapotranspiration (PET, mm), and a fixed available water capacity (the amount of water in the soil 'reservoir' that plants can use) of 150 mm” (NIWA).
Soil moisture deficit at NIWA climate stations
|
NIWA Climate Station |
Observed Soil moisture deficit (mm) as of 08/06/2021 |
Average 8 Jun soil moisture deficit |
Difference between Expected and Average |
|
Kaitaia |
0 mm |
0 mm |
0 |
|
Kerikeri |
10 mm |
0 mm |
10 |
|
Whangarei |
10 mm |
0 mm |
10 |
|
Kaikohe |
20 mm |
0 mm |
20 |
|
Dargaville |
-10mm |
0 mm |
-10 |
|
Warkworth |
0 mm |
-10 mm |
10 |
|
|
|
|
NIWA soil moisture deficit plots