June 2021 climate report
14 Jul 2021, 9:27 AM
Summary
- June 2021 was a wet month for the east of the region and dry for the west.
- Rainfall over longer timeframes (the previous 6 months) can be categorised as “Near Normal” to “Moderately Dry” across the region.
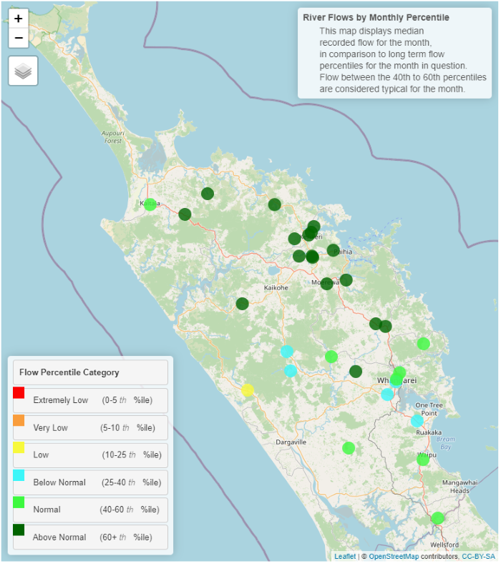
- River flows were generally normal or above normal for June, but still a below normal in the northern sub-catchments of the Wairoa River.
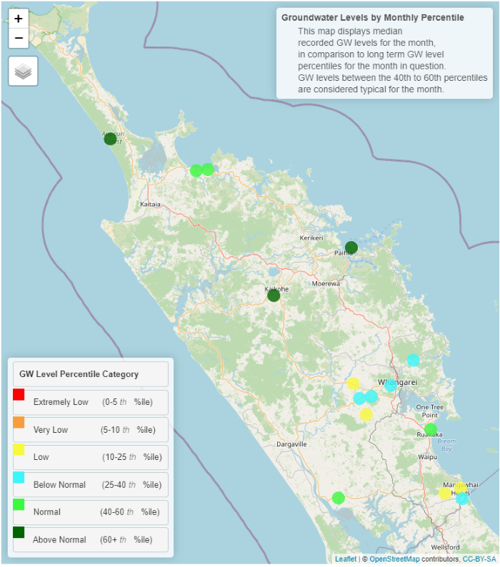
- Groundwater levels for the month were normal or above normal in the northern half of the region, Ruawai and Ruakaka. Poroti and Mangawhai remain “Low” but have improved from their “Very Low” status last month.
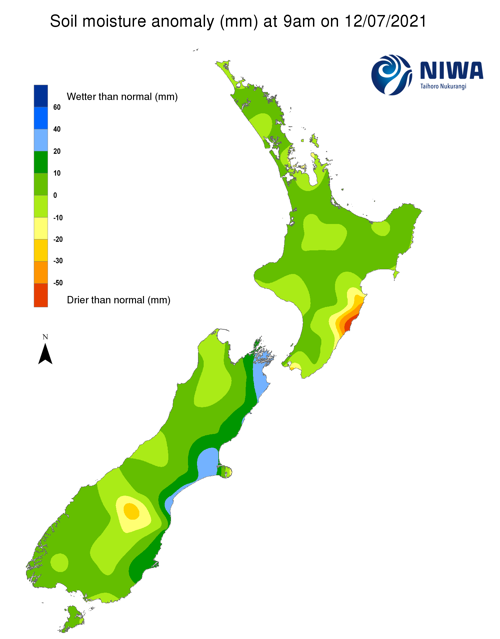
- Soil moisture is near average for this time of year at all NIWA climate stations.
- The NIWA three-month outlook is for near normal rainfall.
Outlook
July to September:
The long-range outlook for July to September 2021 is for near normal rainfall, soil moisture and river flows for Northland. Temperature is still likely to be above normal during this period.
NIWA Temperature, Rainfall, Soil Moisture and River Flows probabilities for July to September 2021
| Temperature | Rainfall | Soil moisture | River flows | |
| Above average | 50• | 35 | 30 | 25 |
| Near average | 45 | 40• | 40• | 45• |
| Below average | 05 | 25 | 30 | 30 |
Rainfall
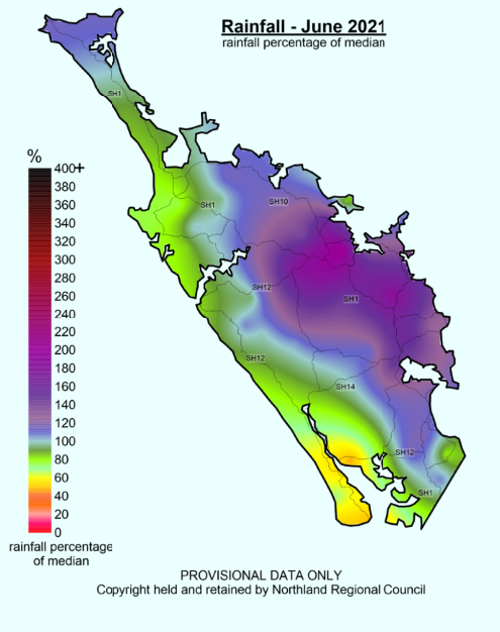
June 2021 was a wet month across eastern areas of the region (~100-200% of typical), slightly dry across most of the western catchments (~60-90% of typical) and quite dry at Ruawai and Poutō Peninsula (~50% of typical). One Severe Weather Warning was issued by MetService for the 6/06/2021 to 7/06/2021. No notable flooding occurred during this event, although it delivered around half of the rainfall received for the month in the Bay of Islands and Eastern Hills north of Whangārei.
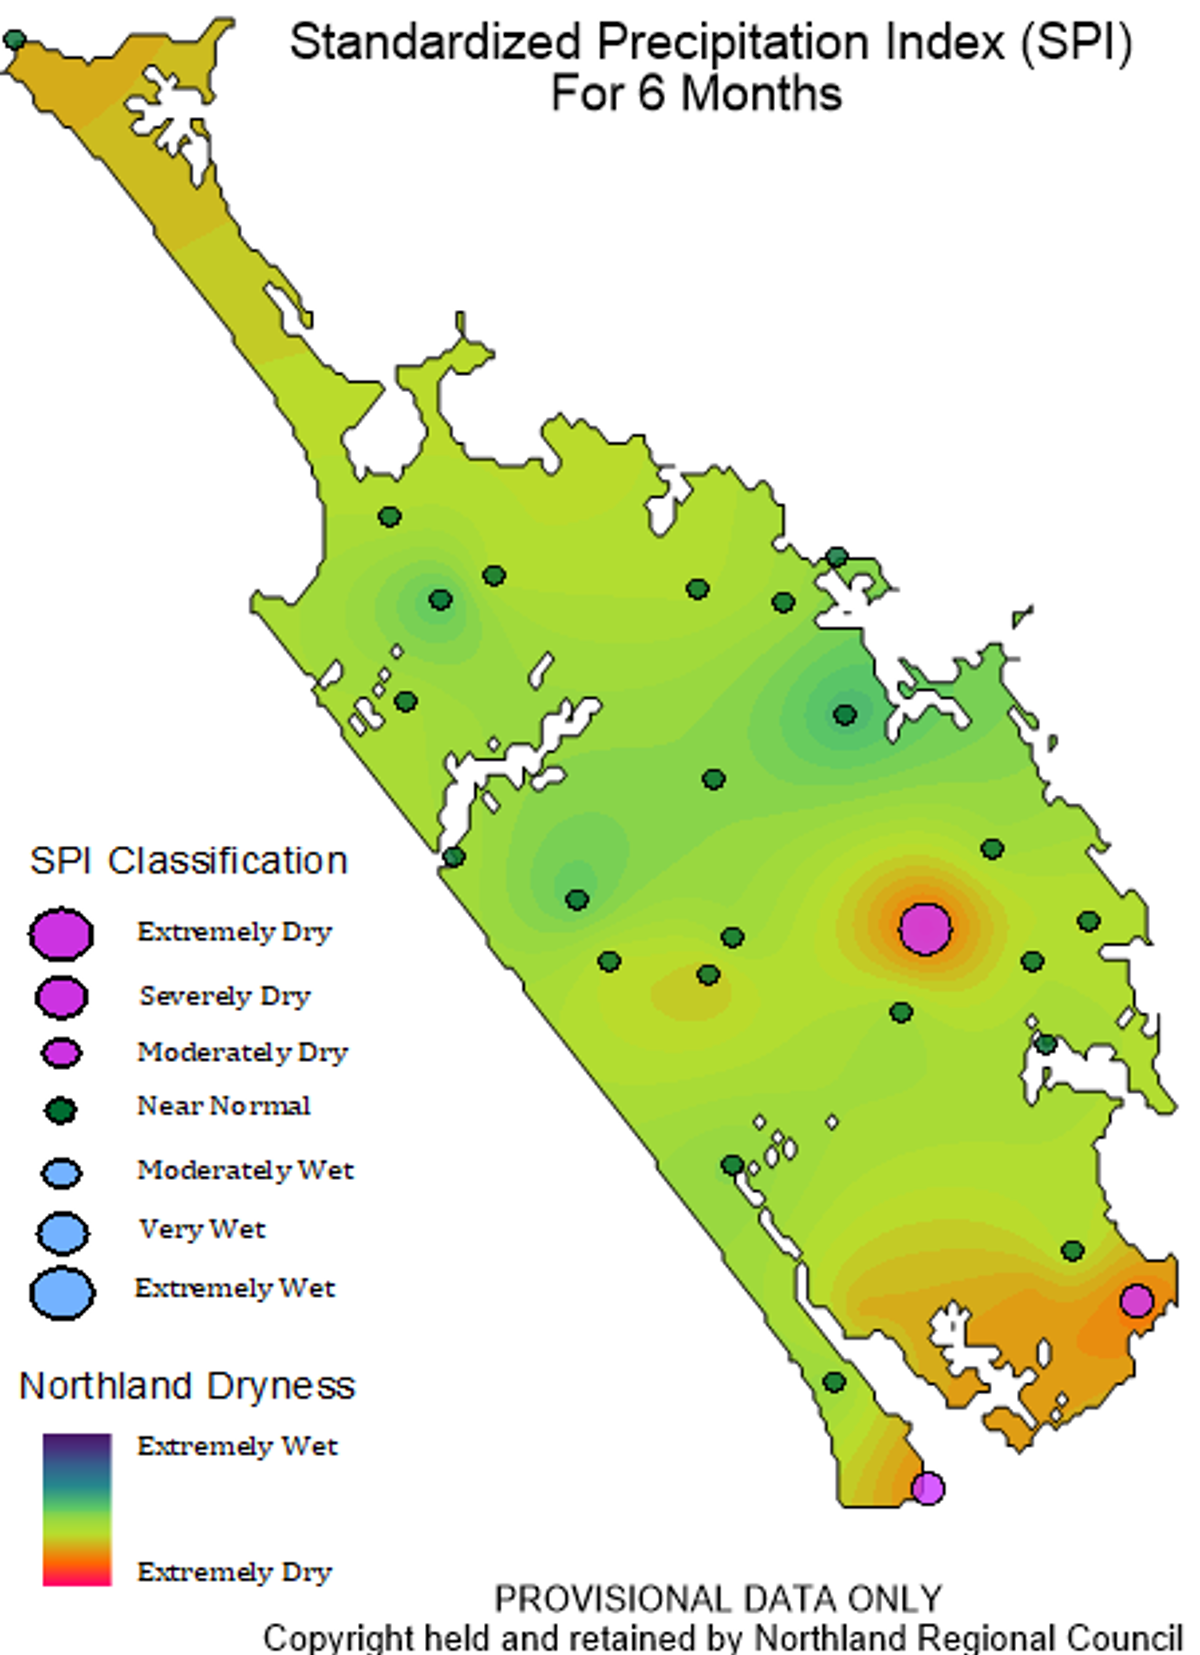
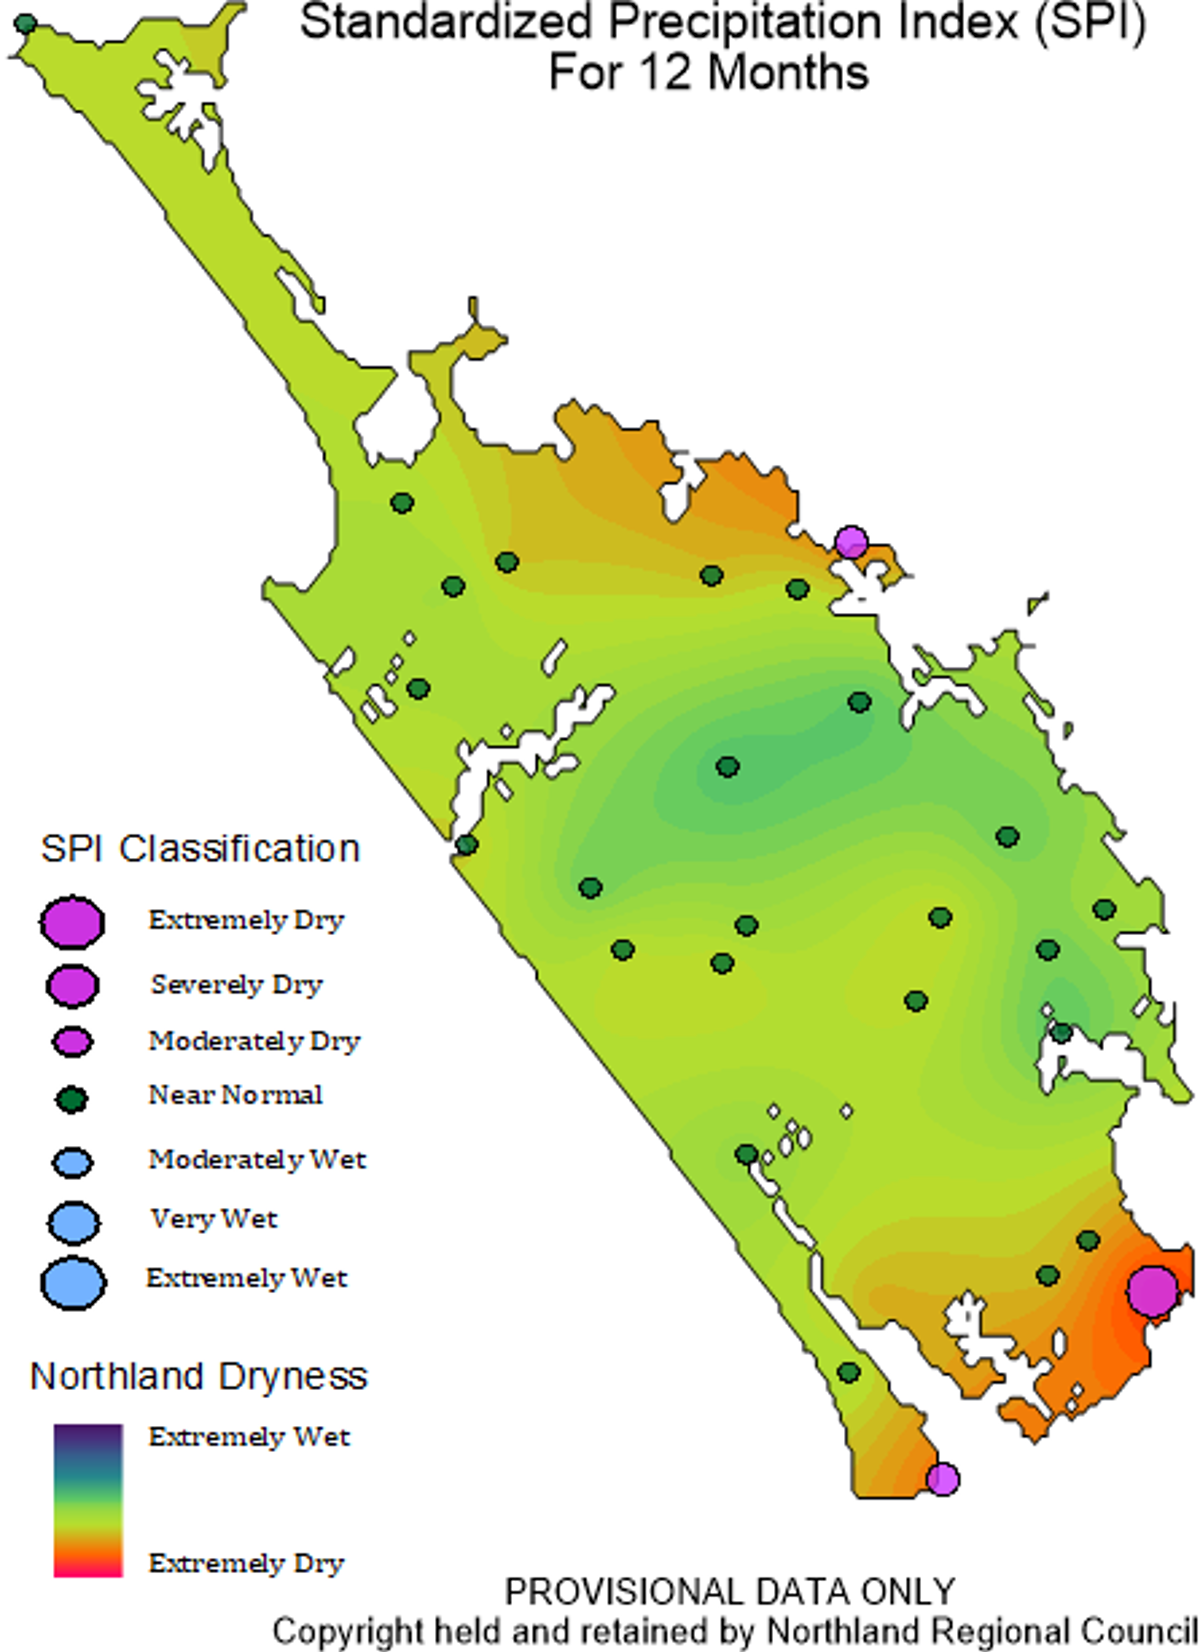
NRC Standardised Precipitation Index is an indicator used to compare rainfall received over extended periods compared to typical rainfall over those periods. This index indicates that over a 6-month period, rainfall across the region has been “Near Normal” or “Moderately Dry” in most locations, and “Severely Dry” in one location near Hikurangi. Similarly, over a 12-month time frame, rainfall has been “Near Normal” or “Moderately Dry” in most areas with the exception of the Hakaru catchment (near Mangawhai) which is classified as “Severely Dry” over this period.
Rainfall % median map for June 2021
SPI Index map for 6 and 12 months to the end of June 2021
Rainfall deficit values (mm)
| Site | End date | 1 Month | 3 Months | 6 Months | 12 Months |
| Kaitaia Aero Ews | June 2021 | 7.67 | -83.60 | -61.80 | -65.20 |
| Kerikeri Ews | June 2021 | 50.15 | -23.56 | 10.64 | -42.50 |
| Kaikohe Aws | June 2021 | 61.39 | -30.89 | 11.98 | 225.14 |
| Whangārei Aero Aws | June 2021 | 52.61 | 38.14 | 21.96 | 216.05 |
| Hokianga Harbour at Omapere/Opononi | June 2021 | -19.02 | -34.05 | -3.77 | -90.80 |
| Dargaville 2 Ews | June 2021 | -2.78 | -15.87 | -42.36 | -50.24 |
| Awaroa at Wallace Road | June 2021 | -65.88 | -75.62 | -73.12 | -101.89 |
River flow
River flows during June 2021 were normal or above normal across most of the region, but remained “Low” or “Below Normal” in the western sub-catchments of the Wairoa River (Kaihu River, Mangakahia and Opouteke Rivers), and “Below Normal” in the Otaika and Ruakaka Rivers.
Flow map June 2021
Groundwater
During June 2021 Groundwater levels were “Normal” or “Above Normal” in the Aupouri, Taipa, Russell, Kaikohe and Ruawai groundwater systems, “Below Normal” in Whangārei, and “Low” in Poroti and Mangawhai (see below for percentiles).
Northland aquifer status table
| Groundwater systems | Status (June 2021) | Percentile |
| Aupouri | ABOVE NORMAL | >60th |
| Taipa | NORMAL | 40-60th |
| Russell | ABOVE NORMAL | >60th |
| Kaikohe | ABOVE NORMAL | >60th |
| Whangārei | BELOW NORMAL | 25-40th |
| Poroti | LOW | 10-25th |
| Mangawhai | LOW | 10-25th |
| Ruawai | NORMAL | 40-60th |
Northland aquifer status map June 2021
Soil moisture deficits
NIWA water balance modelling indicates soil moisture deficit is near normal at all NIWA climate stations, and close to or at field capacity. “SMD is calculated based on incoming daily rainfall (mm), outgoing daily potential evapotranspiration (PET, mm), and a fixed available water capacity (the amount of water in the soil 'reservoir' that plants can use) of 150 mm” (NIWA).