December 2020 climate report
18 Jan 2021, 2:30 PM
Summary
- December 2020 was a very Dry month across the region, particularly the east
- The dry December follows a dry spring. These dry conditions have impacted river flows during December
- River flows during December decreased significantly from November, with many river flows categorised as “extremely low” for the month overall
- Groundwater levels in Taipa, Russell, Kaikohe, Poroti, Whangārei and Mangawhai are at around the 25th percentile, similar to this time last year
- Soil moisture increased with the rain early January 2021 but is on the decline again. Soil moisture deficit is below average at all NIWA climate stations except Kaikohe and Warkworth
- NIWA continue to predict near normal rainfall for the next three months, with a higher than normal chance subtropical airflows causing heavy rain events
- The near normal rainfall predicted is heavily reliant on these infrequent heavy rain events. Long dry spells are predicted to occur between these events, and if these heavy rain events fail to eventuate, then dry conditions will continue. The impact of these dry spells may be exacerbated by higher than normal temperatures.
Outlook
January to March:
The long-range forecast for January to March 2021 is for near normal rainfall for Northland. Moderate La Nina conditions will continue, which may still increase the likelihood of subtropical airflows and heavy rain events, but this may be interspersed with extended dry spells.
Temperatures are forecast to be much higher than normal over the next three months. Rainfall may be normal, but the water lost to evapotranspiration may be higher with hot temperatures, this could lead to dryer than expected conditions.
NIWA Temperature, Rainfall, Soil Moisture and River Flows probabilities for January to March 2021
| Temperature | Rainfall | Soil moisture | River flows | |
| Above average | 65• | 35 | 25 | 20 |
| Near average | 30 | 40• | 45• | 50• |
| Below average | 05 | 25 | 30 | 30 |
Rainfall
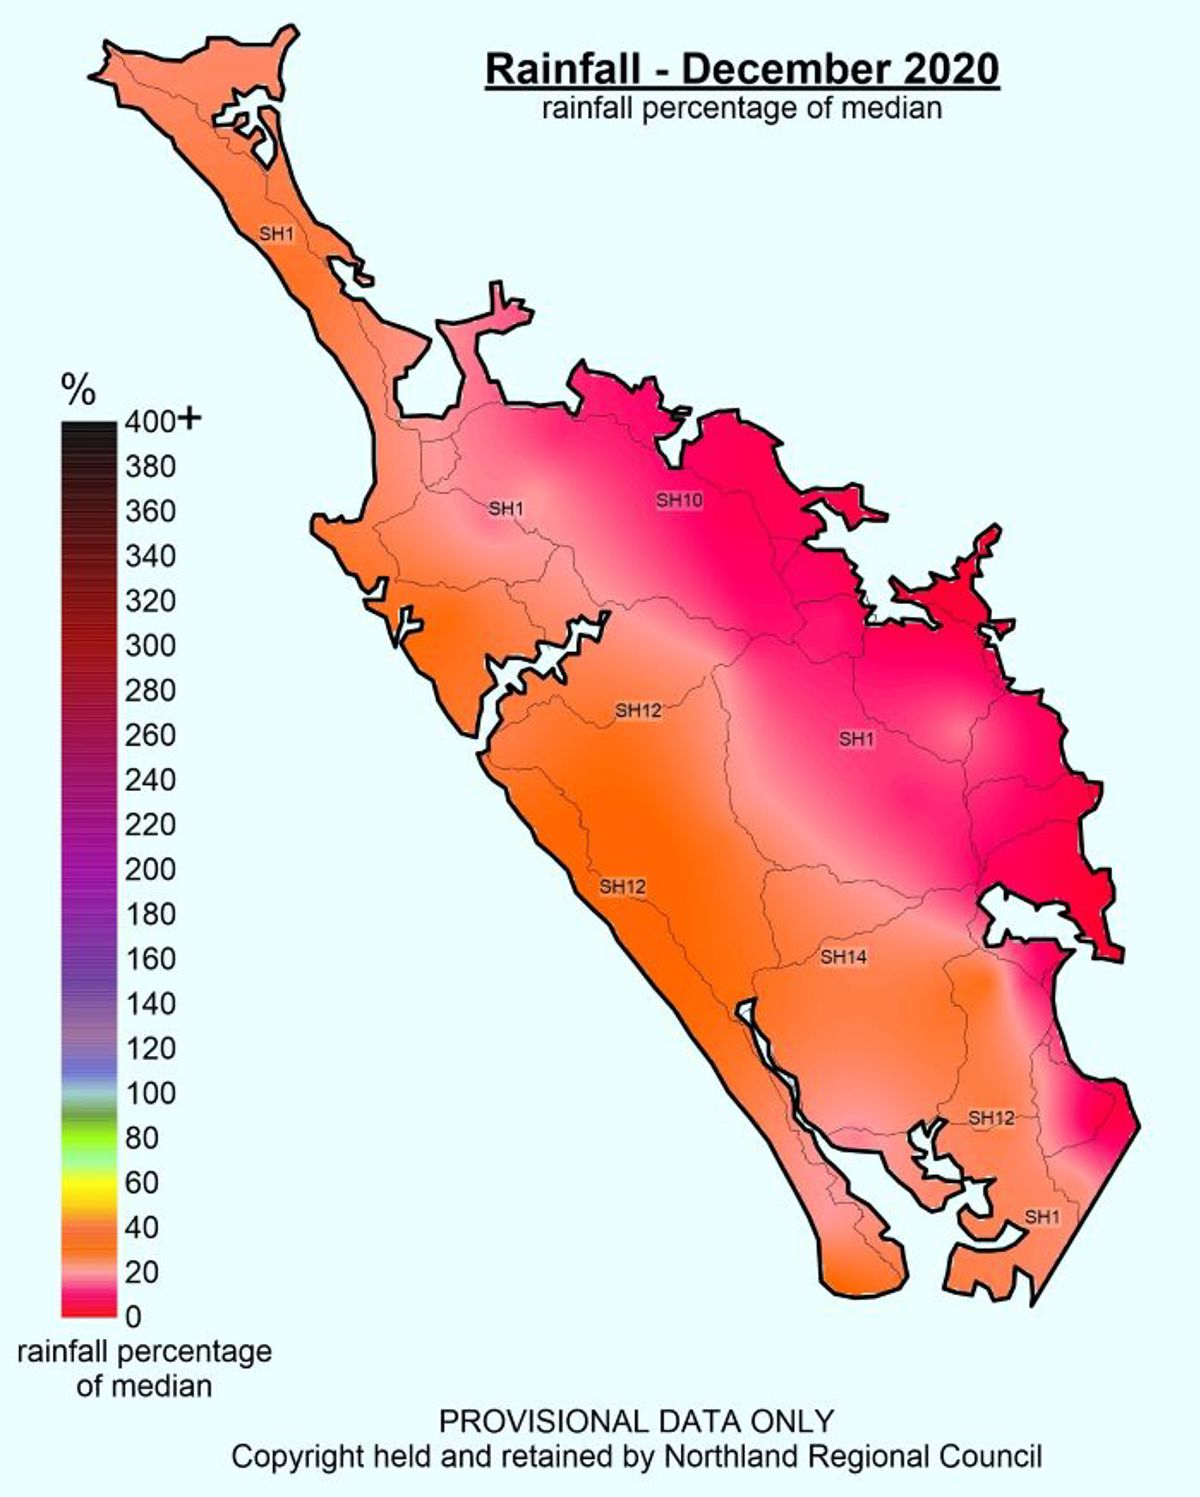
December 2020 was a very dry month for Northland. The region averaged 19.6 mm and there was a distinct variation from east to west. The most rain was recorded at Waimamaku (53.0 mm) and the least at Marsden Point (5.5 mm). Others to get less than 10mm were Purerua Peninsula, Kerikeri, Ōpua, Whangārei Airport and Hakaru at Tara in the south. Long-term records suggest Northland would typically get around 111 mm in December. This time around we received 18% of that. Ōpua only had 5% of the expected December rain and Kaeo, Kerikeri, Ōpua, Oakura, Ngunguru, Whangārei, Marsden Point and Tara all had less than 10%.
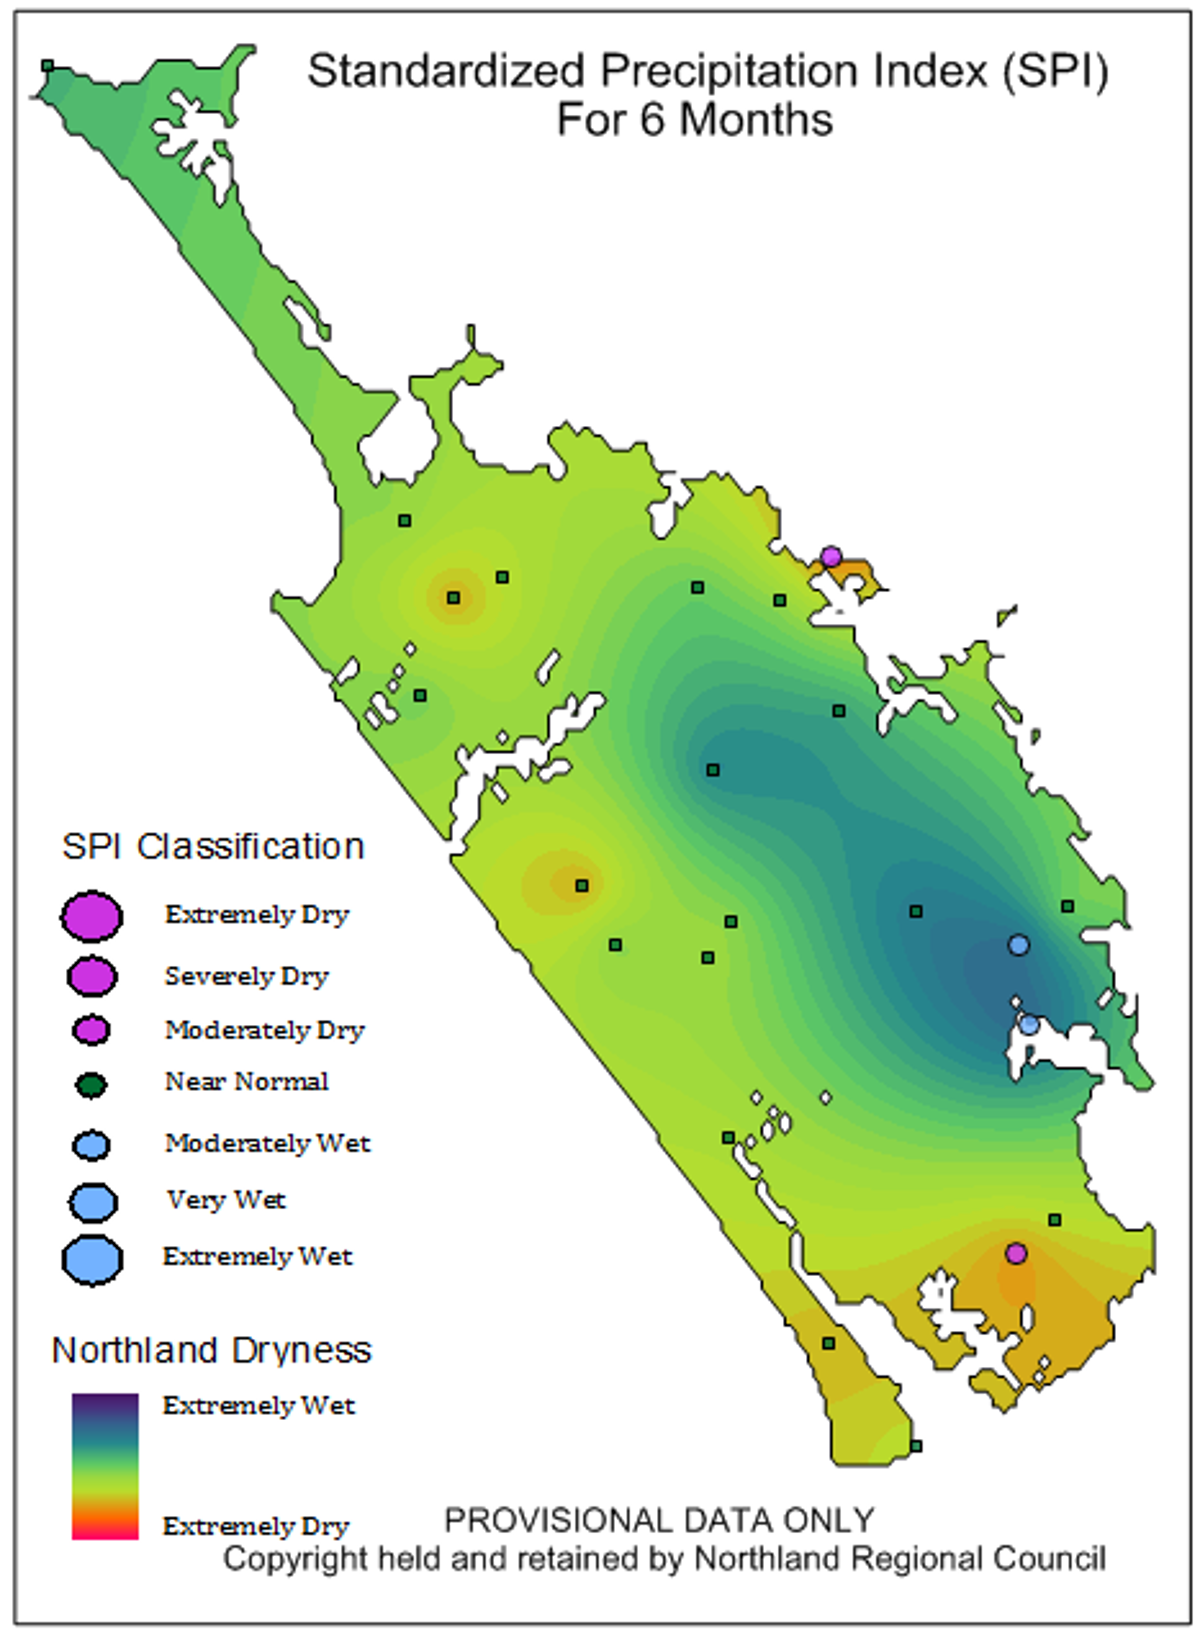
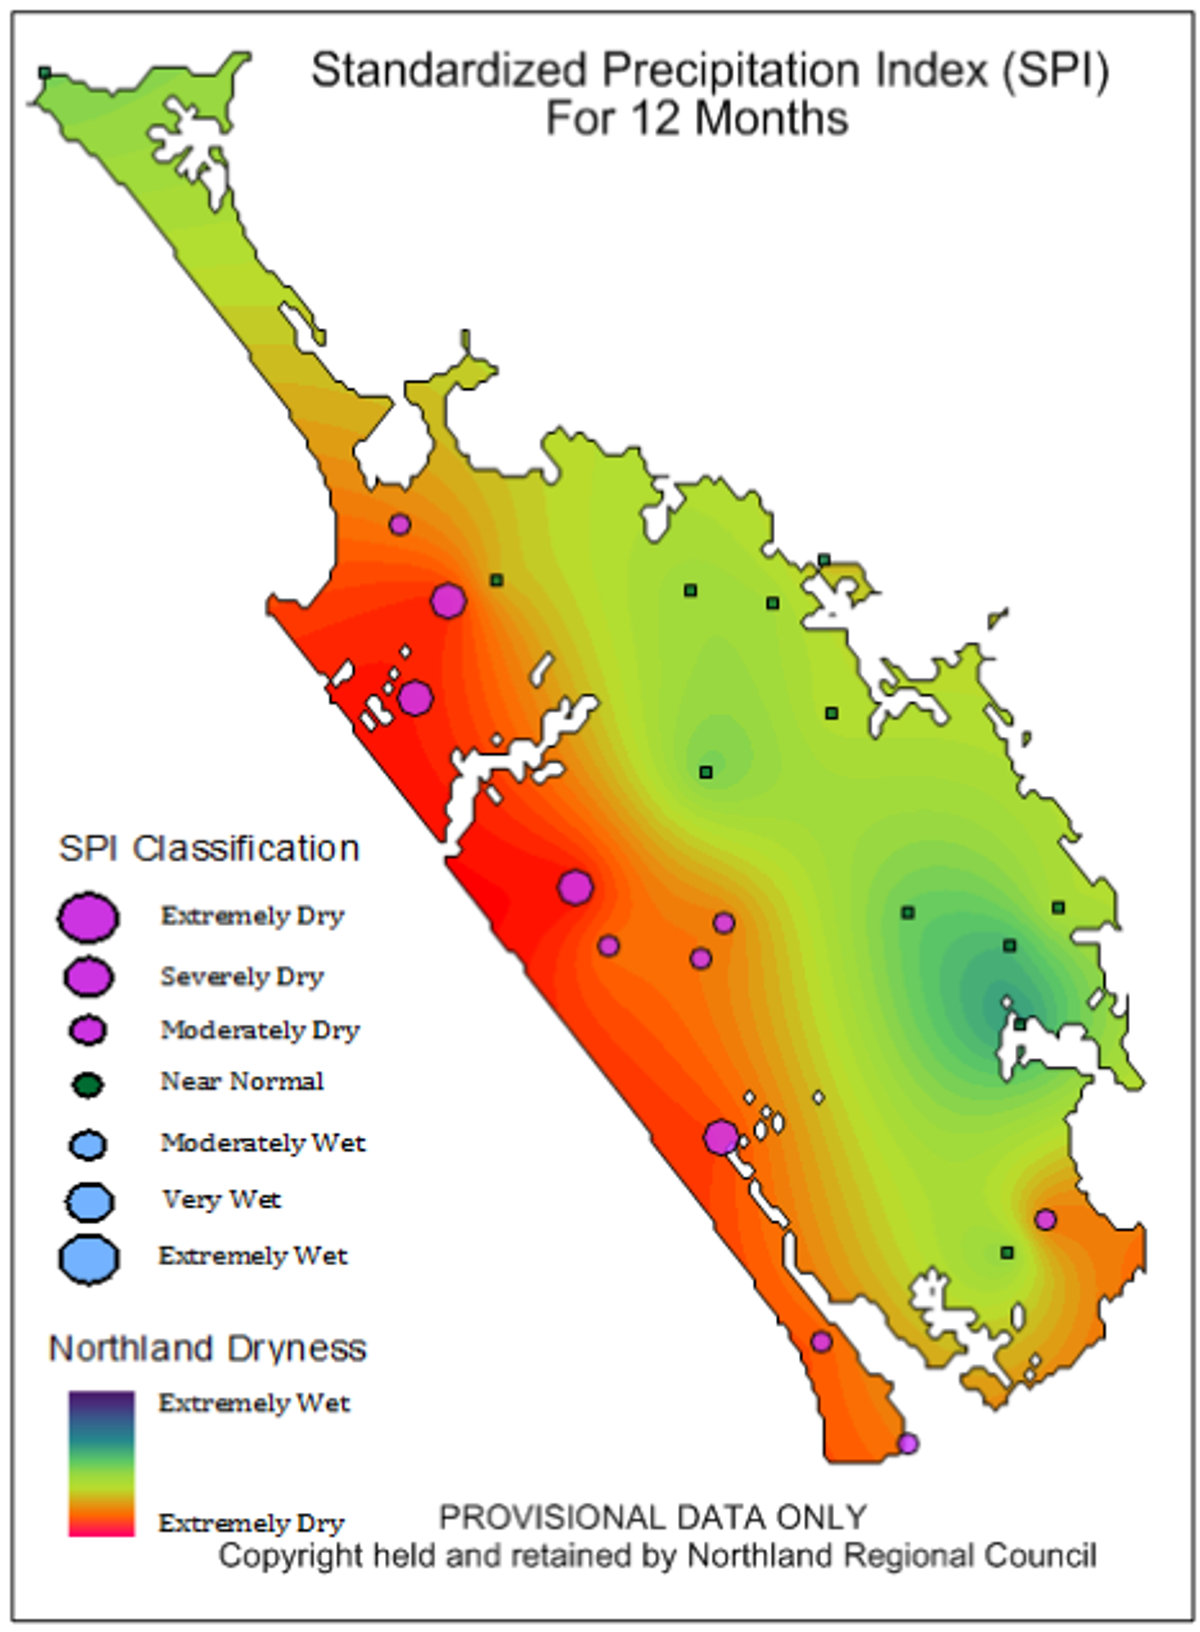
The NRC SPI drought index indicates that over the past 6 months the region has been in a “near normal” condition, owing largely to the high rainfall received during July 2020. However, over the last 12 months the west coast of the region is leaning towards “moderately dry” to “severely dry”.
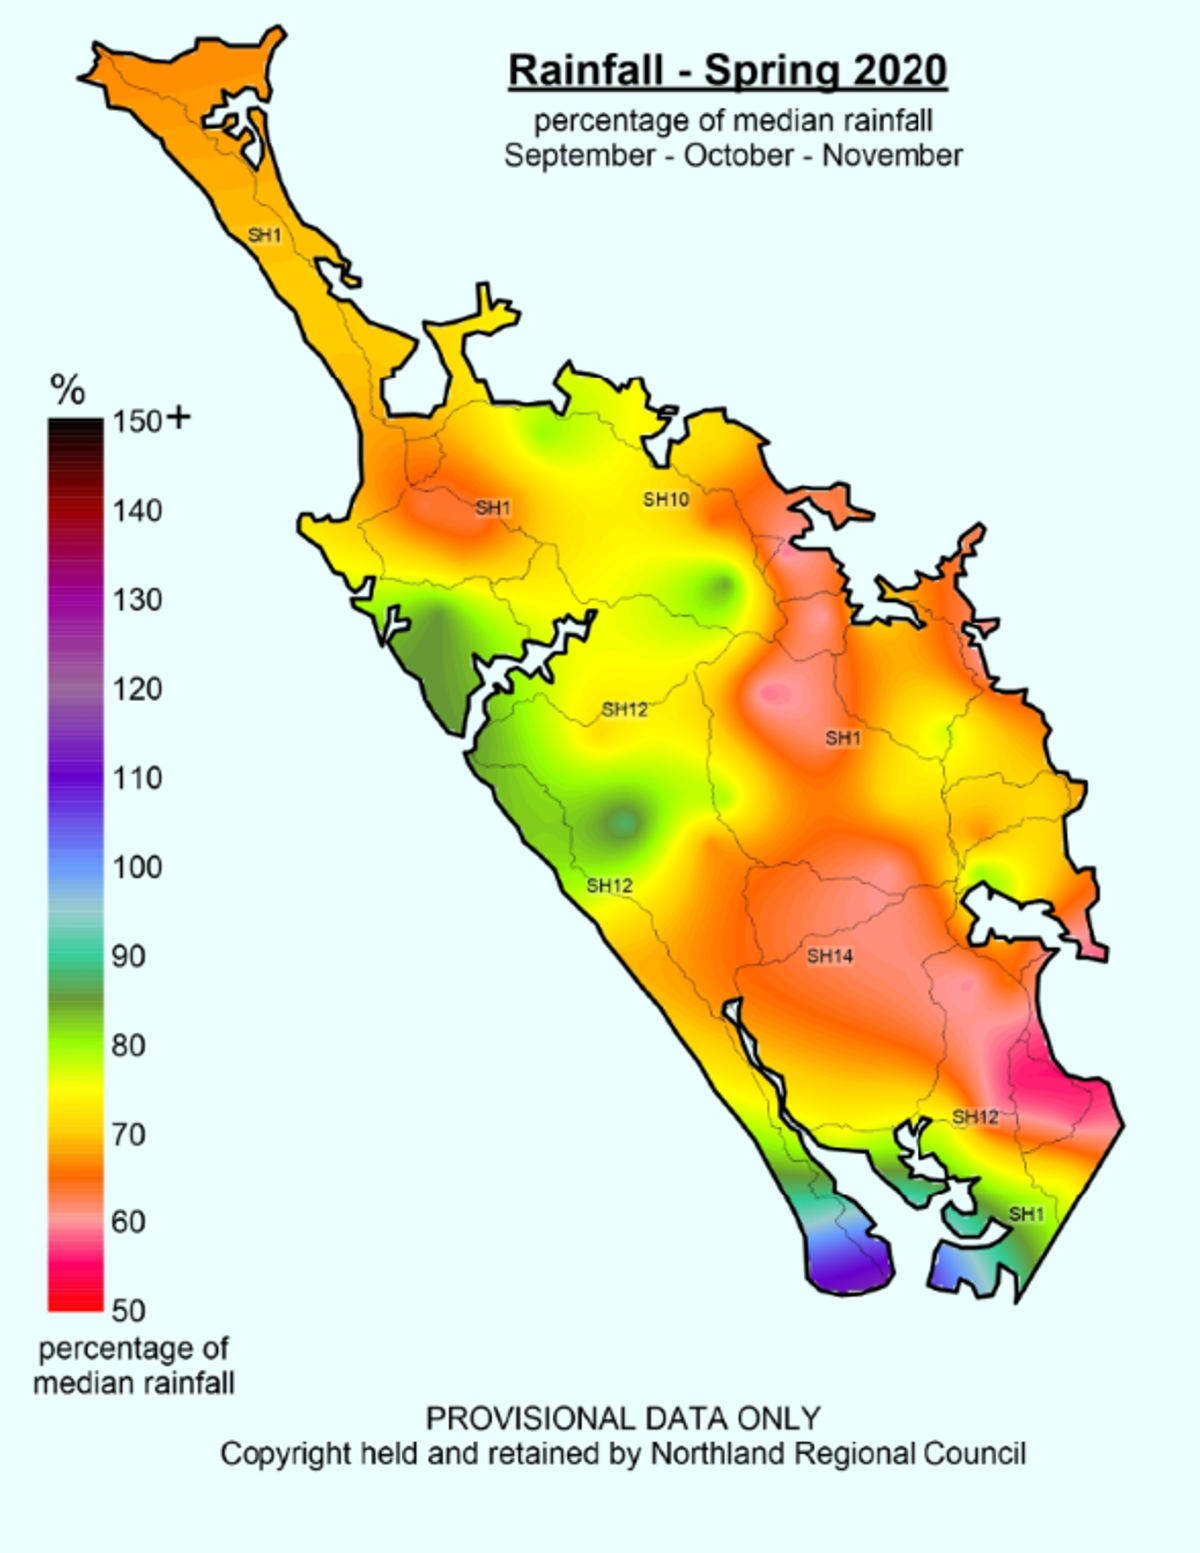
Rainfall % median maps for December and Spring 2020


SPI Index map for 6 and 12 months to the end of December 2020


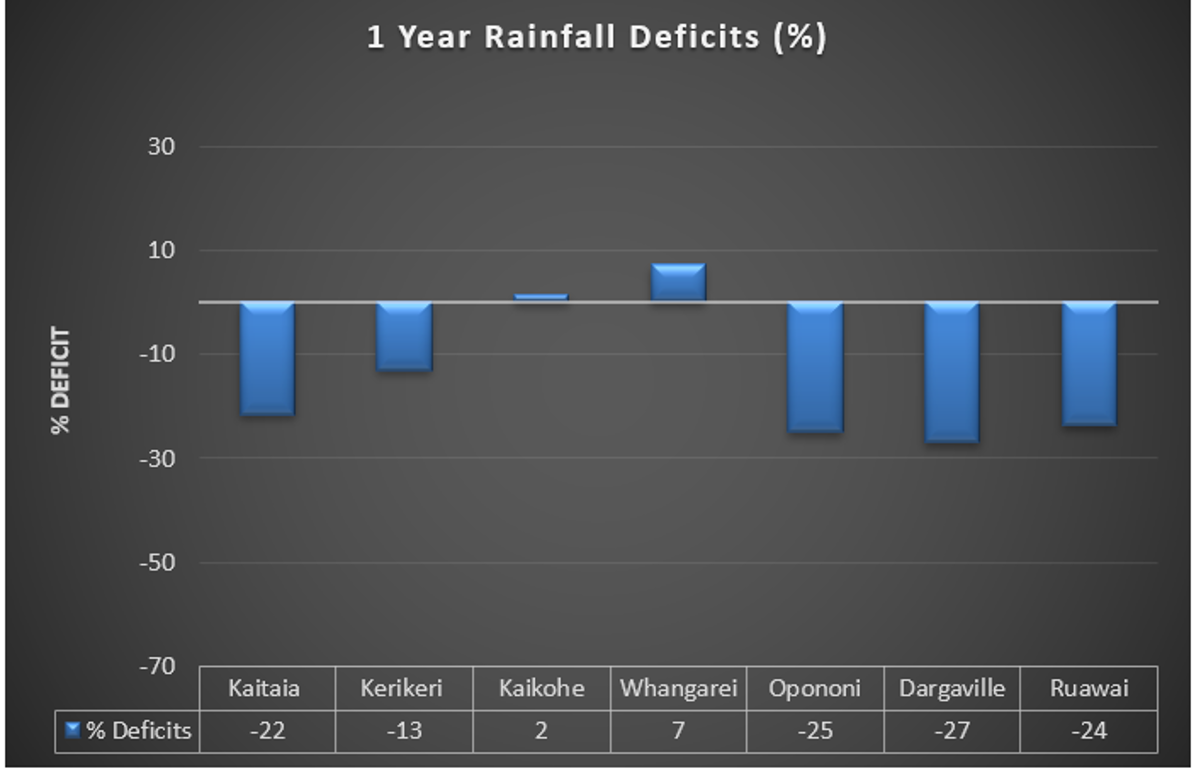
One year and six-month rainfall deficit percentage values


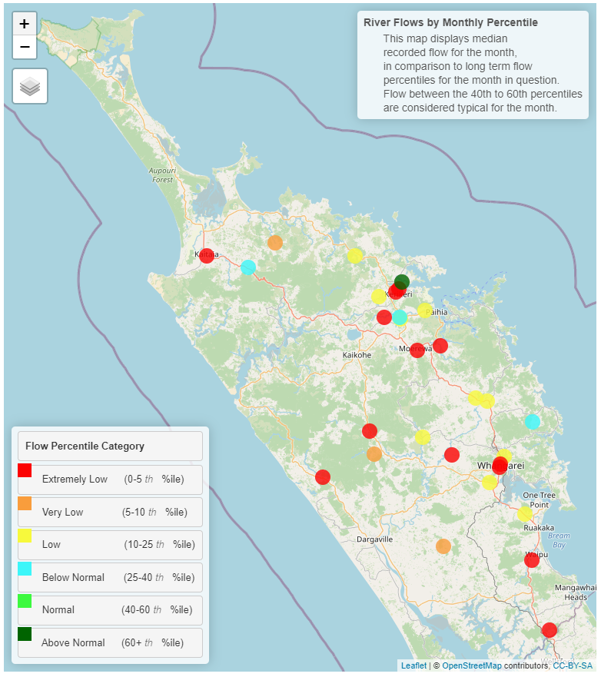
River flow
For December 2020, river flows were generally categorised as Low to Extremely Low. A dry spring and a very dry December lead to a sharp decline in river flows from the previous month.
Flow Map December 2020
Groundwater
During December 2020 Groundwater levels were below normal in the Taipa, Russell, Kaikohe, Poroti, Whangārei and Mangawhai groundwater systems at around the 25th percentile. Groundwater levels were near normal or slightly below normal in the Aupouri, Marsden-Ruakaka and Ruawai groundwater systems.
Northland aquifer status
| Groundwater systems | Status for December 2020 |
| Aupouri | OK |
| Taipa | BELOW NORMAL |
| Russell | BELOW NORMAL |
| Kaikohe | BELOW NORMAL |
| Poroti | BELOW NORMAL |
| Whangārei | BELOW NORMAL |
| Marsden-Ruakaka | SLIGHTLY BELOW NORMAL |
| Mangawhai | BELOW NORMAL |
| Ruawai | SLIGHTLY BELOW NORMAL |
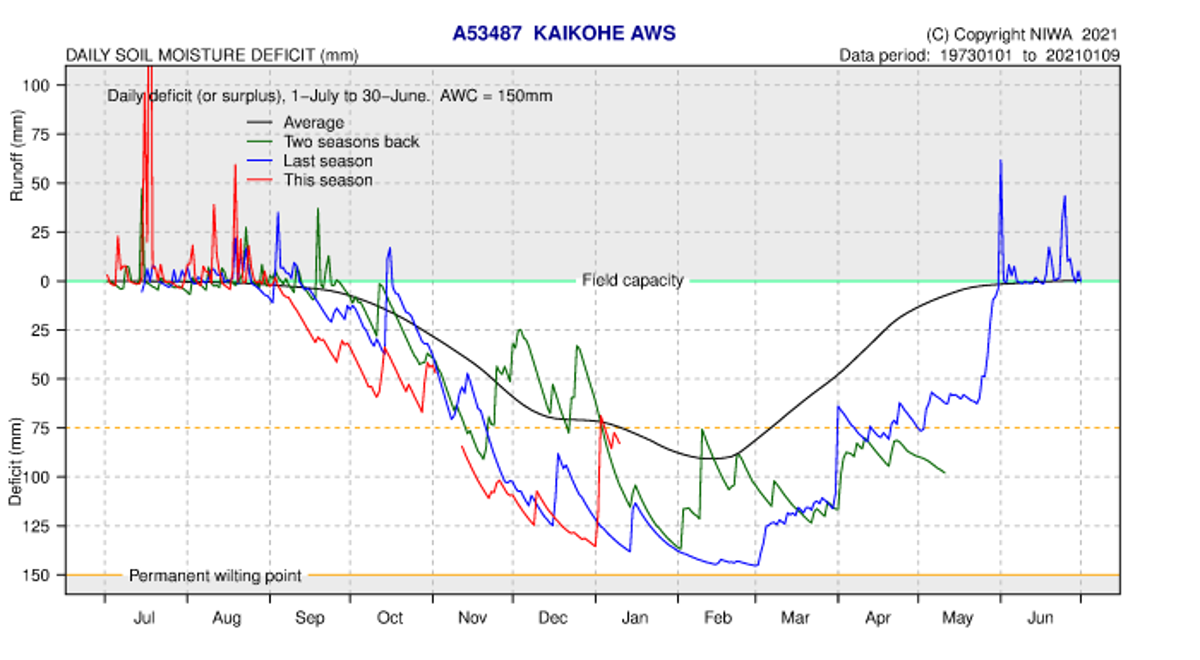
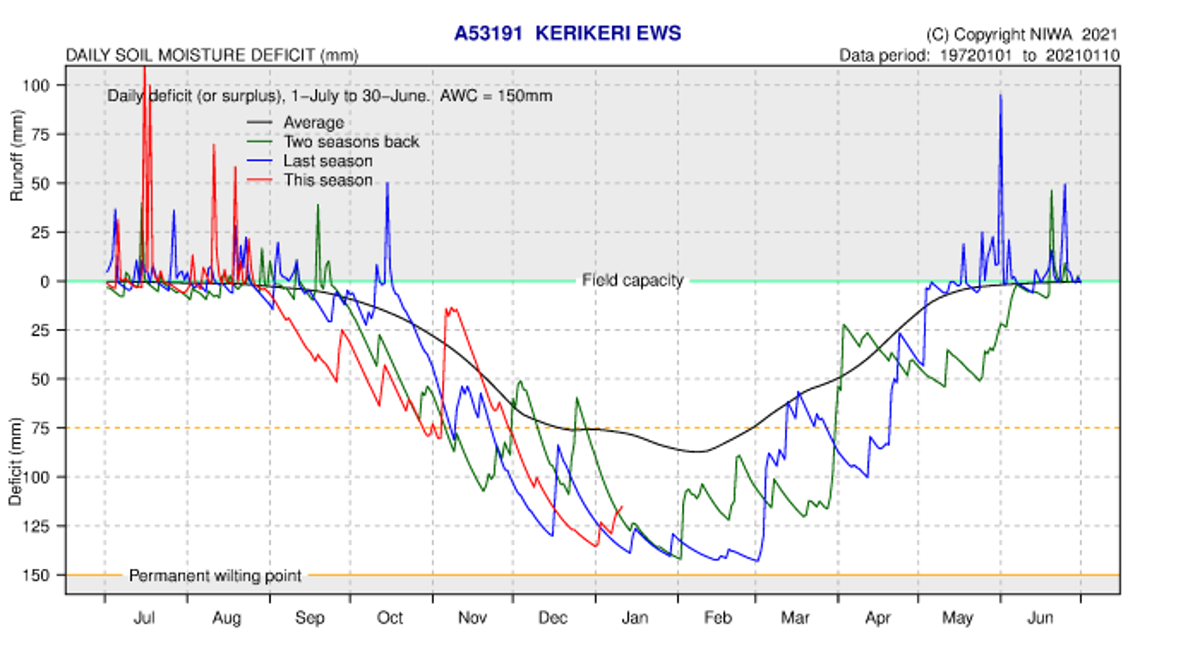
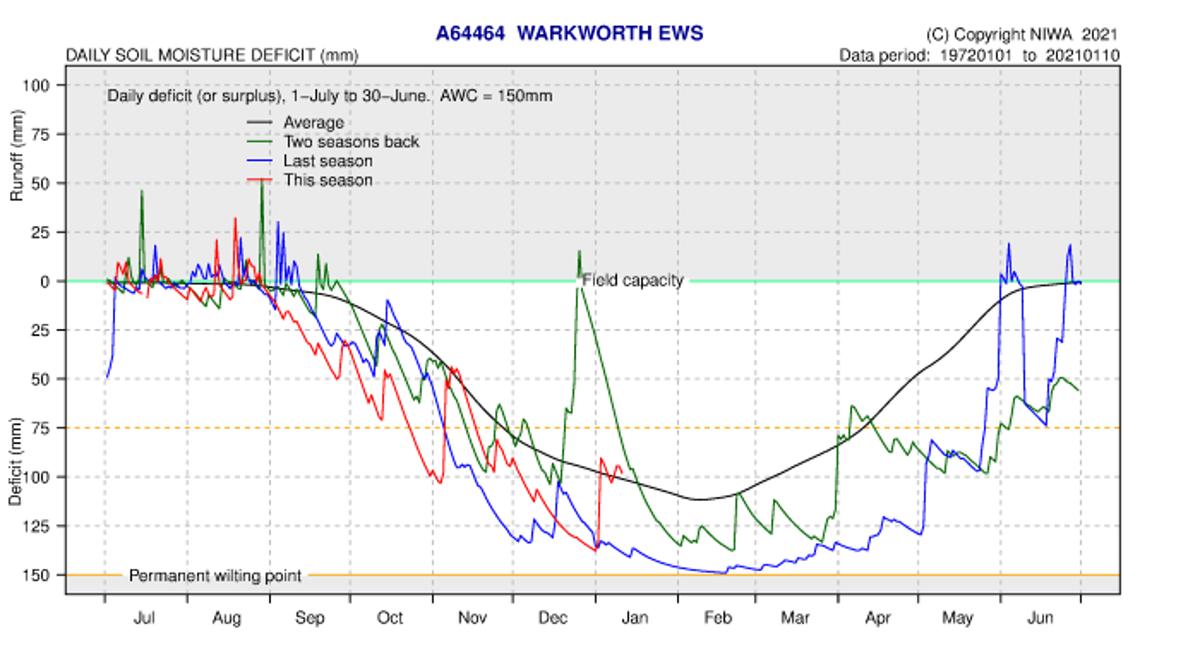
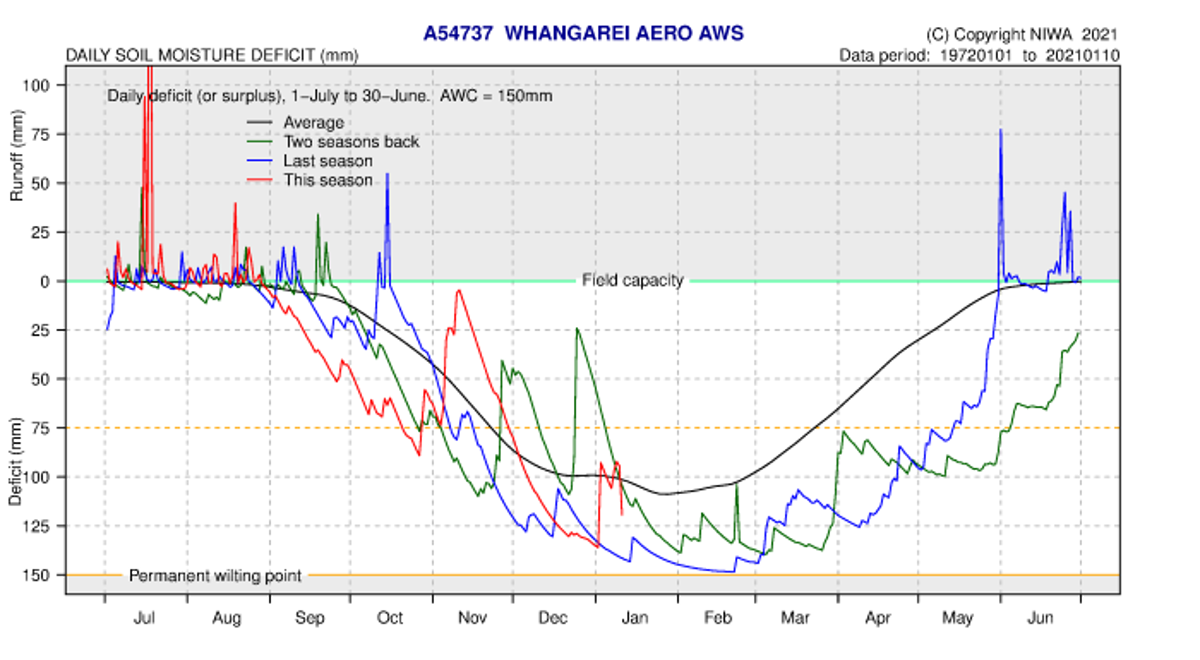
Soil moisture deficits (SMD)
NIWA water balance modelling indicates soil moisture deficit is below average at all NIWA climate stations except Kaikohe and Warkworth. This is influenced by low rainfall over December but increased at most locations with the rainfall early January 2021. “SMD is calculated based on incoming daily rainfall (mm), outgoing daily potential evapotranspiration (PET, mm), and a fixed available water capacity (the amount of water in the soil 'reservoir' that plants can use) of 150 mm” (NIWA).
Soil moisture deficit at NIWA climate station
| NIWA Climate Stations | Observed Soil moisture deficit (mm) as of 10/01/2021 | Average December soil moisture deficit | Difference between Expected and Average |
| Kaitāia | -110mm | -100mm | -10 |
| Kerikeri | -115mm | -75mm | -40 |
| Whangārei | -120mm | -100mm | -20 |
| Kaikohe | -75mm | -75mm | 0 |
| Dargaville | -115mm | -110mm | -5 |
| Warkworth | -100mm | -100mm | 0 |