August 2020 climate report
17 Sep 2020, 1:00 PM
Summary
For most of the region, August 2020 was near normal or wetter than a normal when compared to a typical month of August.
Maungaturoto, Ruawai, and Pouto Peninsula received slightly less rain than normal.
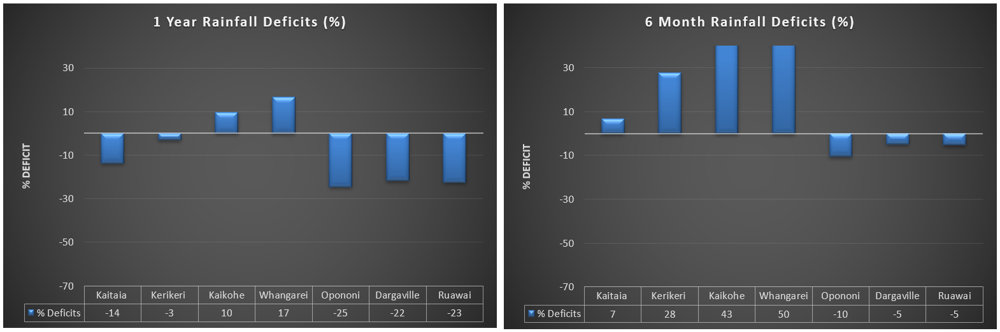
A -25% rainfall deficit over the long term (12 month) period remains on the west coast (Opononi, Dargaville and Ruawai). These areas have been receiving less rain from a predominantly north-easterly airflow.
Winter has been a wetter than normal throughout most of Northland.
NIWA are alerting to a reasonably high likelihood of La Niña conditions continuing to develop. For Northland, this typically means a wetter region with an increase in north-easterly airflow and an increased probability of subtropical lows affecting Northland during summer. However, the western areas of Northland can be drier in these conditions.
River flows continue to be above normal, and groundwater systems are normal or above normal in all but the Mangawhai aquifer.
Soil moisture is low for this time of year, largely due to the lack of rainfall through September so far (at time of writing) and warmer than normal temperatures. The long-range outlook tends towards wet conditions, but if dry conditions were to occur through spring and summer then low soil moisture is an indicator that river flows could rapidly drop.
Outlook
September - November
The long-range forecast from September to November is for near normal rainfall for Northland. The potential for the development of La Niña conditions over the next three months remains, and if it does develop, then the occurrence of rain bringing north-easterly winds could continue being frequent, as they have been since June (NIWA).
NIWA Temperature, Rainfall, Soil Moisture and River Flows probabilities for September to November 2020
| Temperature | Rainfall | Soil moisture | River flows | |
| Above average | 60• | 35 | 20 | 20 |
| Near average | 30 | 40• | 40• | 40• |
| Below average | 10 | 25 | 40• | 40• |
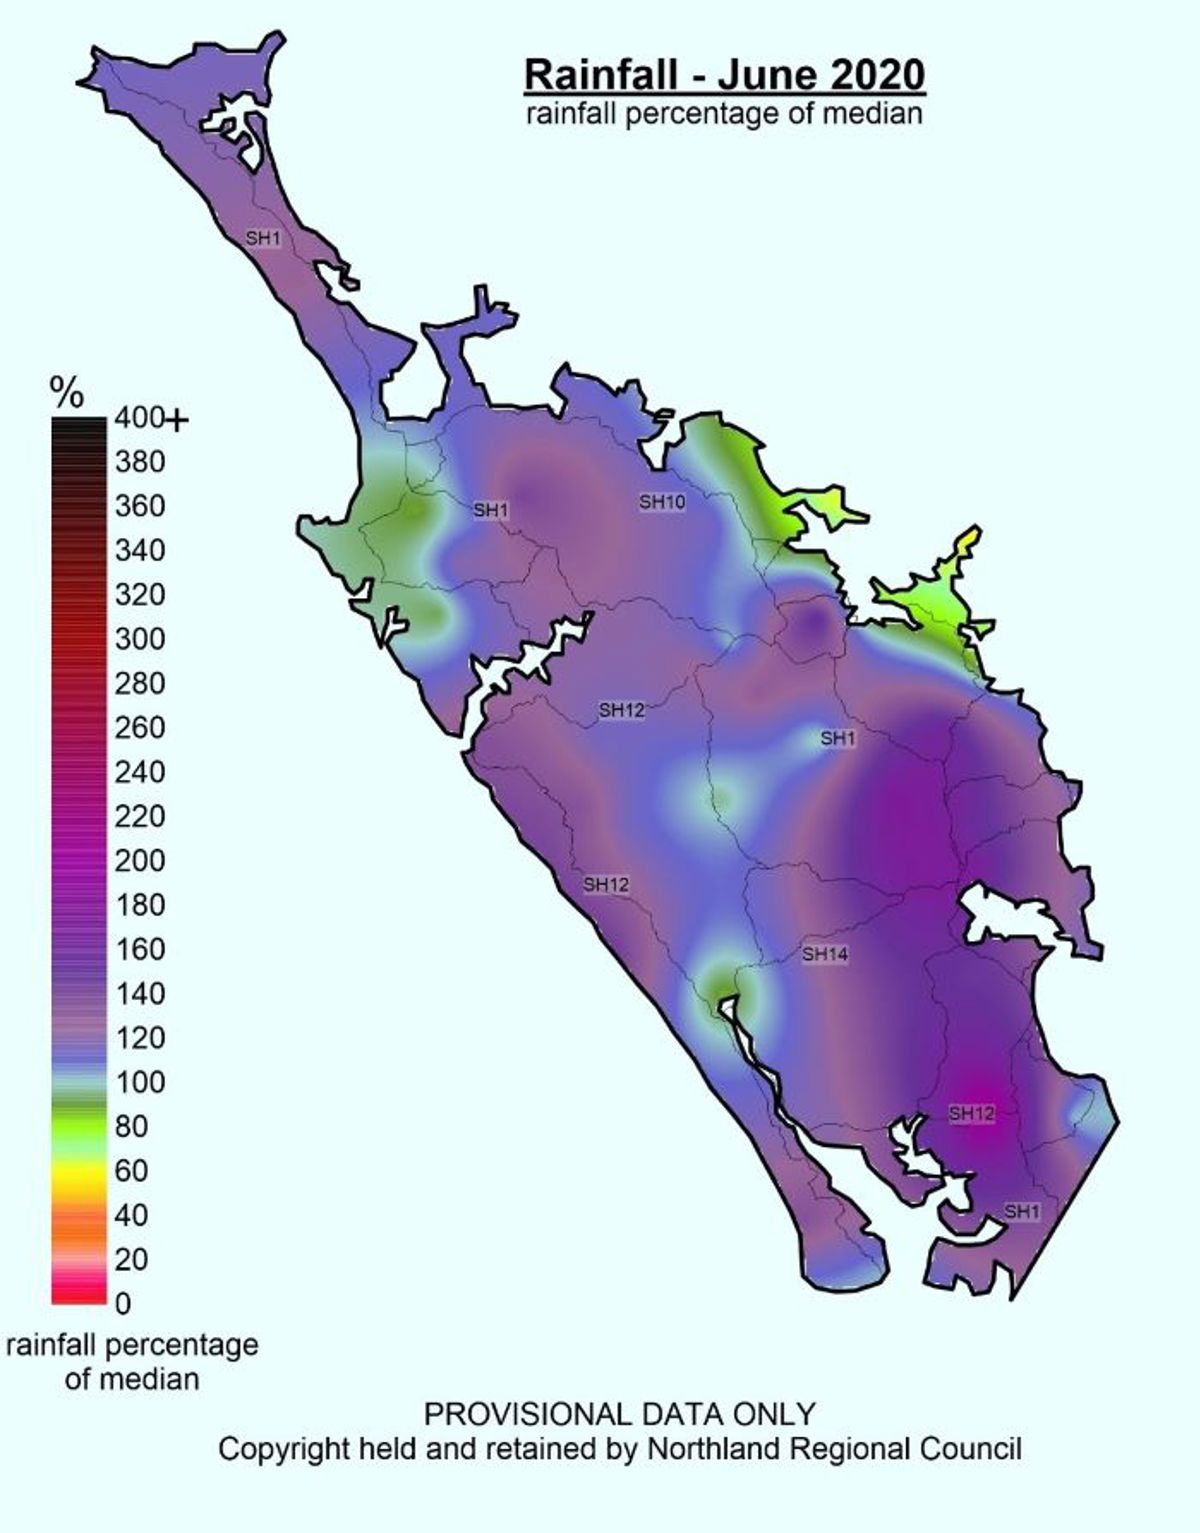
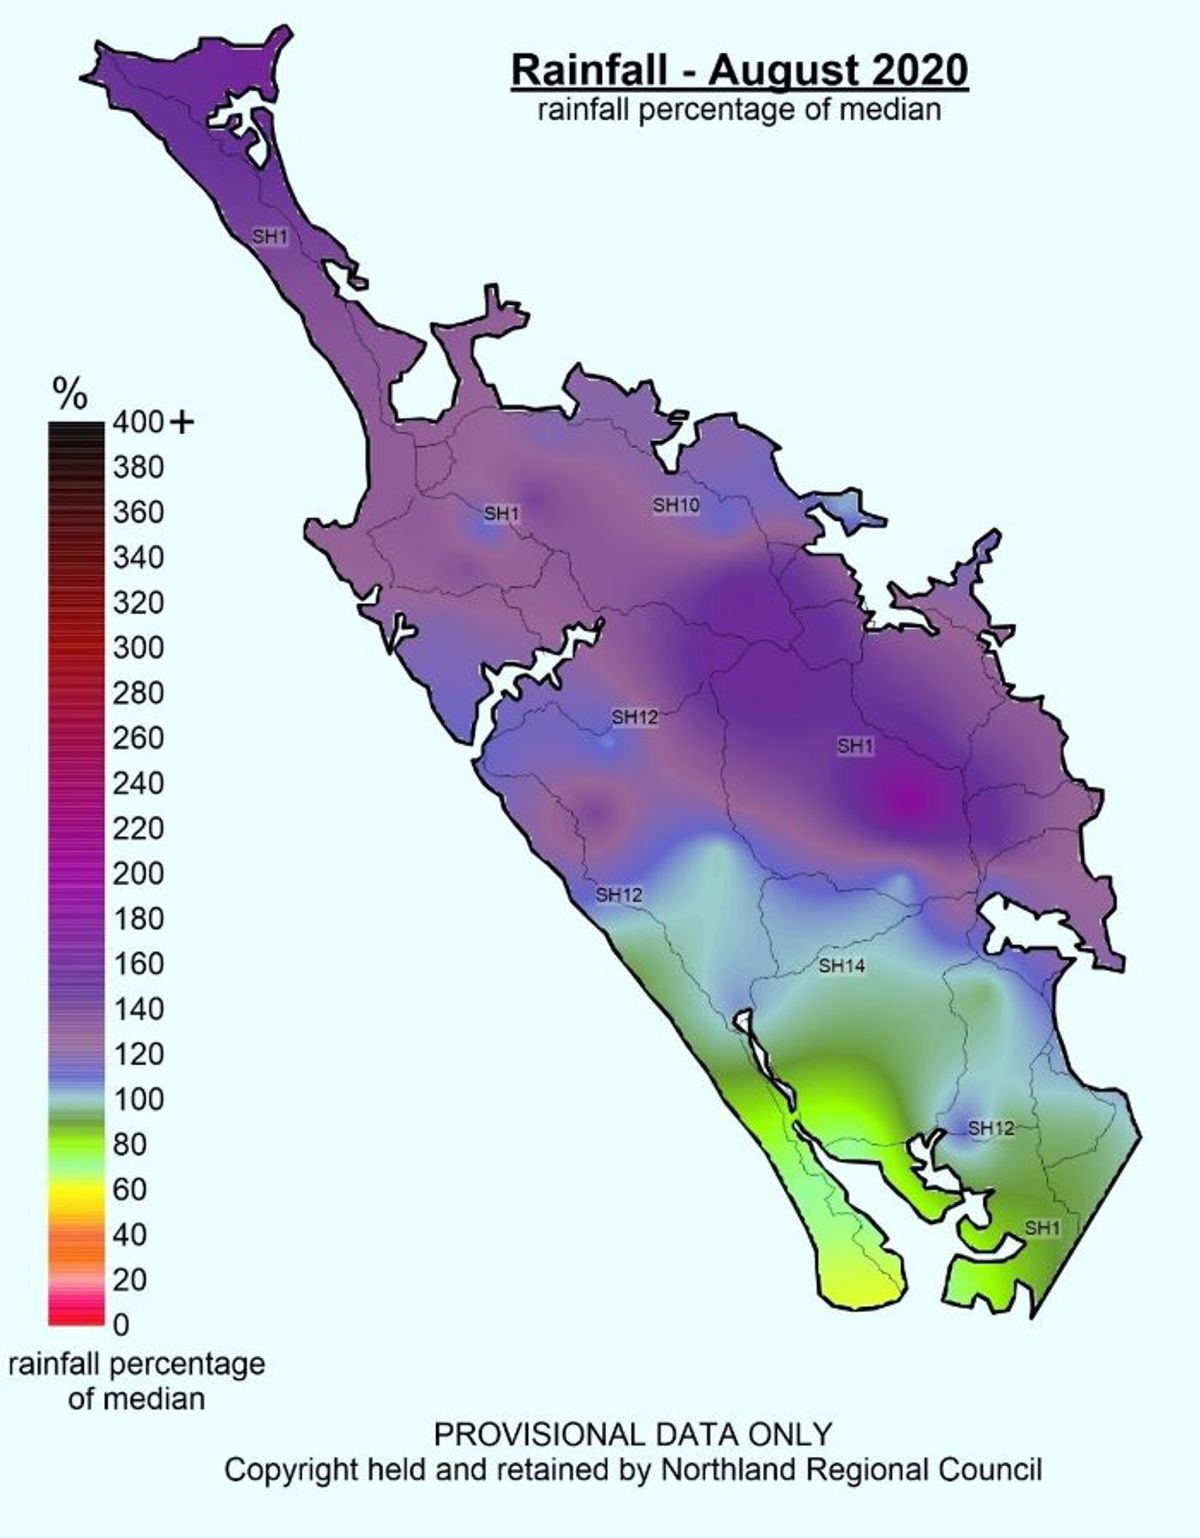
Rainfall
August rainfall averaged 196mm across the region with a minimum of 82mm recorded at Pouto Point in the south west and a maximum of 381.5mm at Waimamaku at Weka Weka Road in the central west coast. The region as a whole received around 121% of what we would usually expect for August. Generally, the south-west was protected from the weather systems, which came mostly from the northerly and easterly quarters. Areas north of the line from Kaihu to Marsden Point had more rain than usual and those to the south, including Maungaturoto, Ruawai, and Pouto Peninsula had less. The Pouto Peninsula recorded around 60-70% of normal, while the Hikurangi Swamp recorder north of Whangārei received 188% of the usual August rainfall, with several other recorders at around 150% of normal.
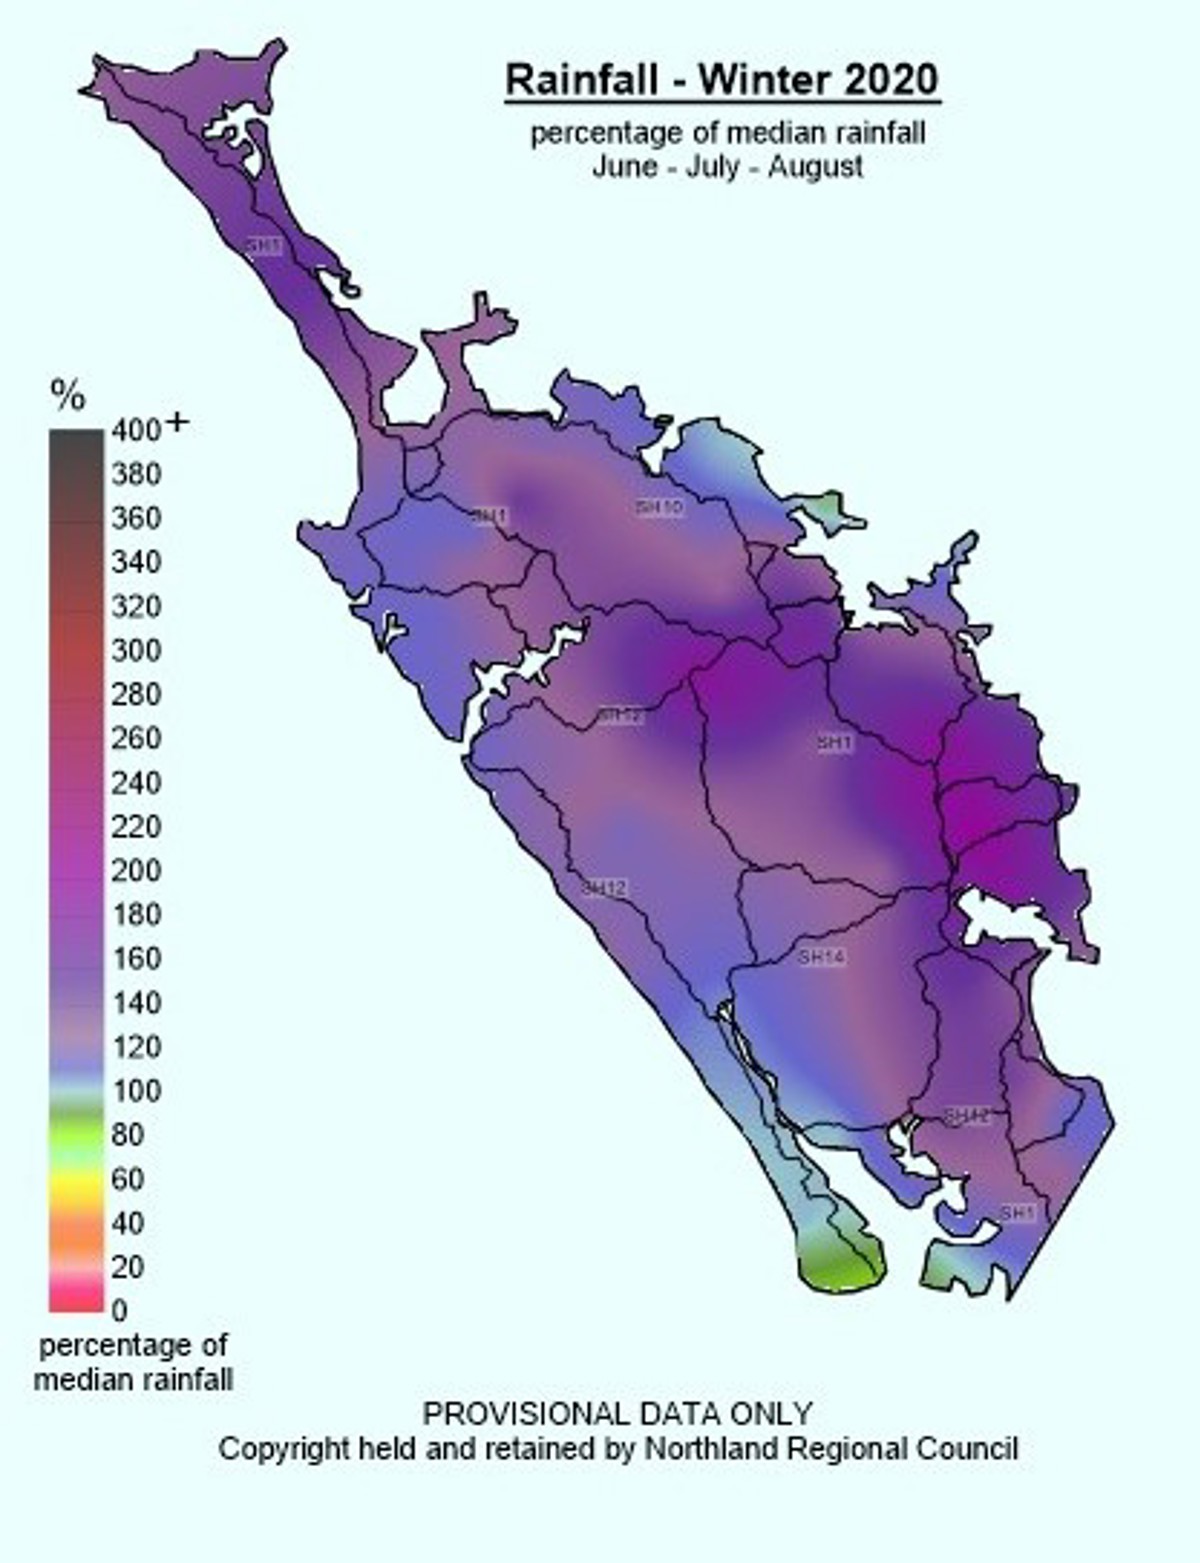
The three months of winter (June, July, August) have been wet, with most areas of Northland receiving more than typical for winter, the exceptions being Pouto Peninsula near Dargaville and Purerua Peninsula, Bay of Islands. Three sites received over one metre of rain – Hatea at Glenbervie Forest 1056.5mm, Whakapara at Puhipuhi 1106.0mm and Waimamaku at Weka Weka Road 1107.5mm. The lowest winter rainfall total was recorded at Pouto Peninsula (300.5mm). Regionally, Northland received an average of 674mm and this equated to 134% of the median winter rainfall so a third more rain this winter than normal. Glenbervie received 199% while Pouto only managed 85% of the winter median.
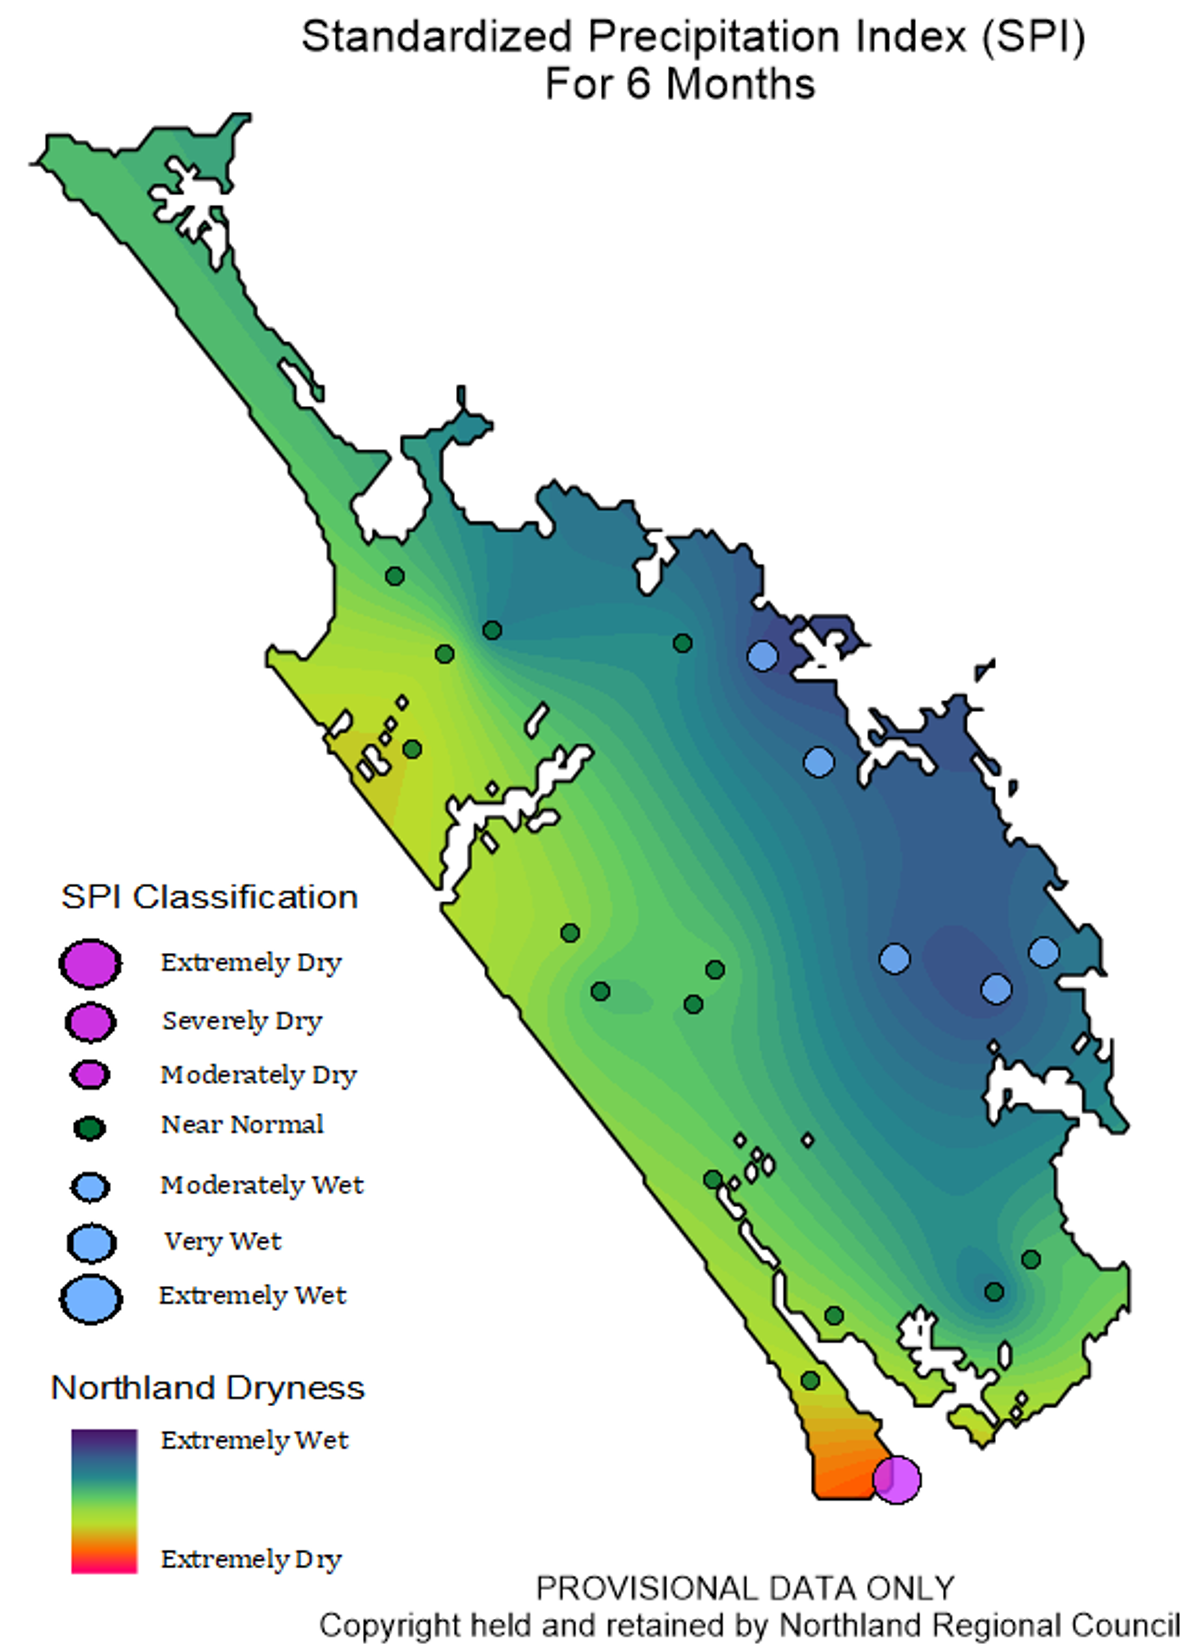
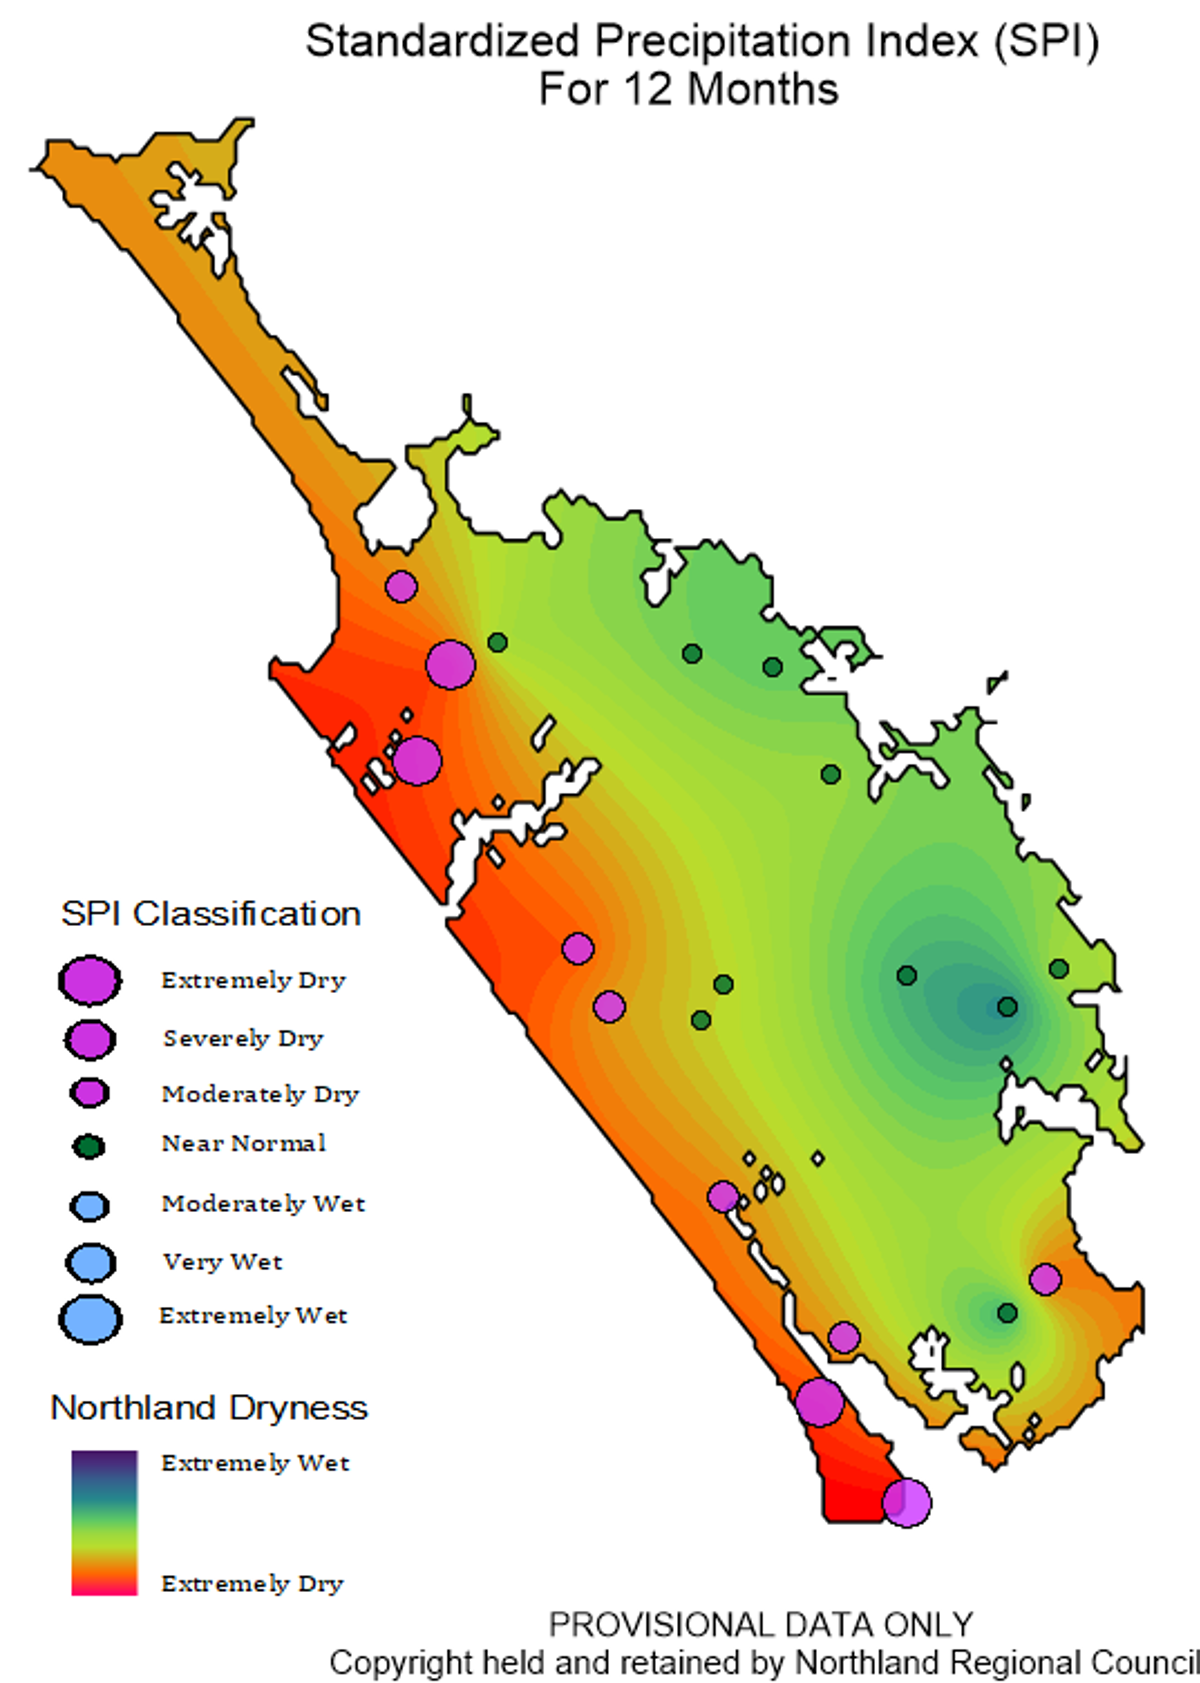
A -25% rainfall deficit over the long term (12 month) period remains on the west coast (Opononi, Dargaville and Ruawai). For the 6-month period, rainfall has been near normal at these locations, and quite wet at Kerikeri, Kaikohe and Whangārei (+30 to +50%) (see rainfall deficit plots below).
Rainfall % median maps for June 2020 to August 2020, and for Winter 2020


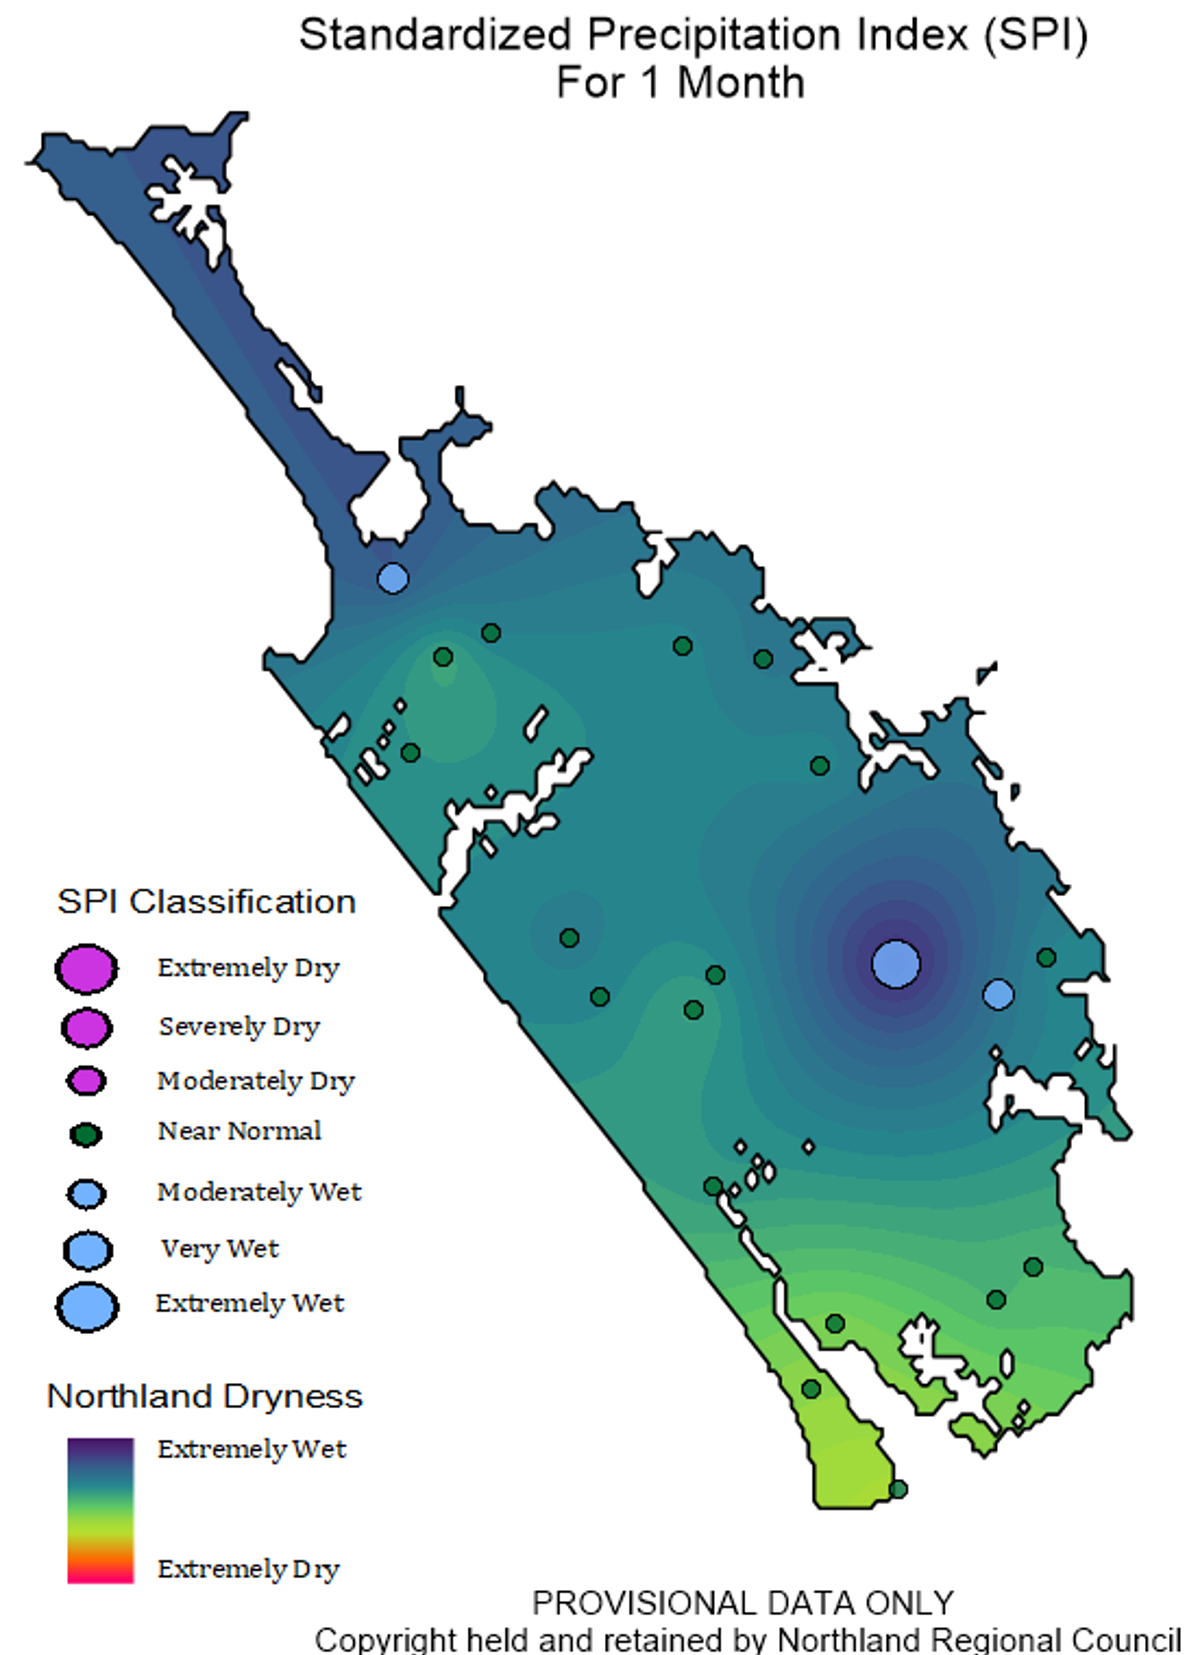
SPI Index map for 1, 6 and 12 months to the end of August 2020


One year and six-month rainfall deficit percentage values
River flow
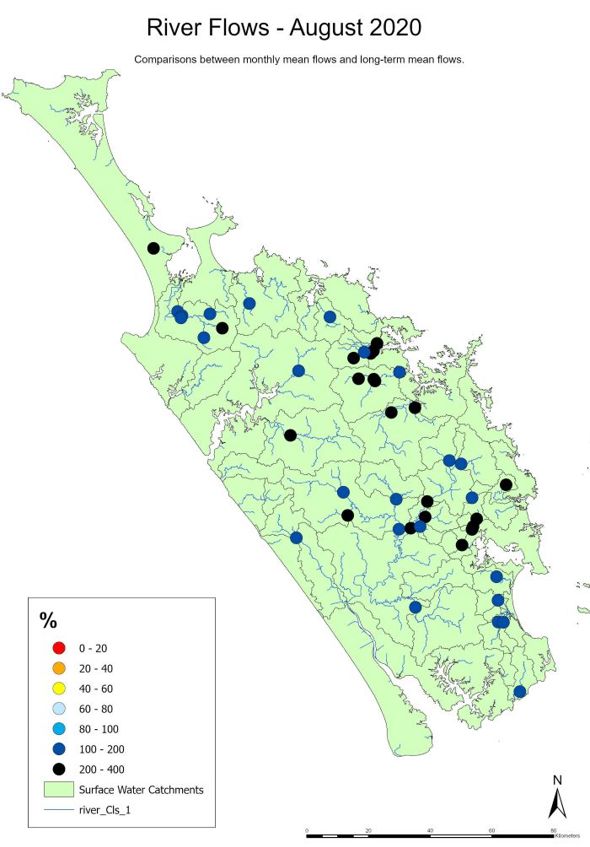
For August 2020, river flows were above normal throughout the region, with many rivers at 200-400% of the typical August flows, and the remainder at 100-200% of the typical August flows when compared to long term averages (see map below “River Flows – July 2020).
Flow map August 2020
Groundwater
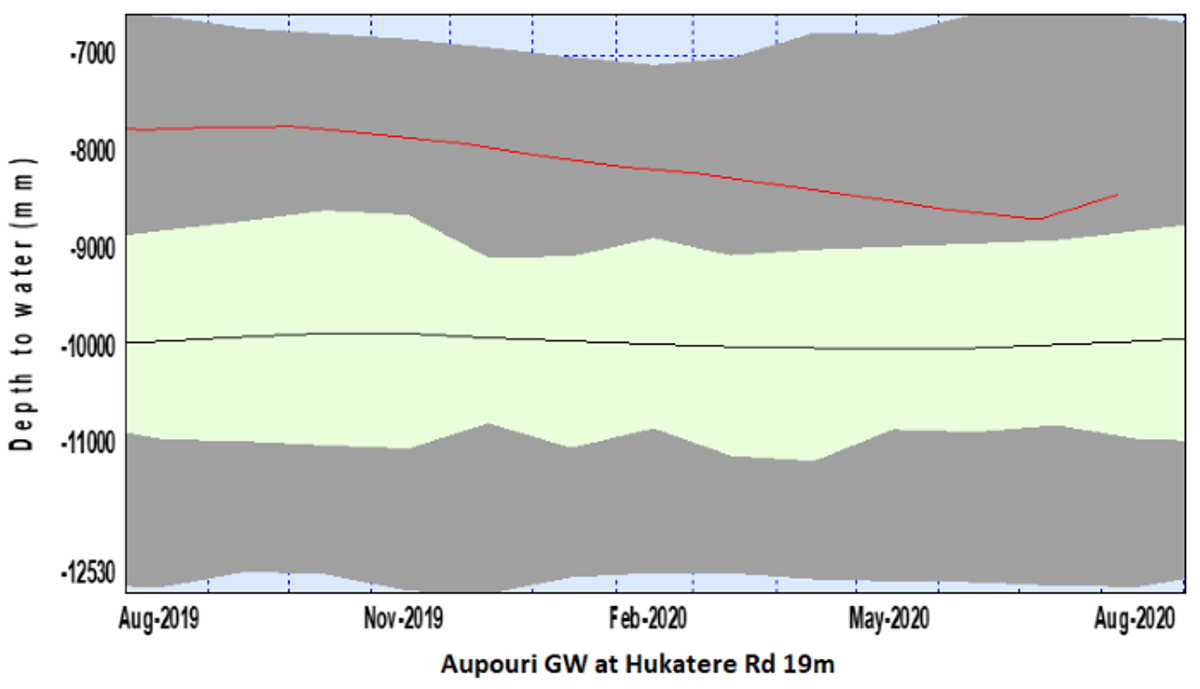
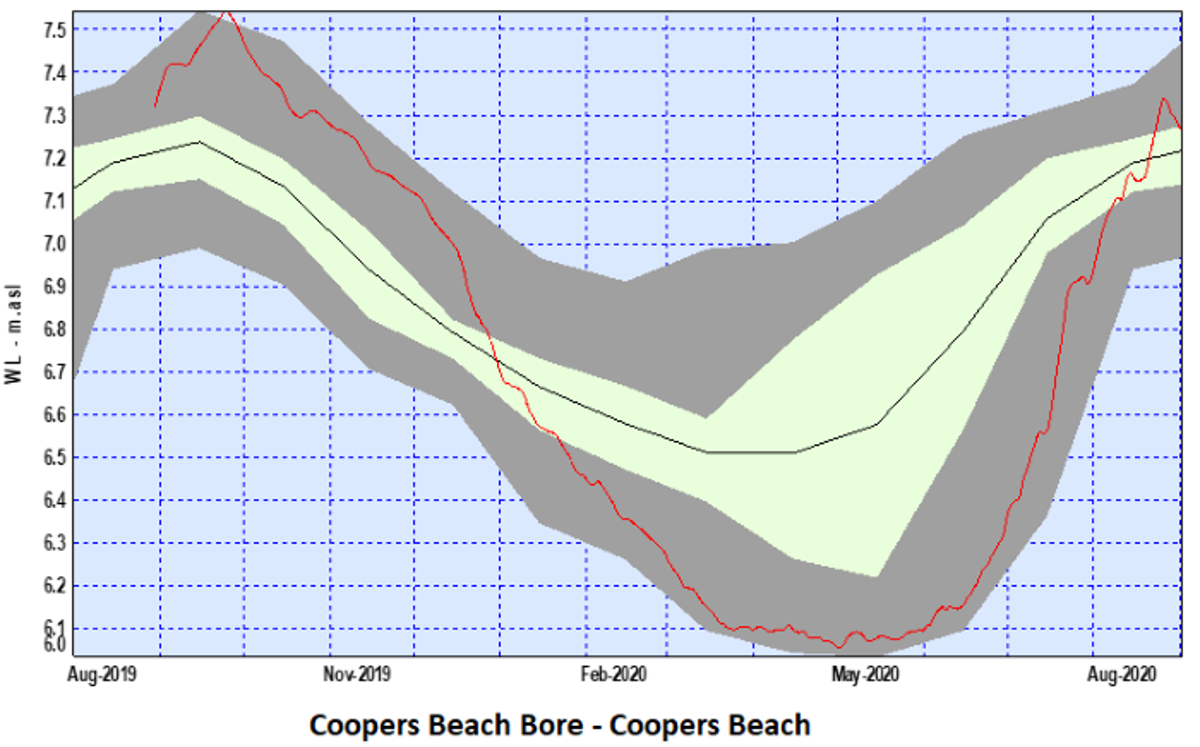
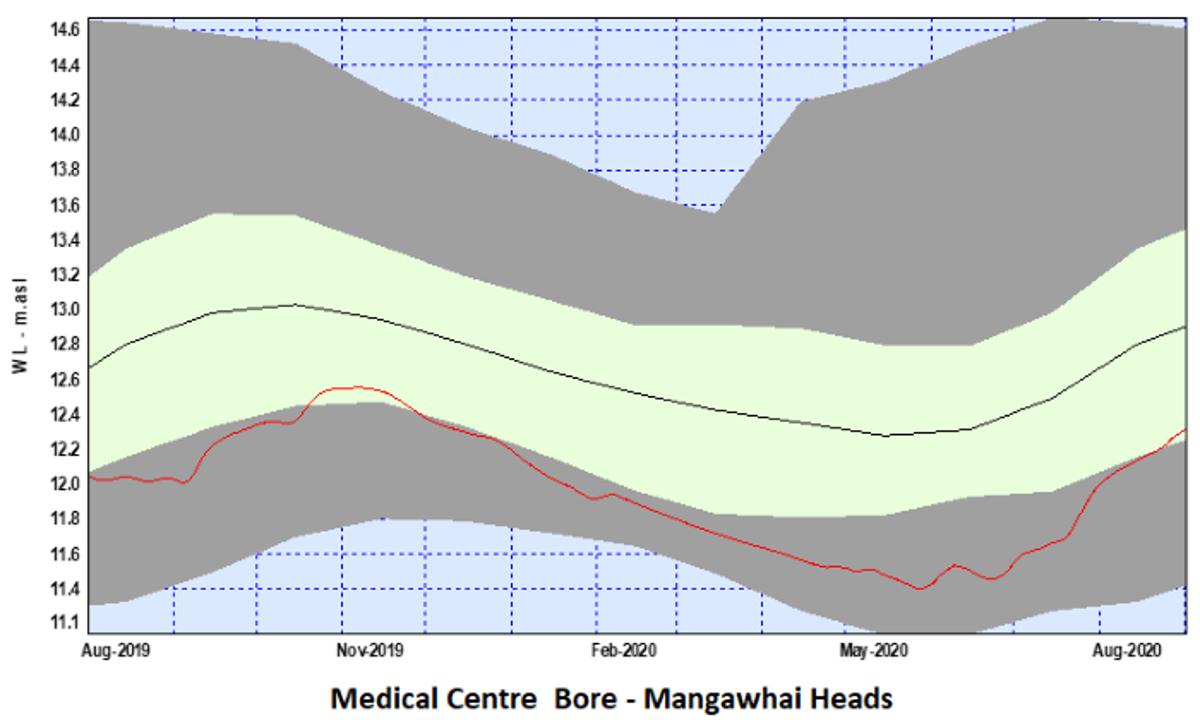
Water level readings indicate that the Mangawhai groundwater system is below average for August 2020. All other aquifers appear to have recovered well with levels now typical of this time of year. A wet winter has done a good job replenishing Northland's aquifers.
Northland's aquifer status
|
Groundwater Systems |
Status for August 2020 |
|
Aupouri |
OK |
|
Taipa |
OK |
|
Russell |
OK |
|
Kaikohe |
OK |
|
Whangārei |
OK |
|
Marsden-Ruakaka |
OK |
|
Mangawhai |
BELOW AVERAGE |
|
Poroti |
OK |
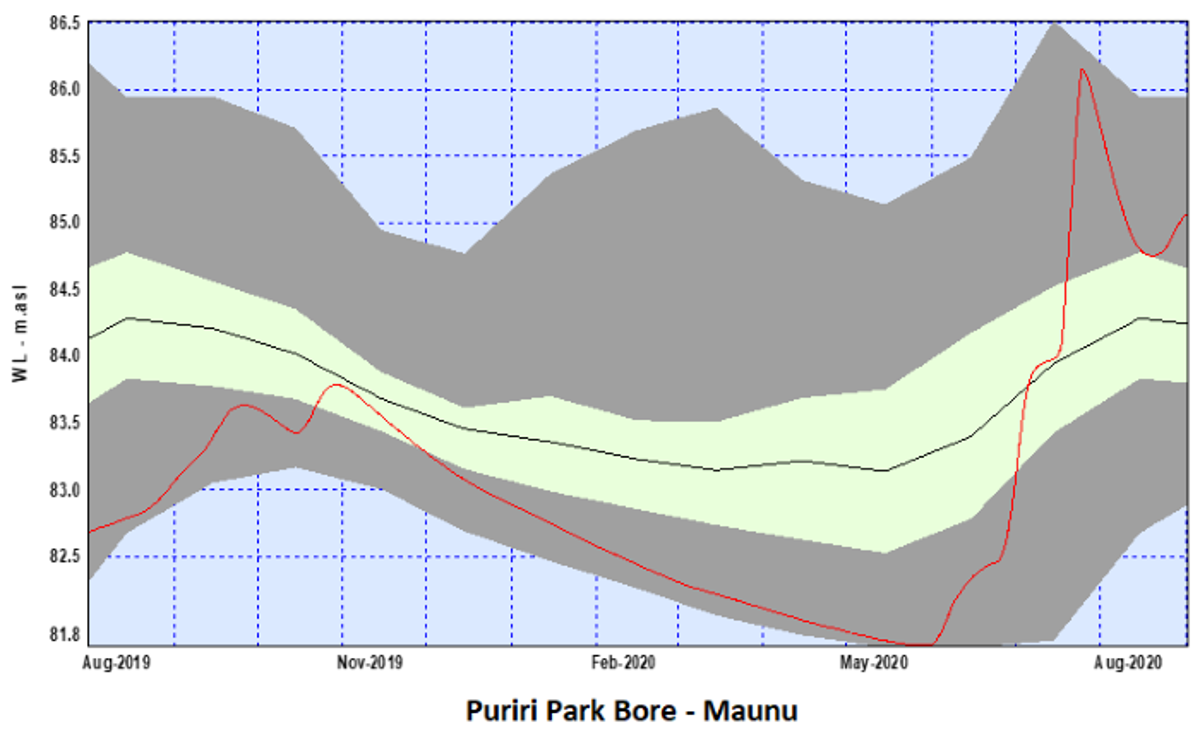
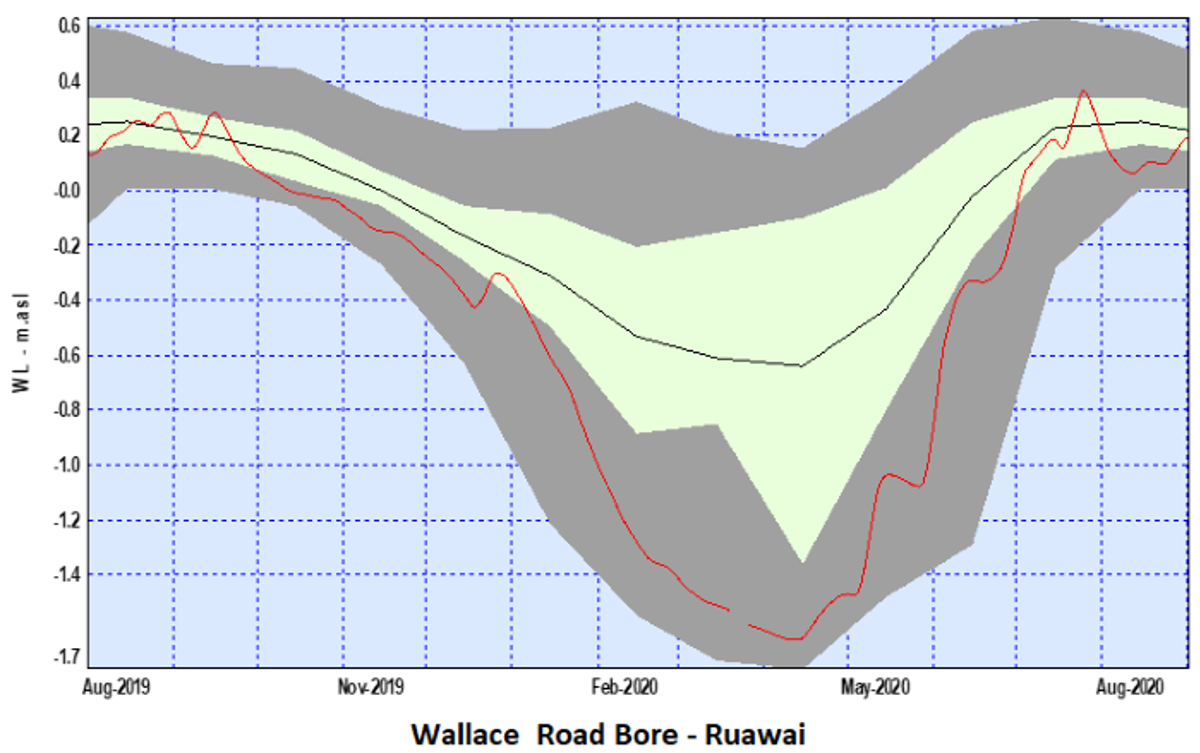
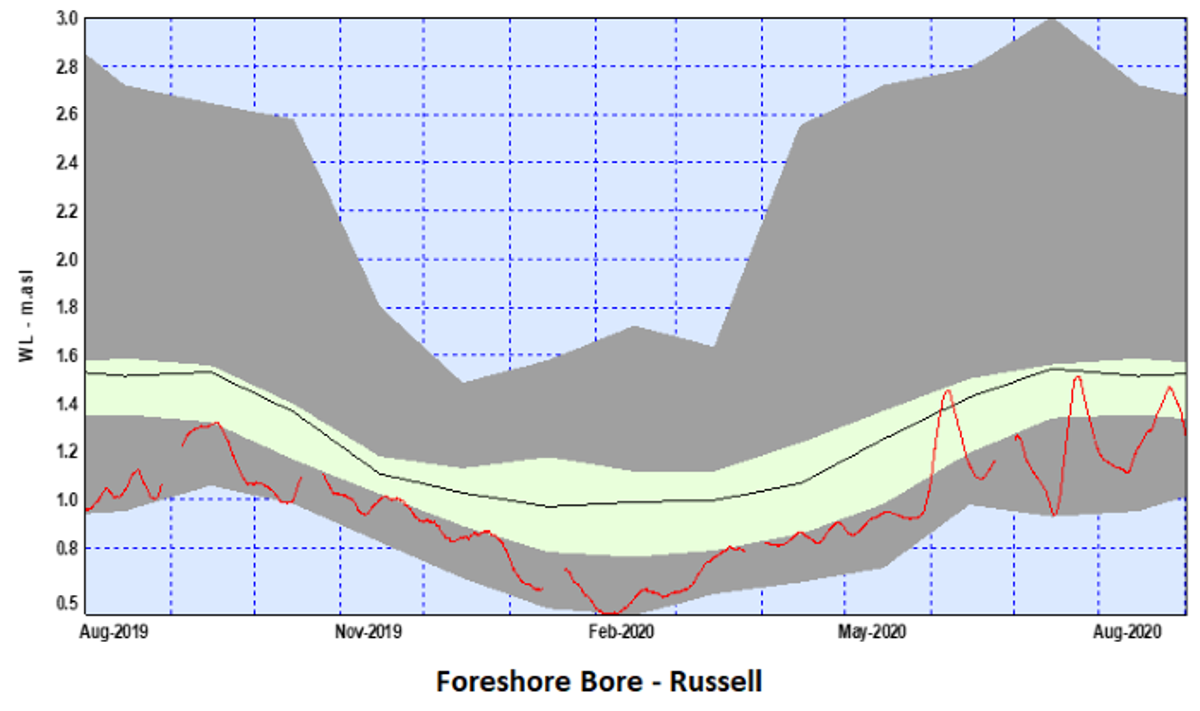
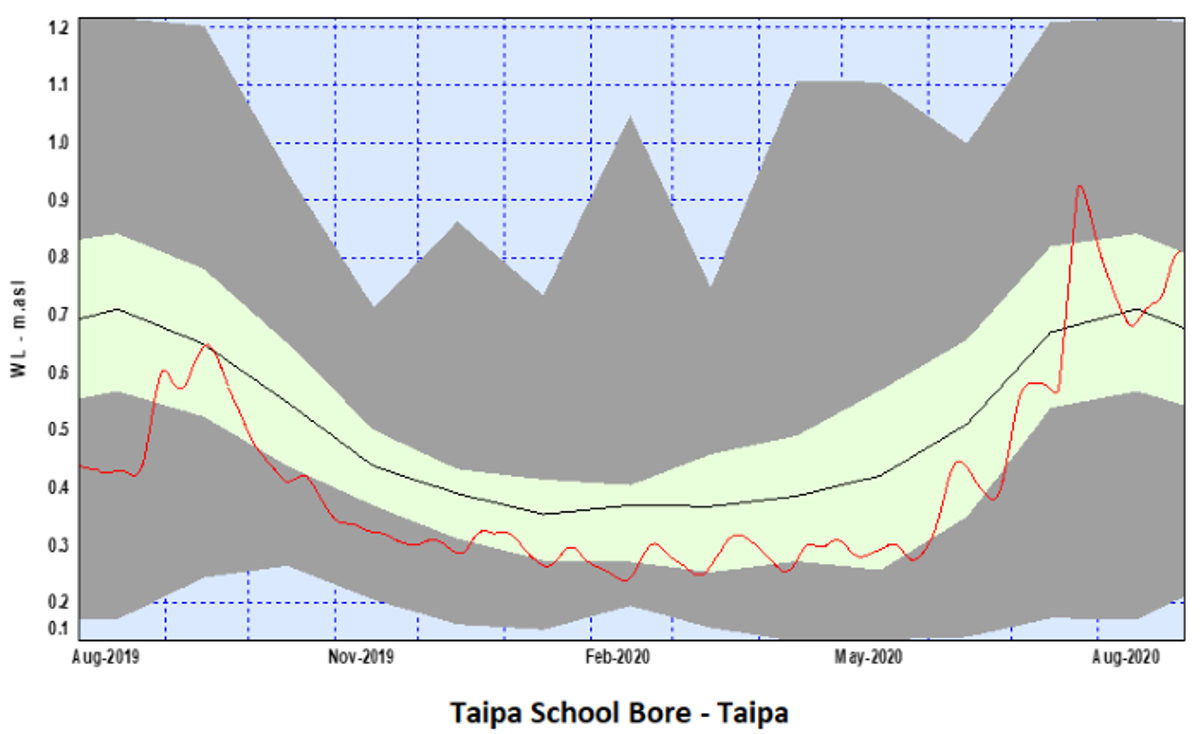
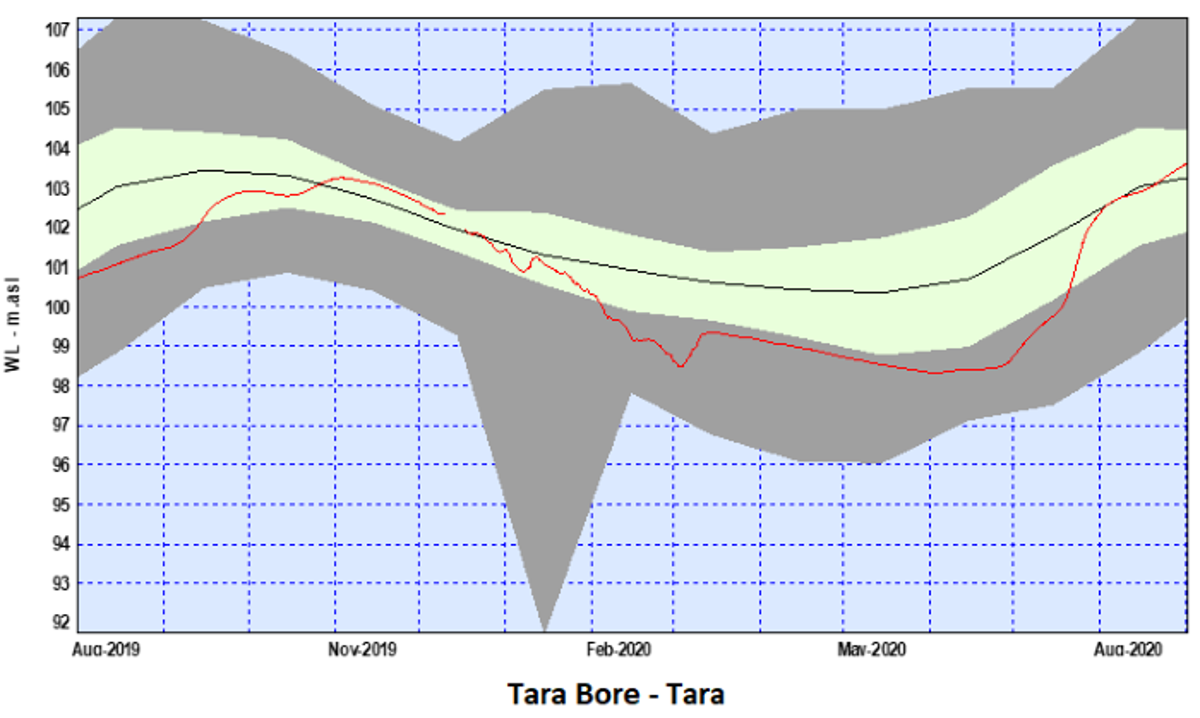
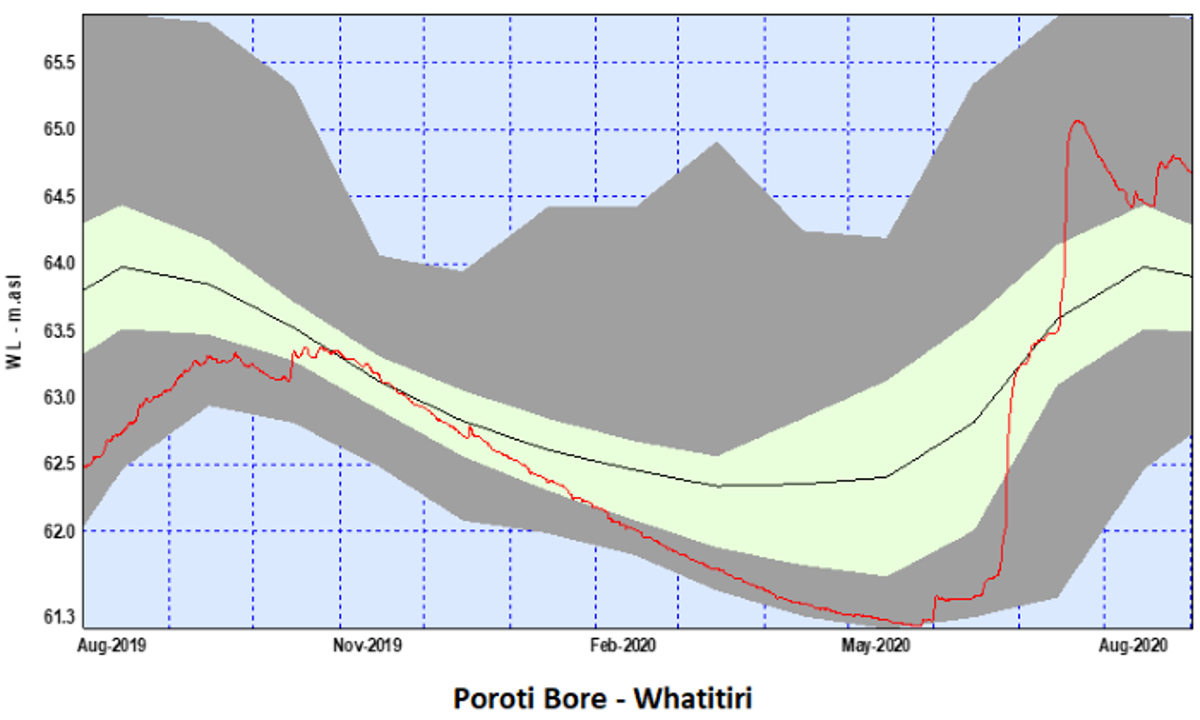
Groundwater trends
One-year groundwater trends (red) relative to the long-term average (black) and upper and lower percentiles (bottom grey area denotes 0-20th percentiles)


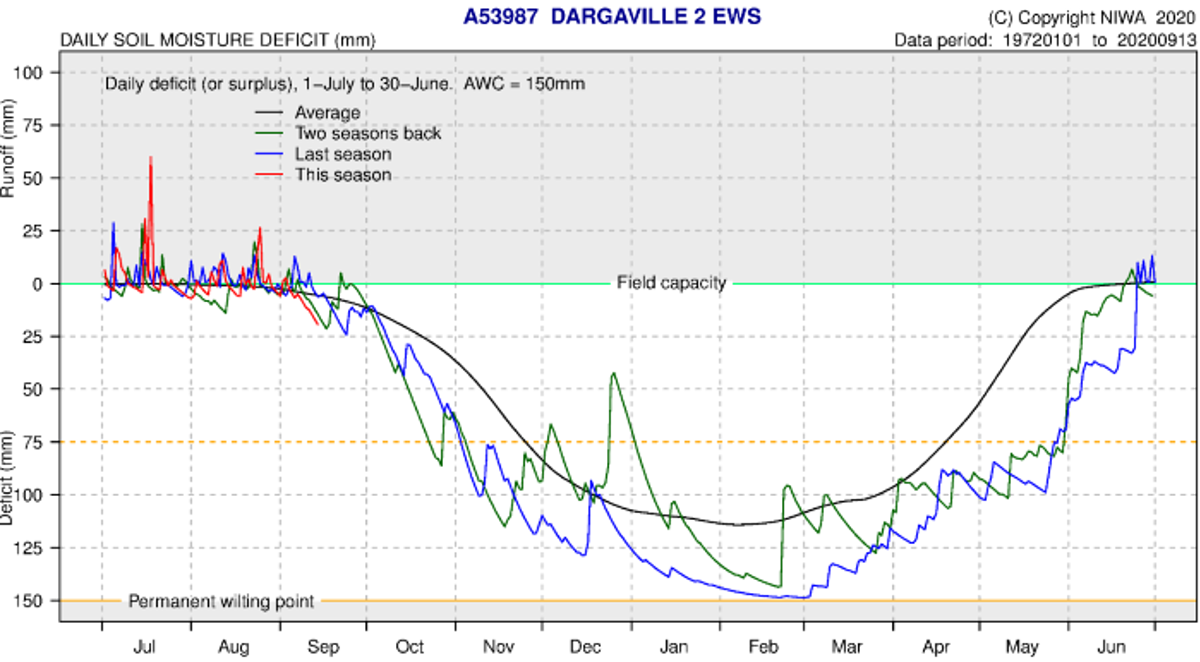
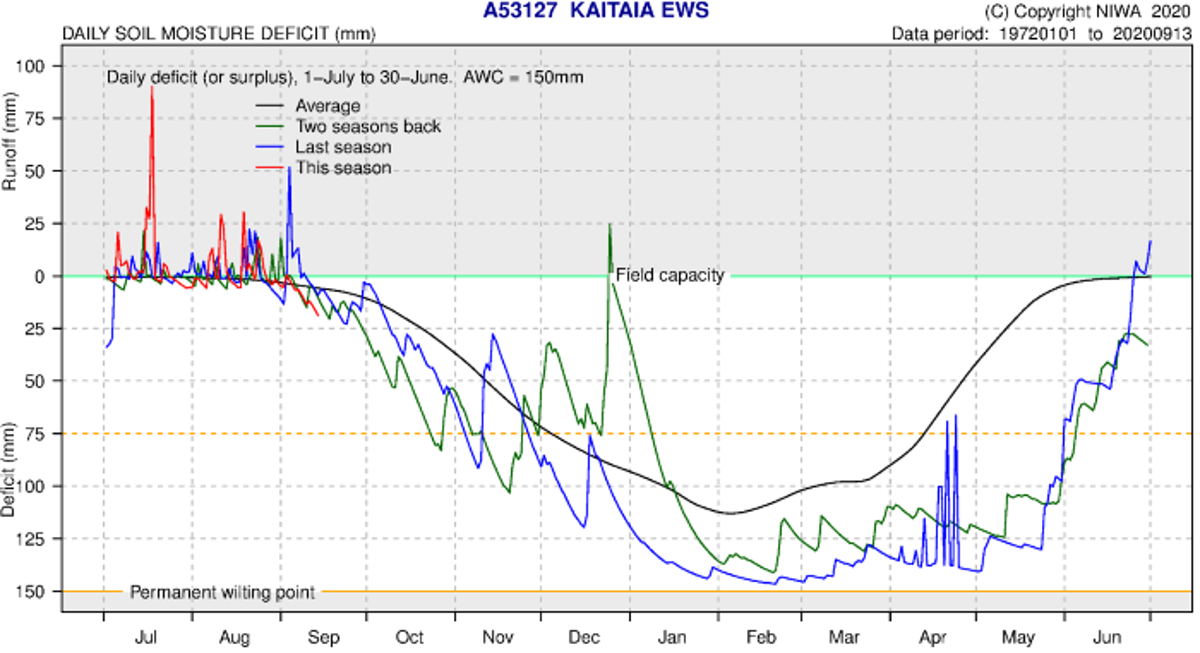
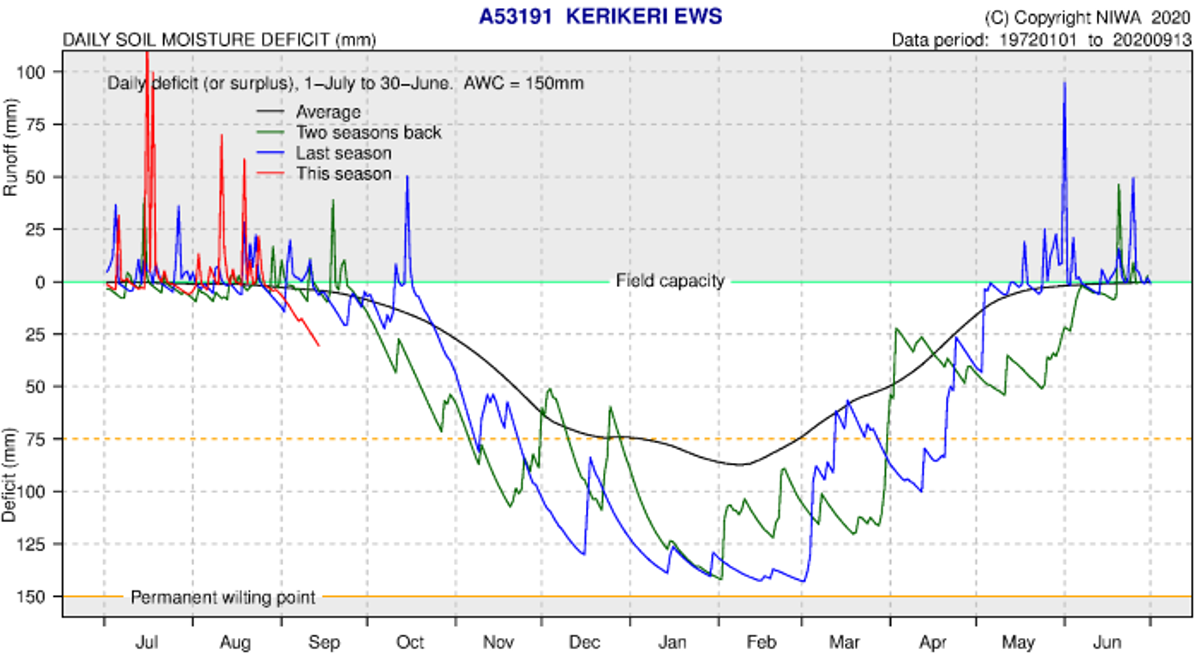
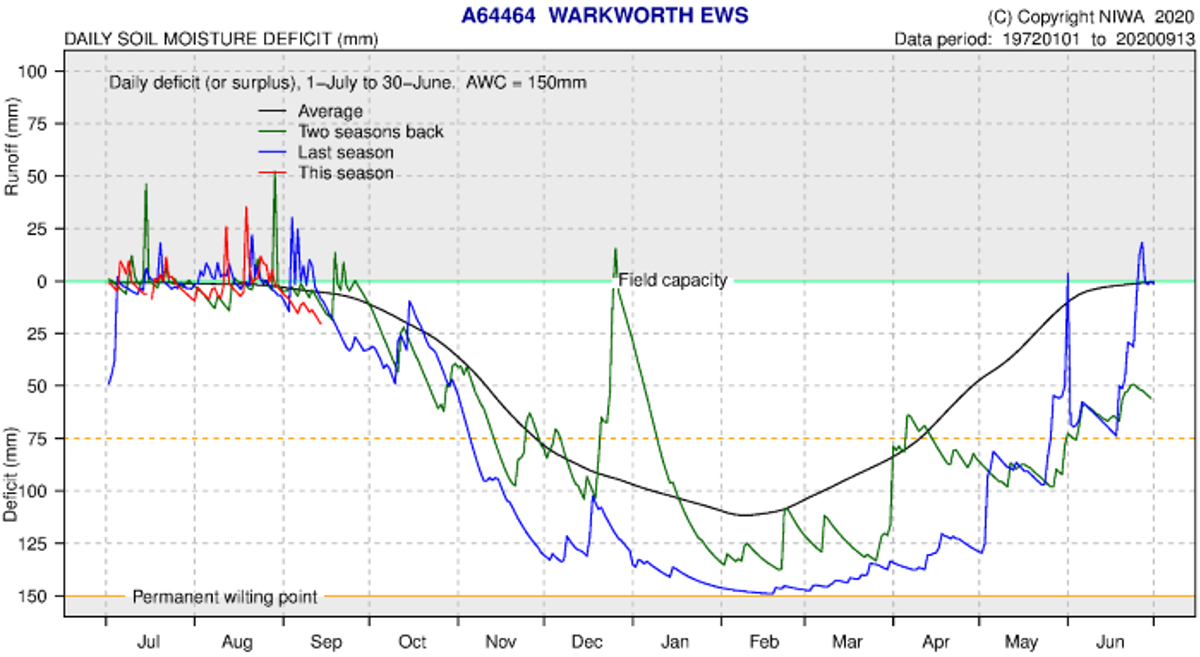
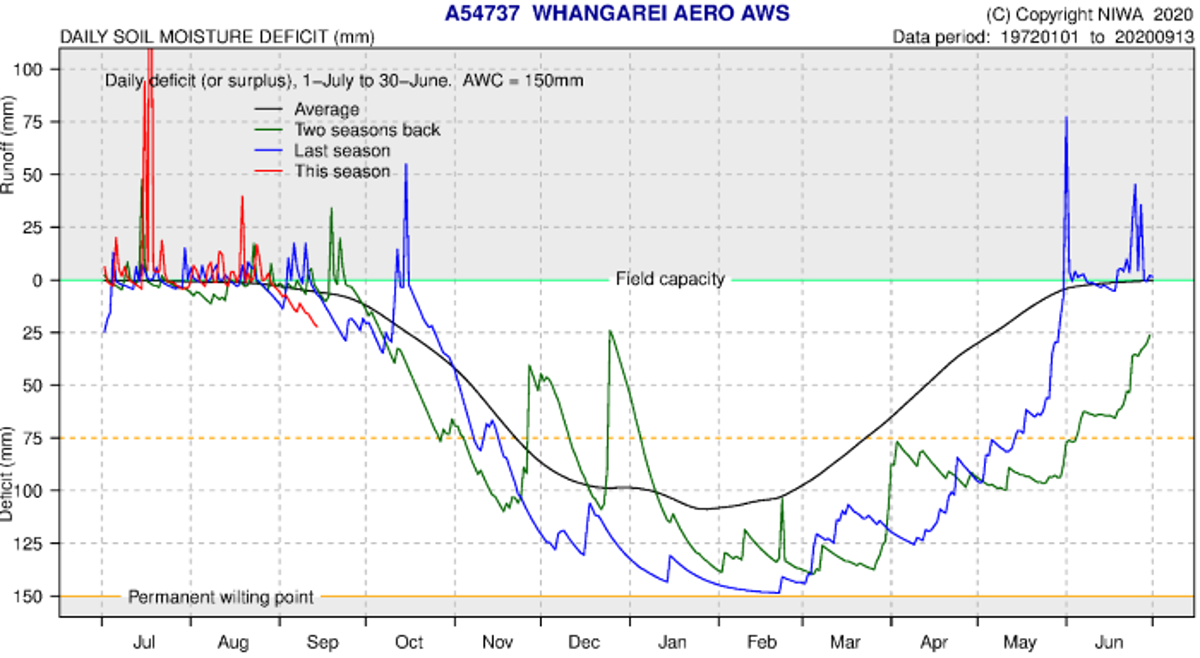
Soil moisture deficits
NIWA water balance modelling indicates soil moisture deficit is below average at all NIWA climate stations, largely due to a dry first half of August “SMD is calculated based on incoming daily rainfall (mm), outgoing daily potential evapotranspiration (PET, mm), and a fixed available water capacity (the amount of water in the soil 'reservoir' that plants can use) of 150 mm” (NIWA).
Soil moisture deficit at NIWA climate stations
|
NIWA Climate Station |
Observed Soil moisture deficit (mm) as of 13/09/2020 |
Average July soil moisture deficit |
Difference between Expected and Average |
|
Kaitaia |
-20 mm |
-5 mm |
-15 mm |
|
Kerikeri |
-30 mm |
-5 mm |
-25 mm |
| Whangārei |
-25 mm |
-5 mm |
-20 mm |
|
Kaikohe |
-20 mm |
-5 mm |
-15 mm |
|
Dargaville |
-20 mm |
-5 mm |
-15 mm |
|
Warkworth |
-20 mm |
-5 mm |
-15 mm |