June 2020 climate report
15 Jul 2020, 8:32 AM
Summary
It was great to get a month with typical to above typical rainfall throughout the region. This as well as saturated soil moisture conditions at all locations has caused a significant change in river flows compared to previous months, with all rivers above flows typical for the month.
The long period rainfall numbers tell us that we still need to be wary of the continuing rainfall deficit, particularly on the west coast which has a deficit of around -50% over the last 6 months. This area benefits less from the predominant north-westerly rain systems that have recently been a regular occurrence.
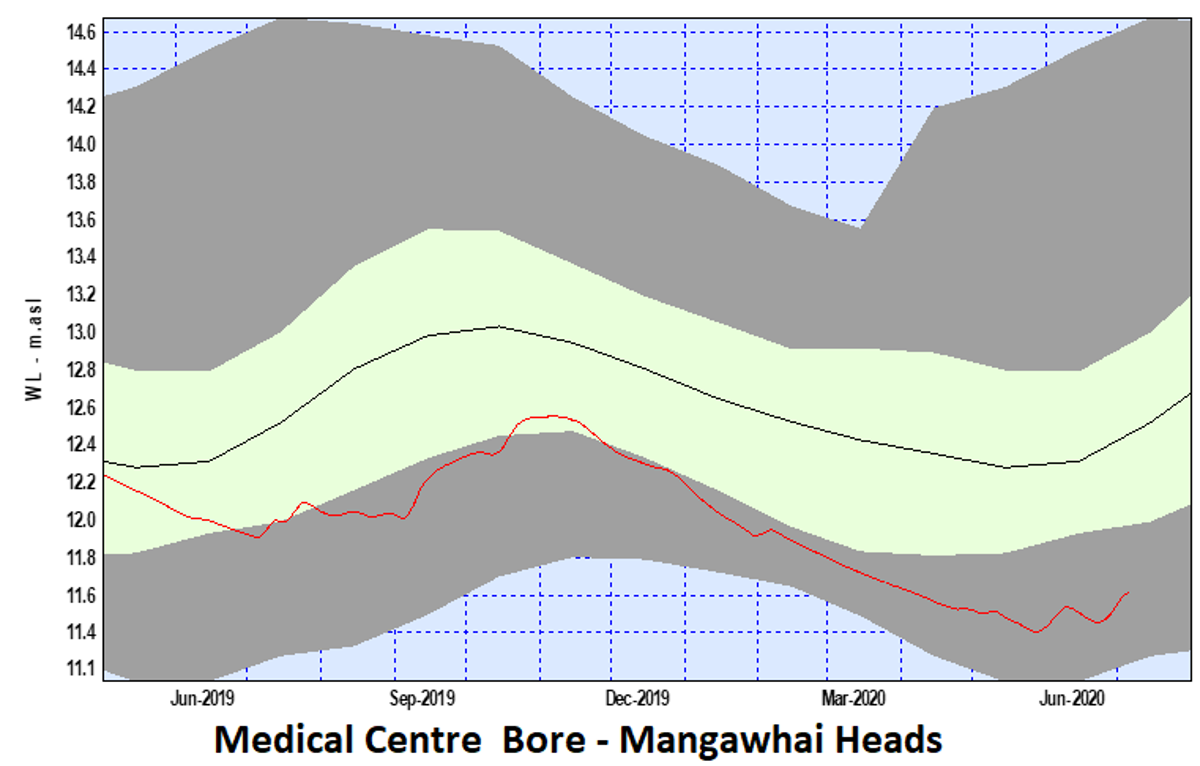
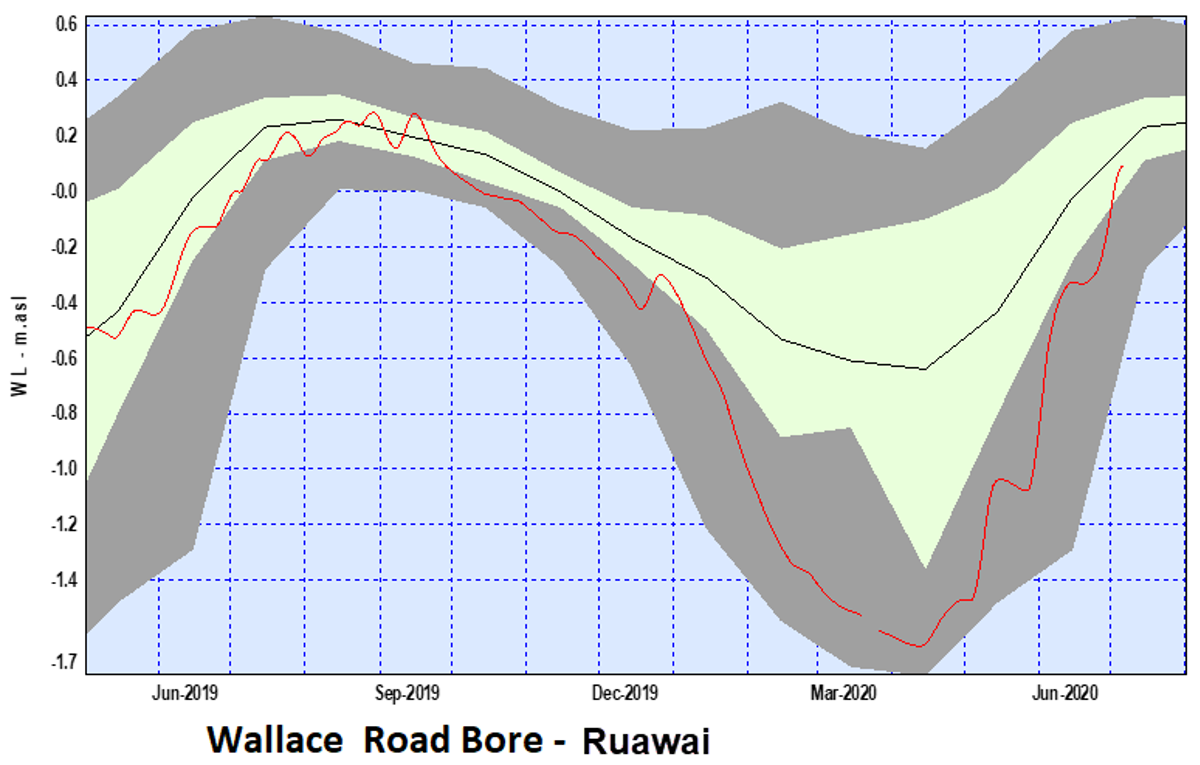
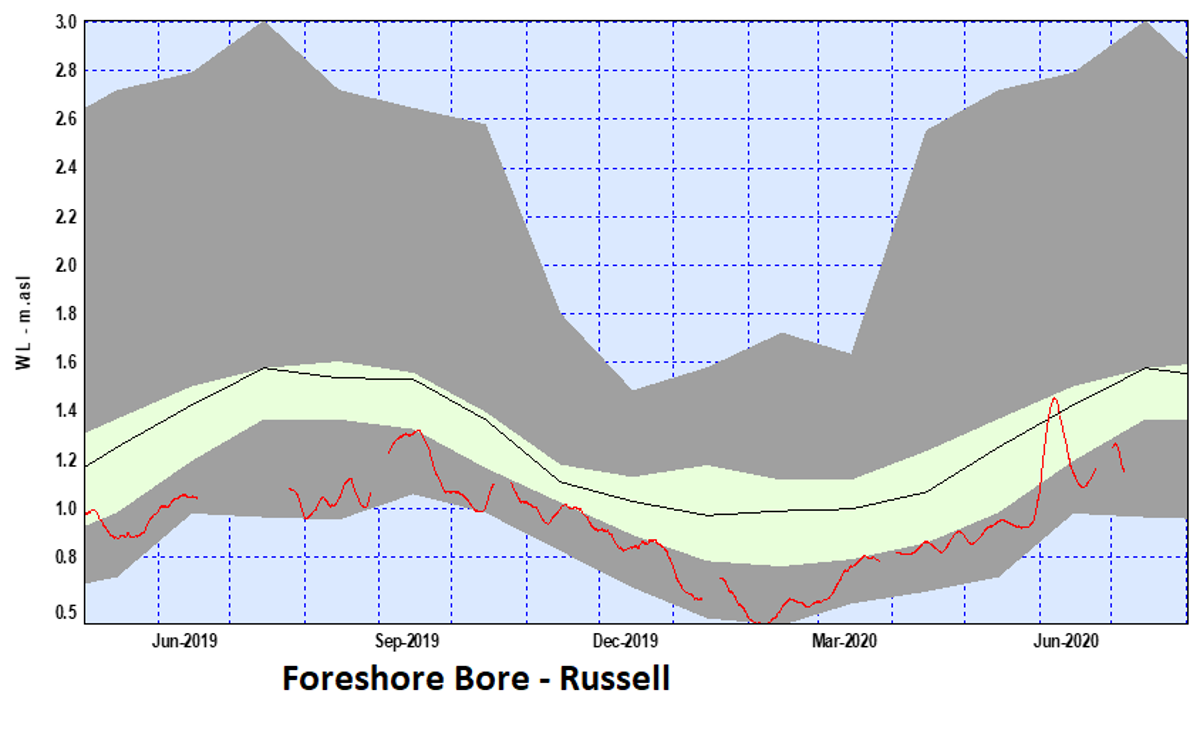
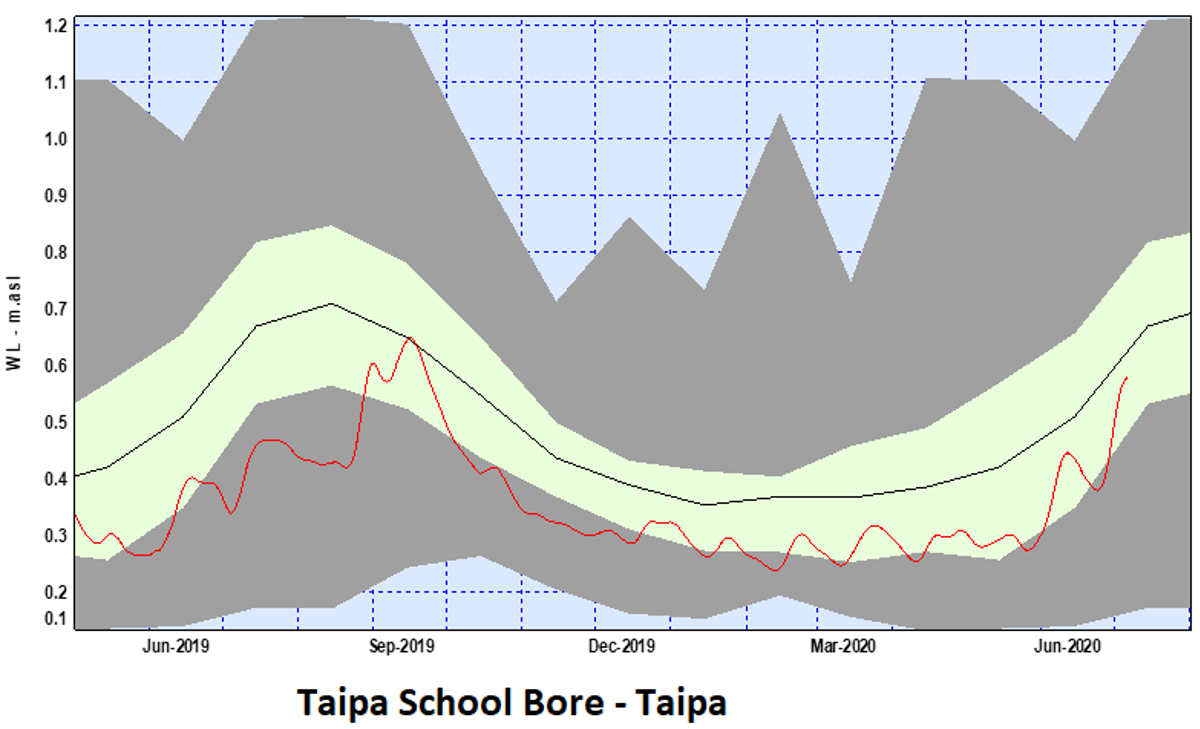
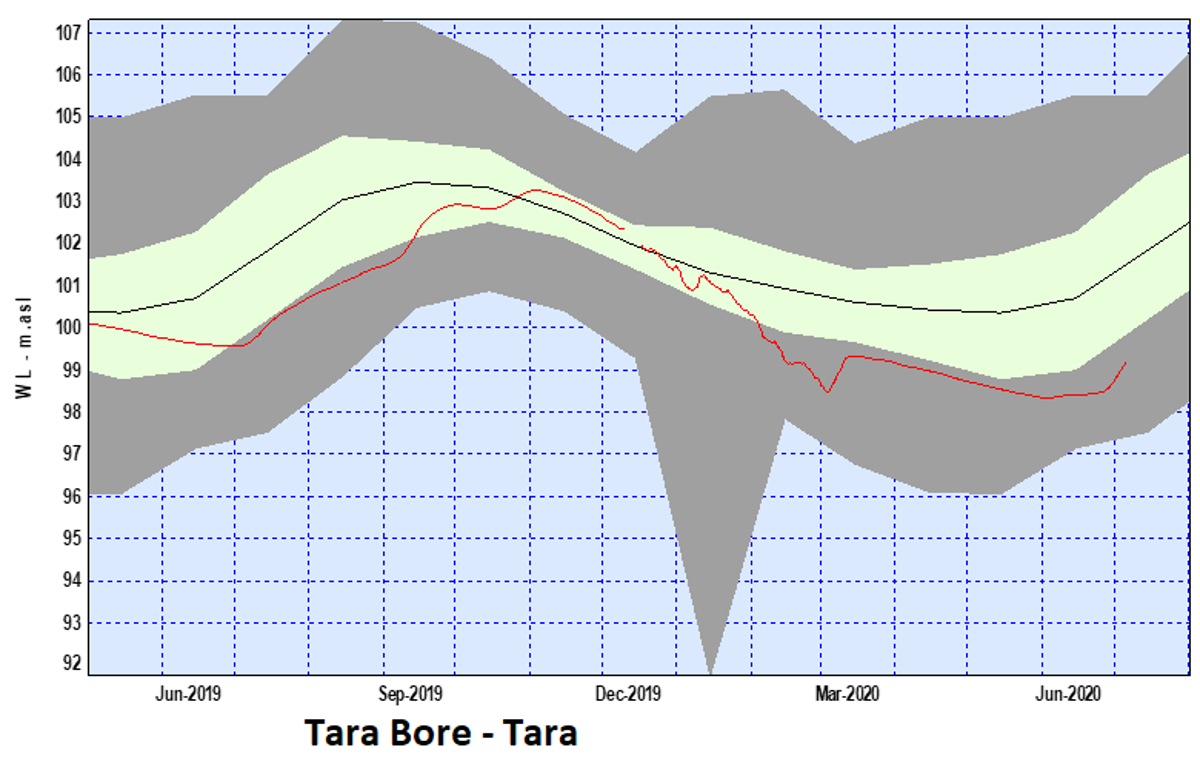
Groundwater levels at Russell, Taipa/Coopers Beach and Mangawhai/Tara have not yet fully recovered, but the trend is now heading in the right direction.
Outlook
July - September:
The long-range forecast from July to September is for near normal rainfall for Northland (NIWA, MetService).
MetService long range forecast
| Rainfall (% above/below normal) | Aug-20 | Sep-20 | Oct-20 |
| Whāngarei |
5% |
-3% | -9% |
NIWA Temperature, Rainfall, Soil Moisture and River Flows probabilities for July to September 2020
| Temperature | Rainfall | Soil moisture | River flows | |
| Above average | 45• | 30 | 25 | 25 |
| Near average | 40 | 45• | 45• | 45• |
| Below average | 15 | 25 | 30 | 30 |
Rainfall
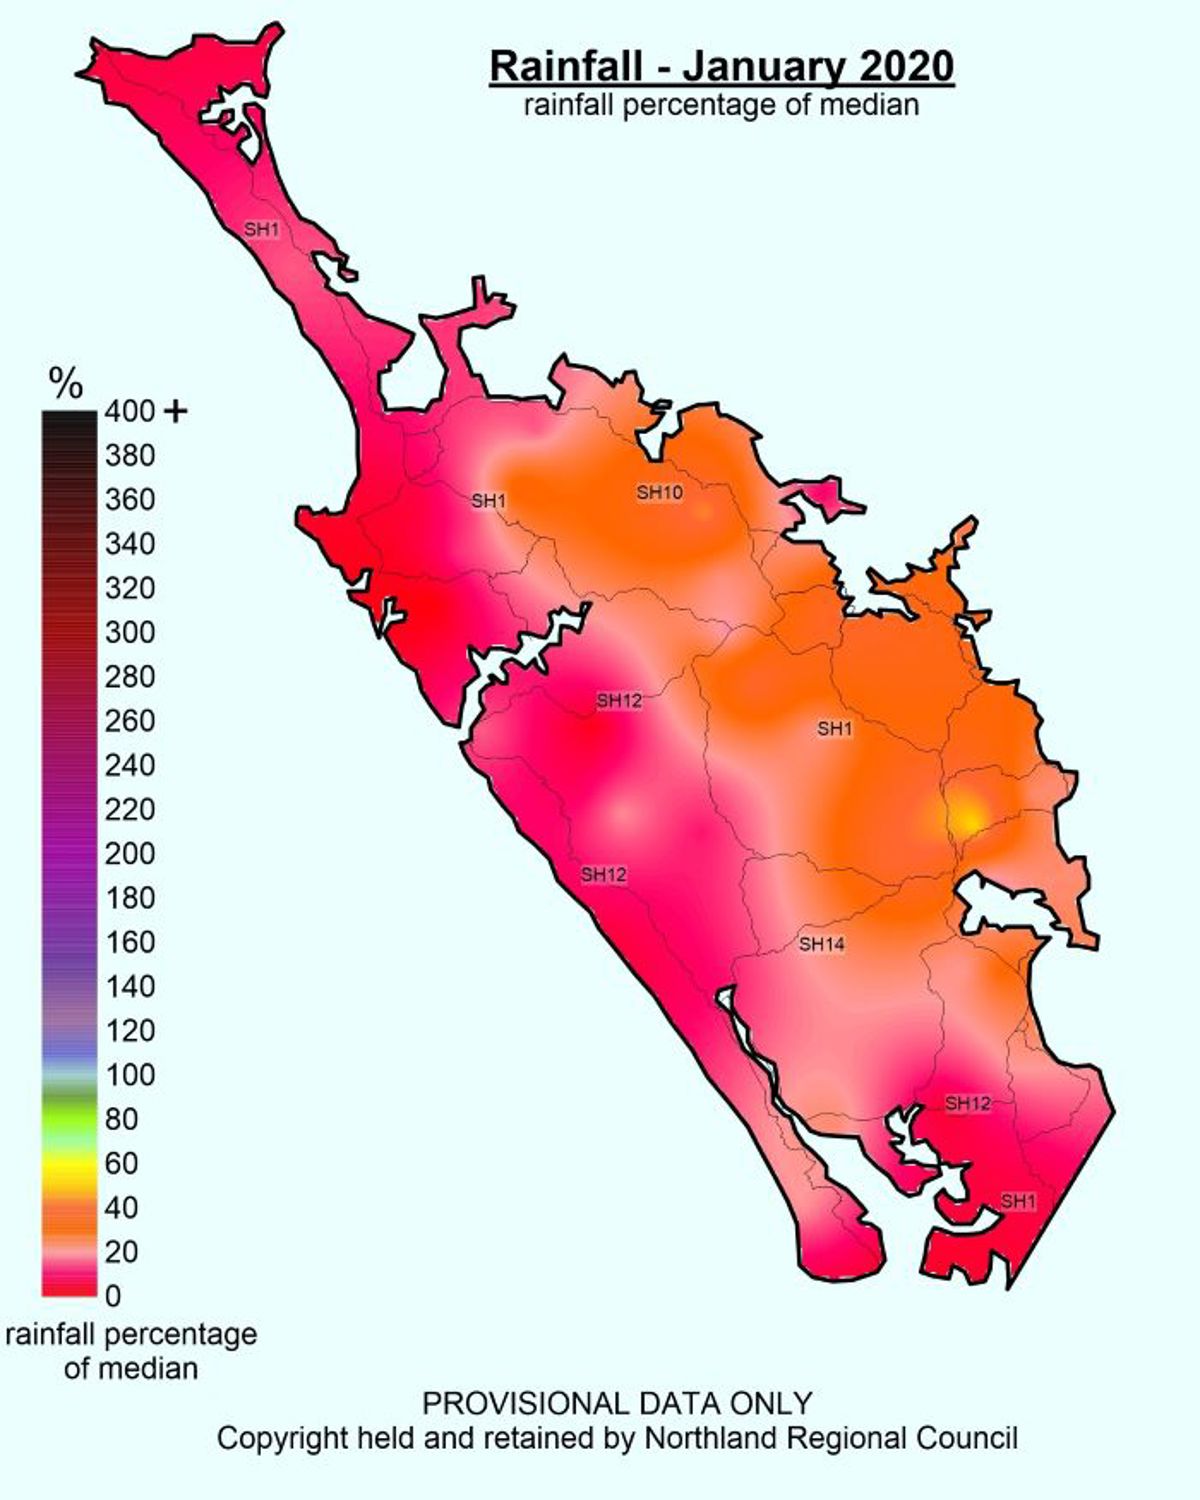
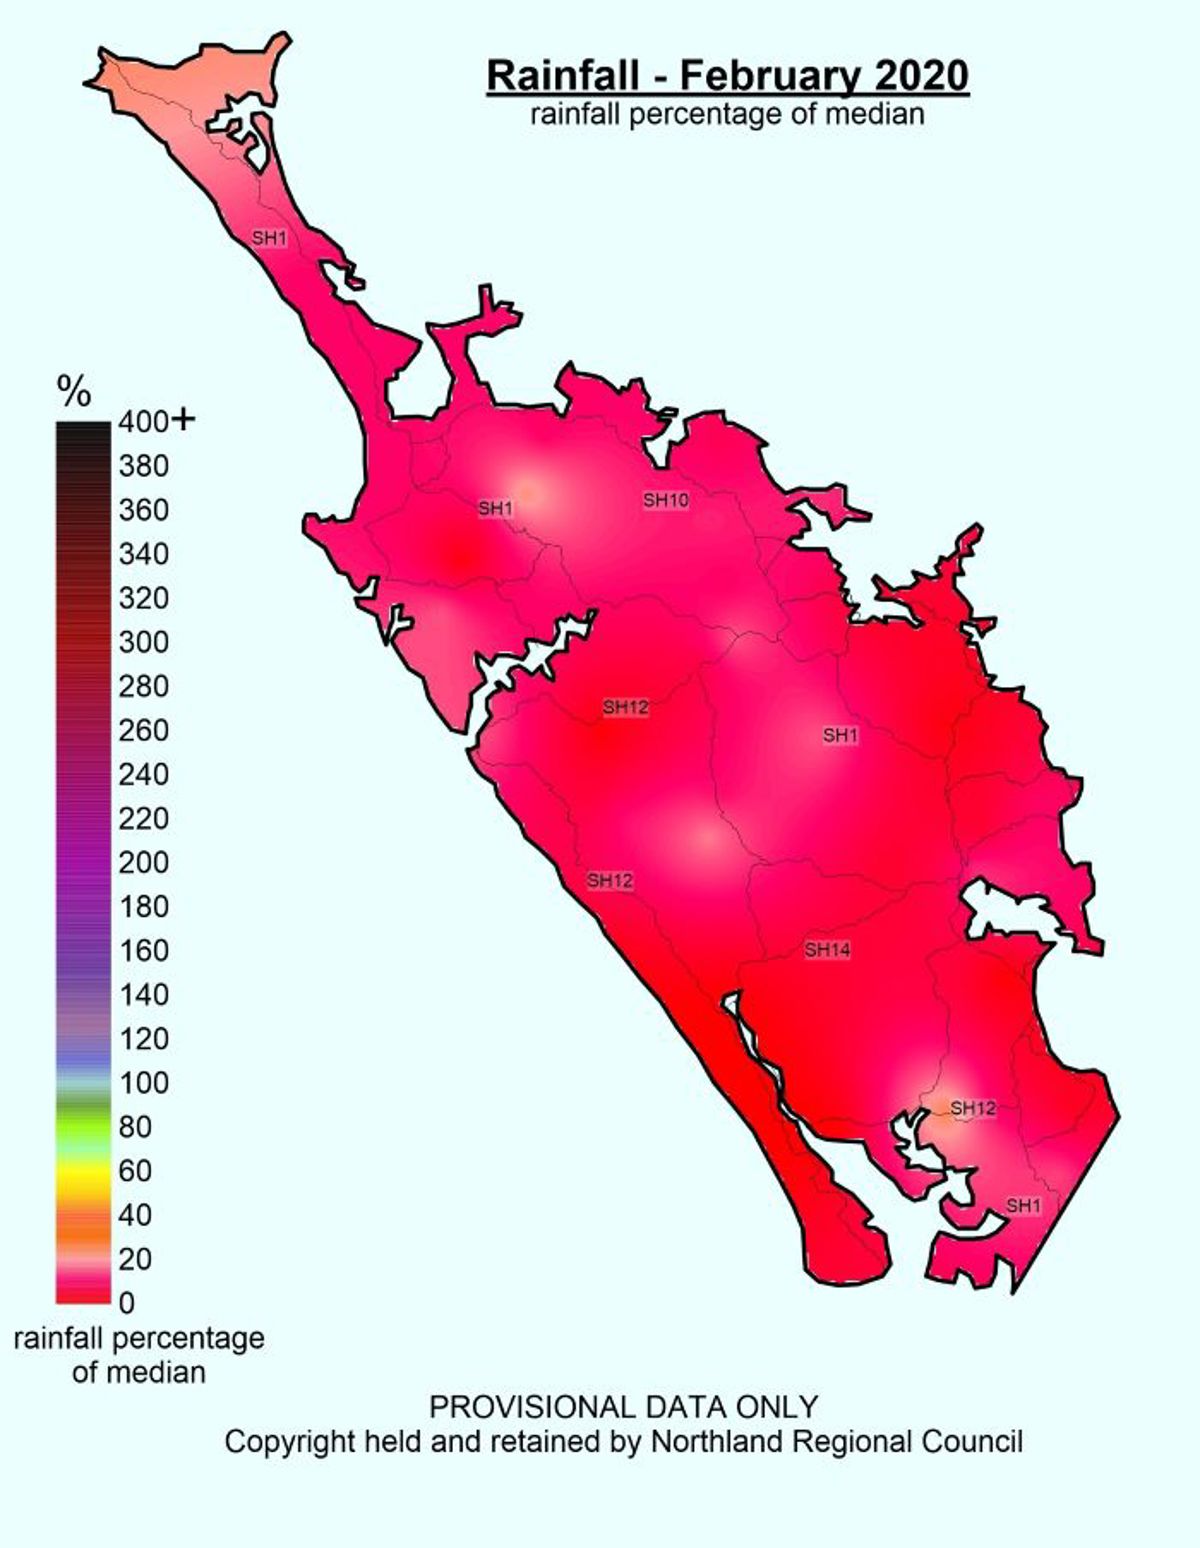
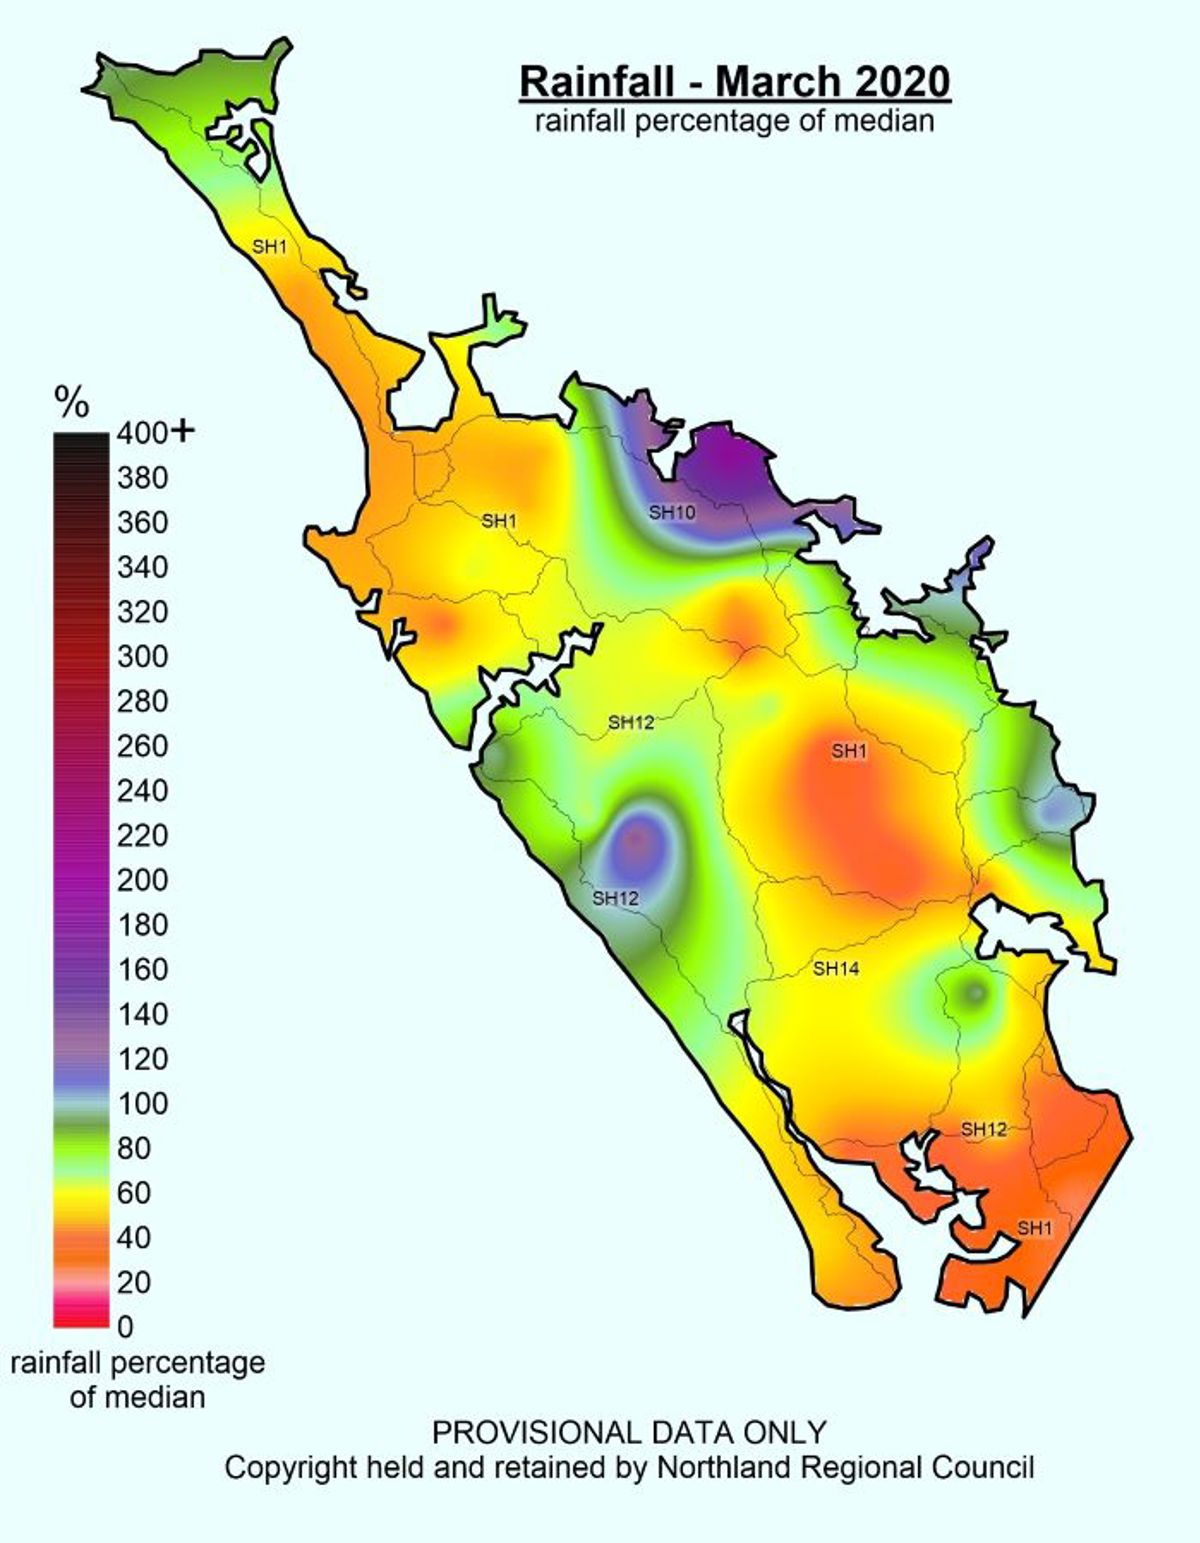
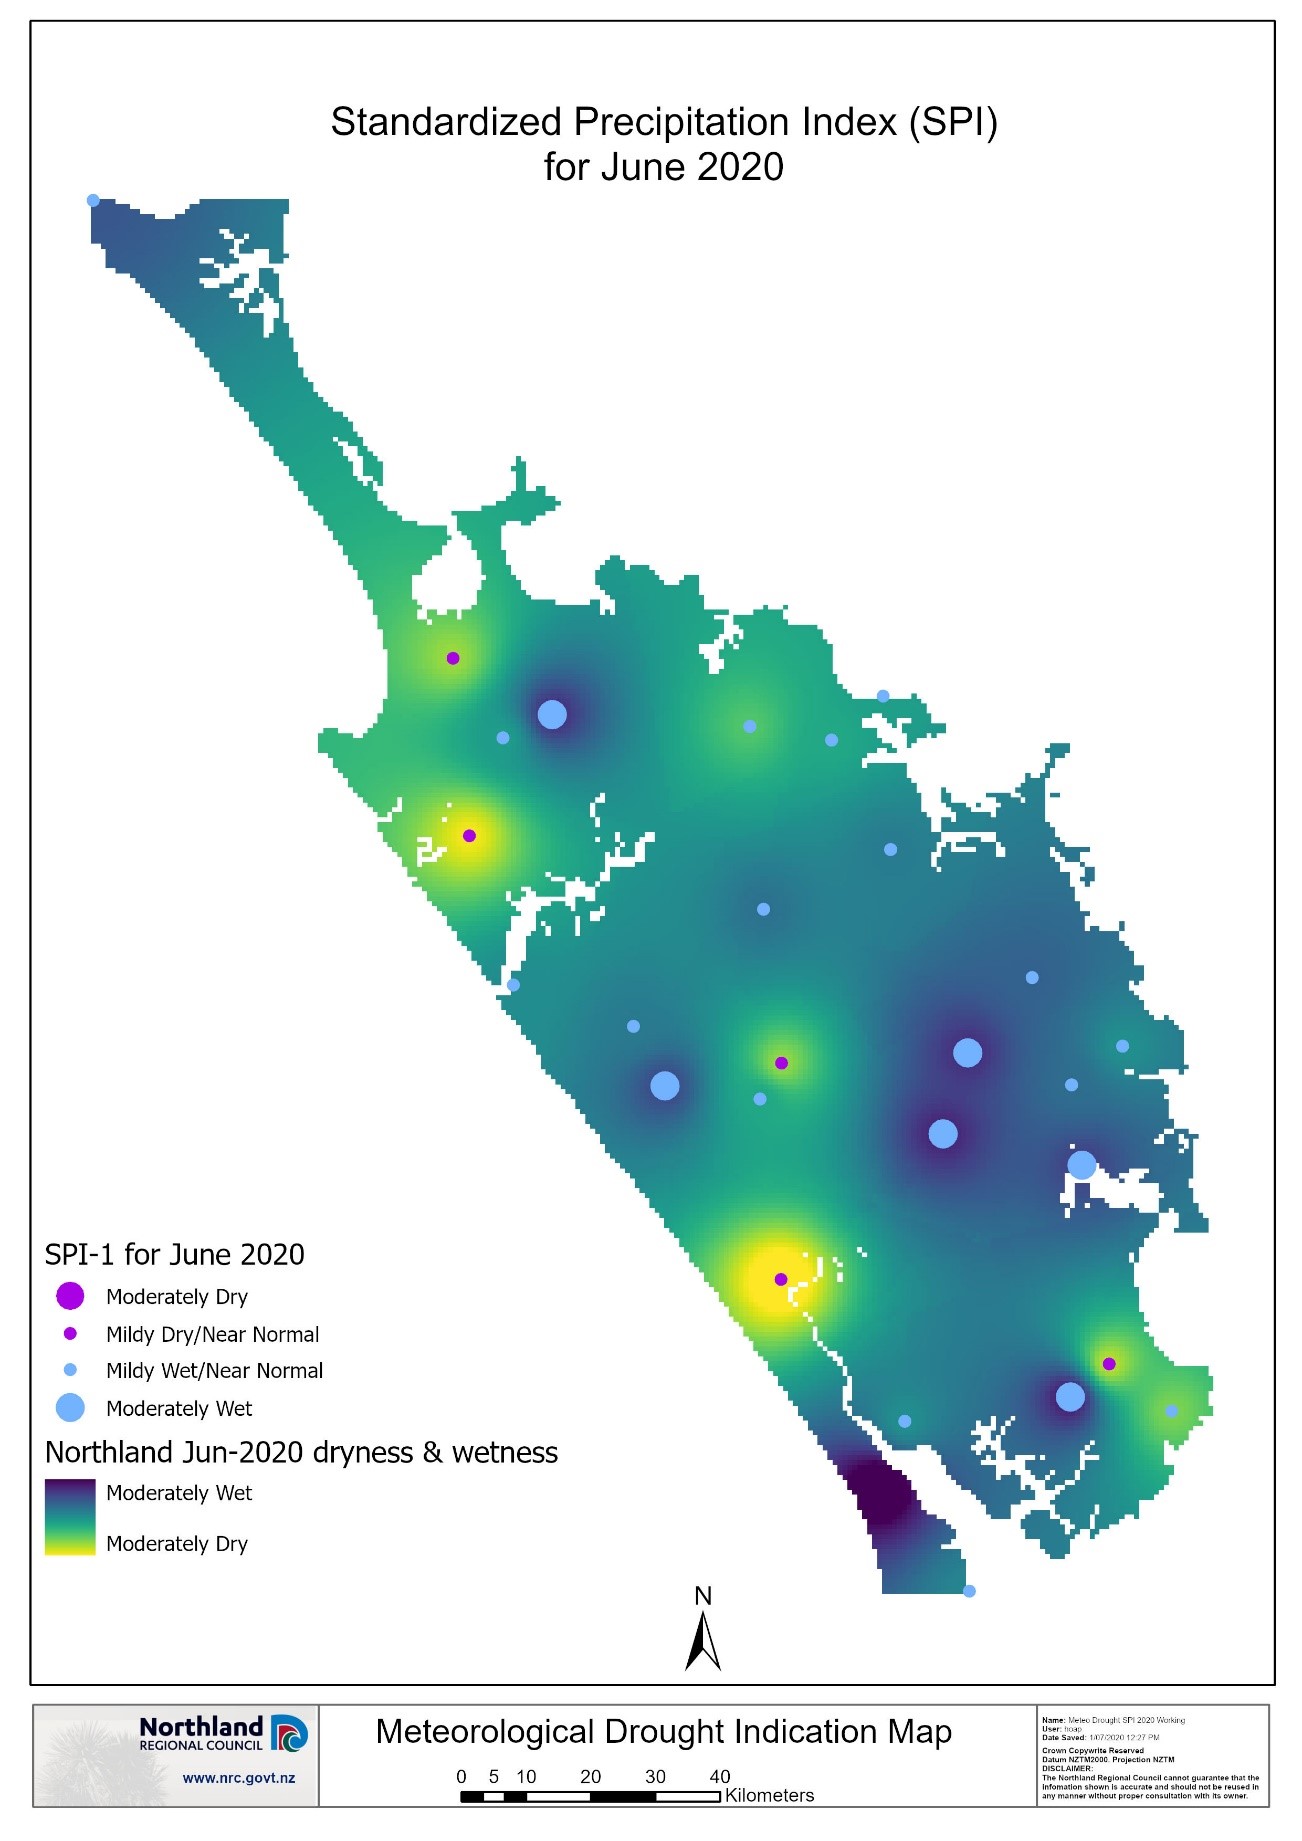
June 2020 was a wet month for Northland and the second wet month in a row for the east coast. The Awanui catchment, Bay of Islands catchments, eastern hills catchments, Whangarei catchments and northern Kaipara catchments all received normal or above normal rainfall. All other locations received near normal rainfall. The NRC SPI index for the month shows that the region was near normal to moderately wet for the month.
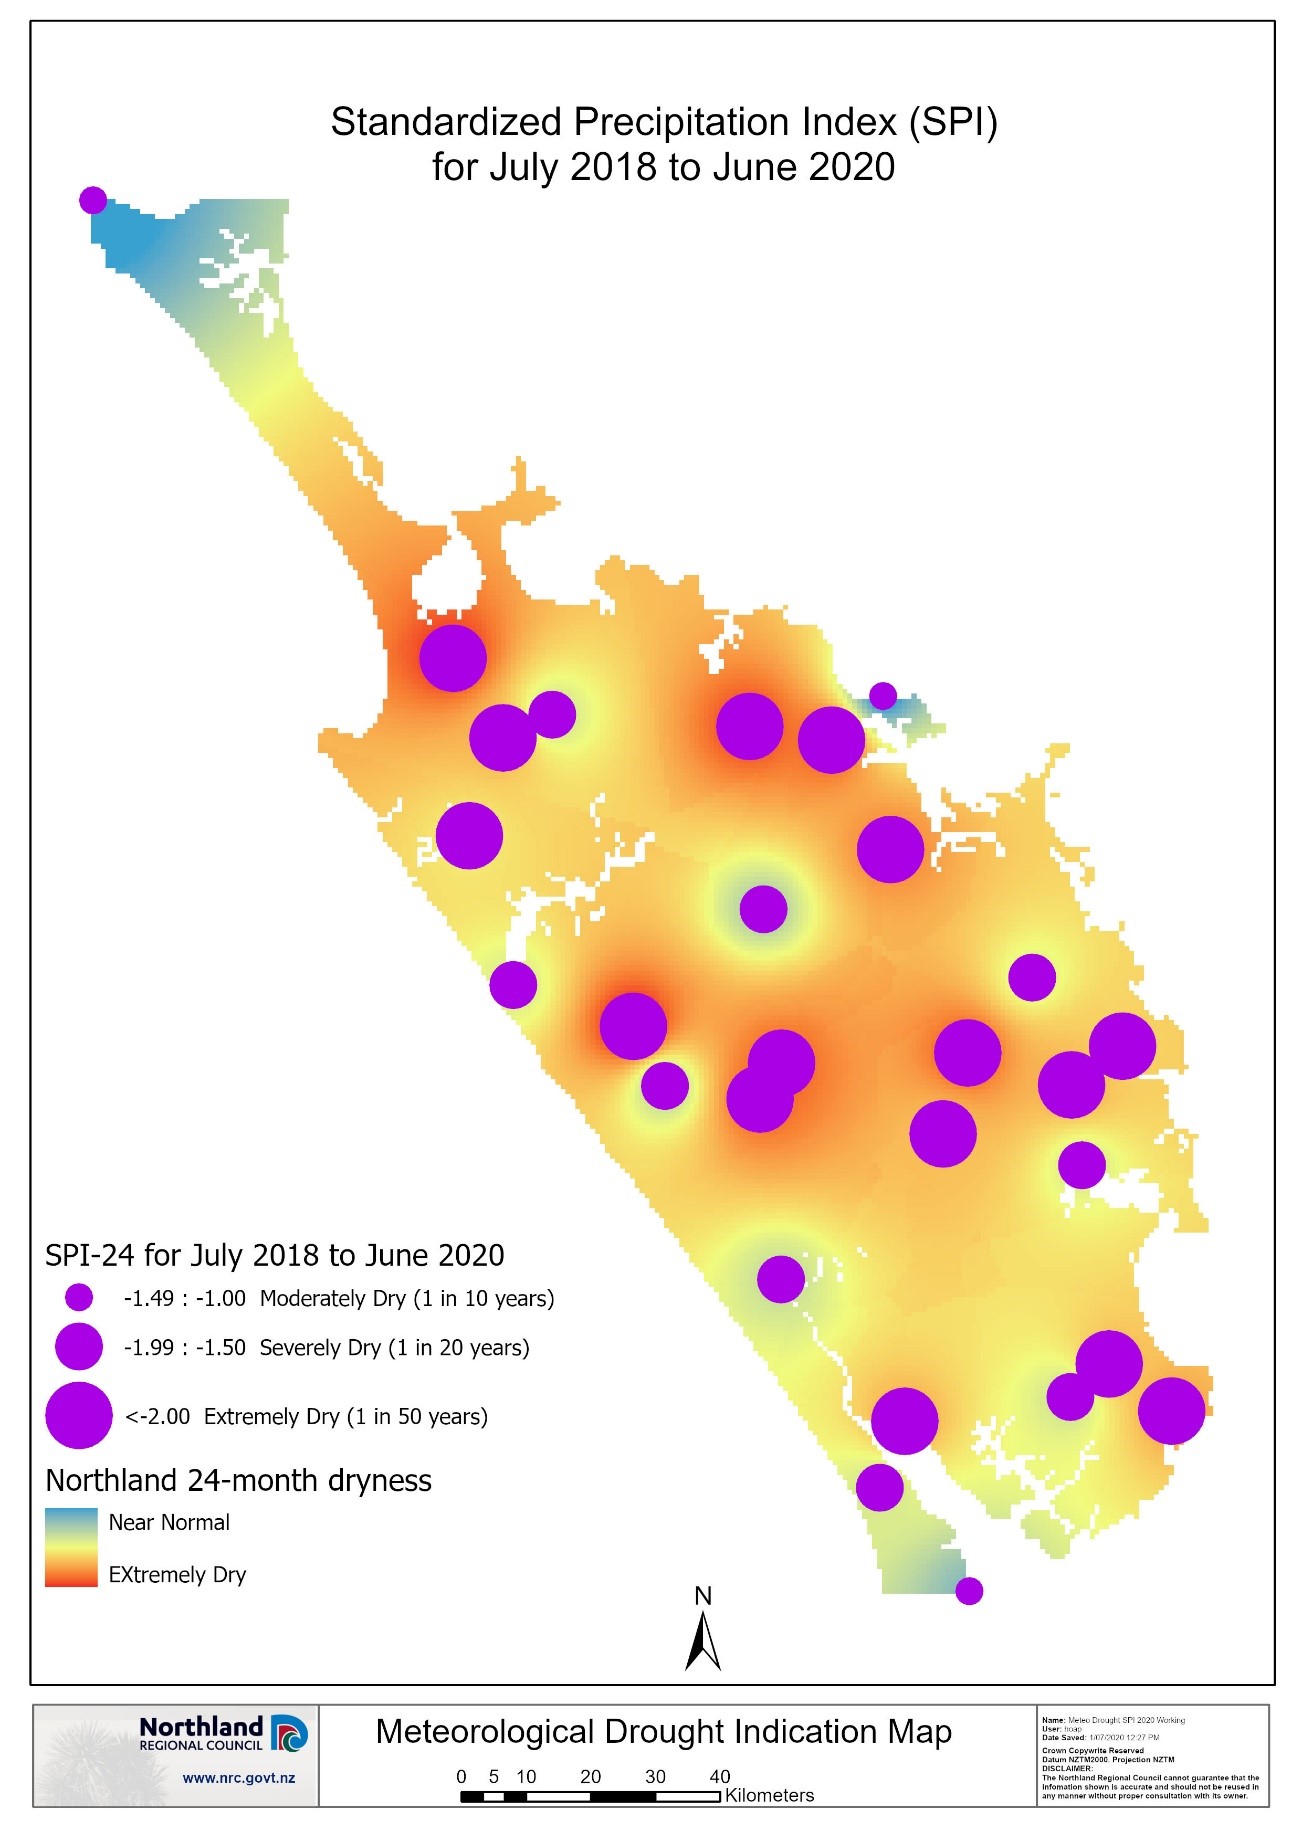
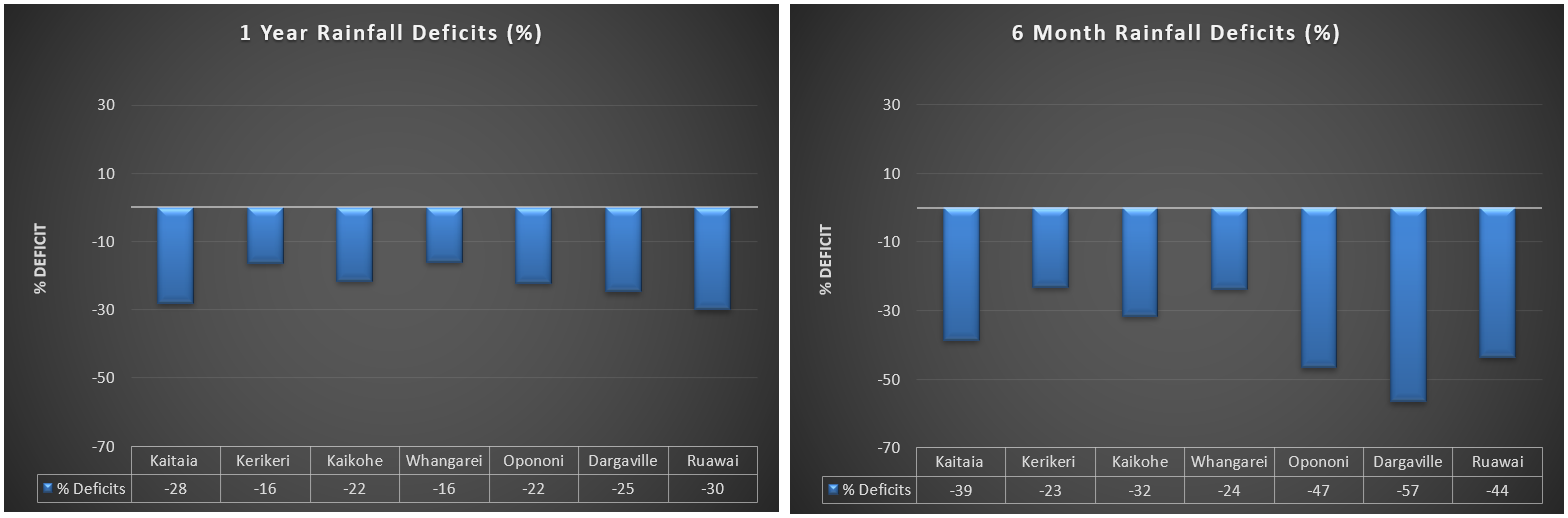
The long-term rainfall numbers show that Northland still retains a rainfall deficit over the 12 and 6-month periods. The west coast has the highest deficit over the 6-month period, as this area benefits a lot less from north-westerly systems that have been typical recently.
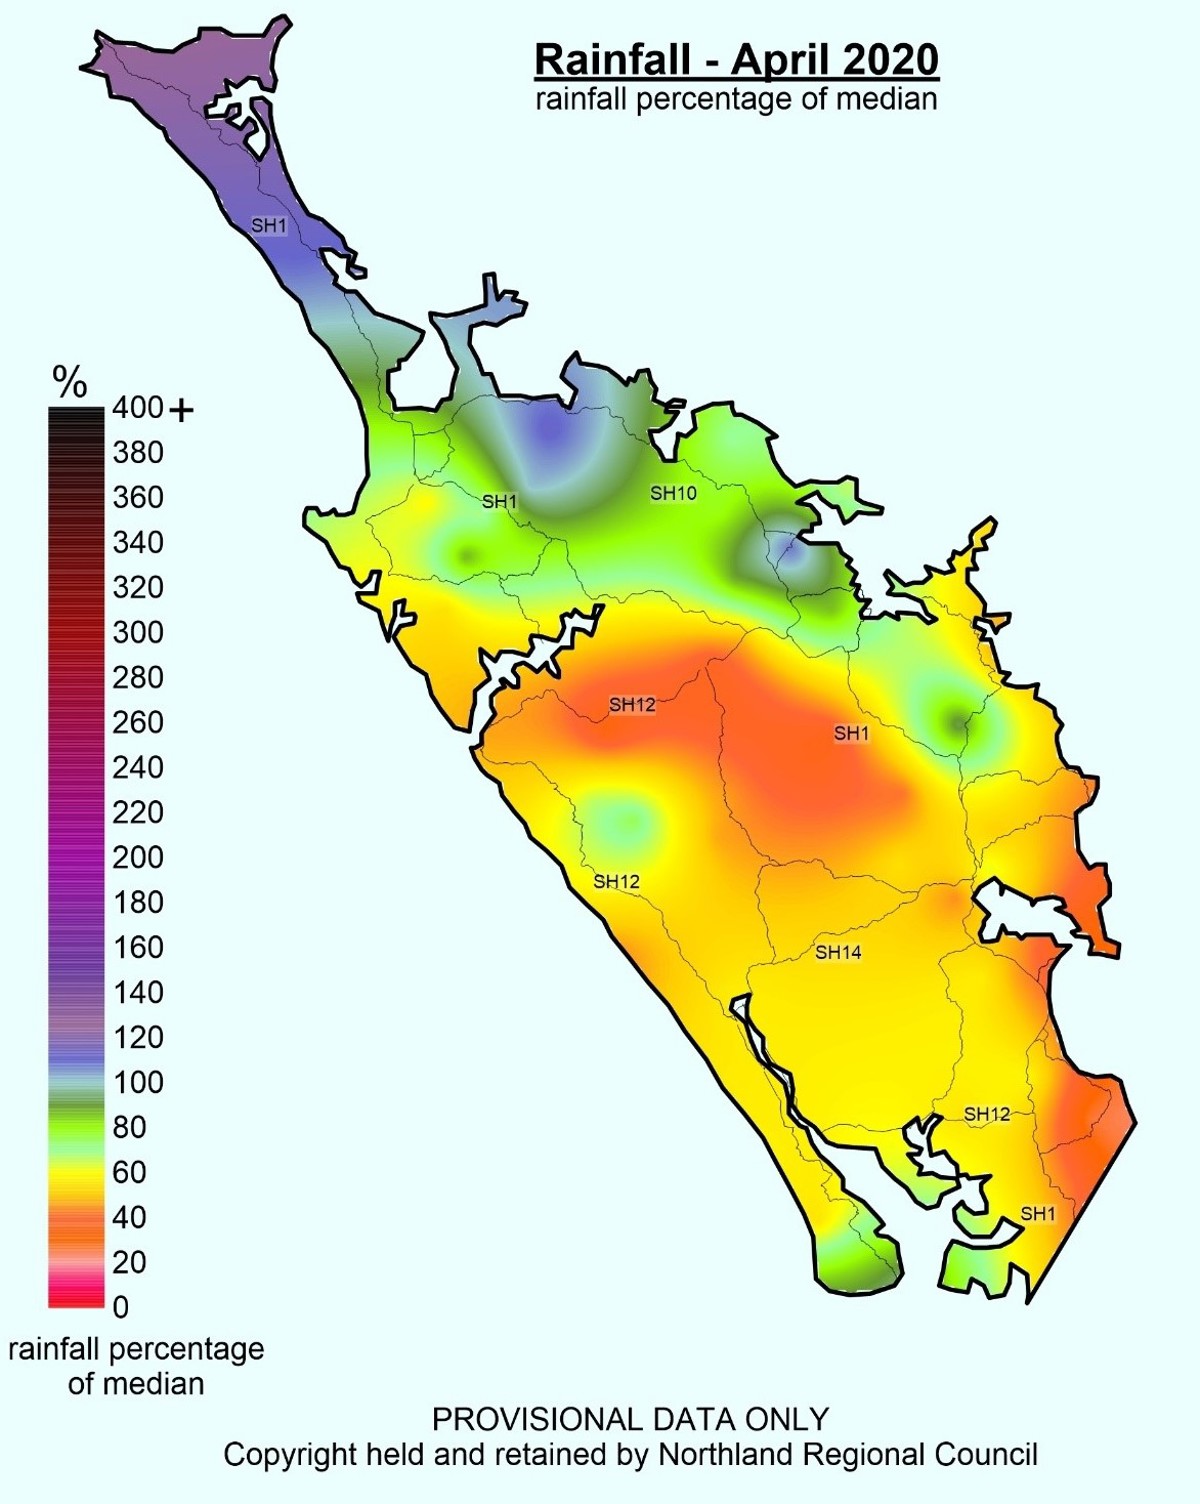
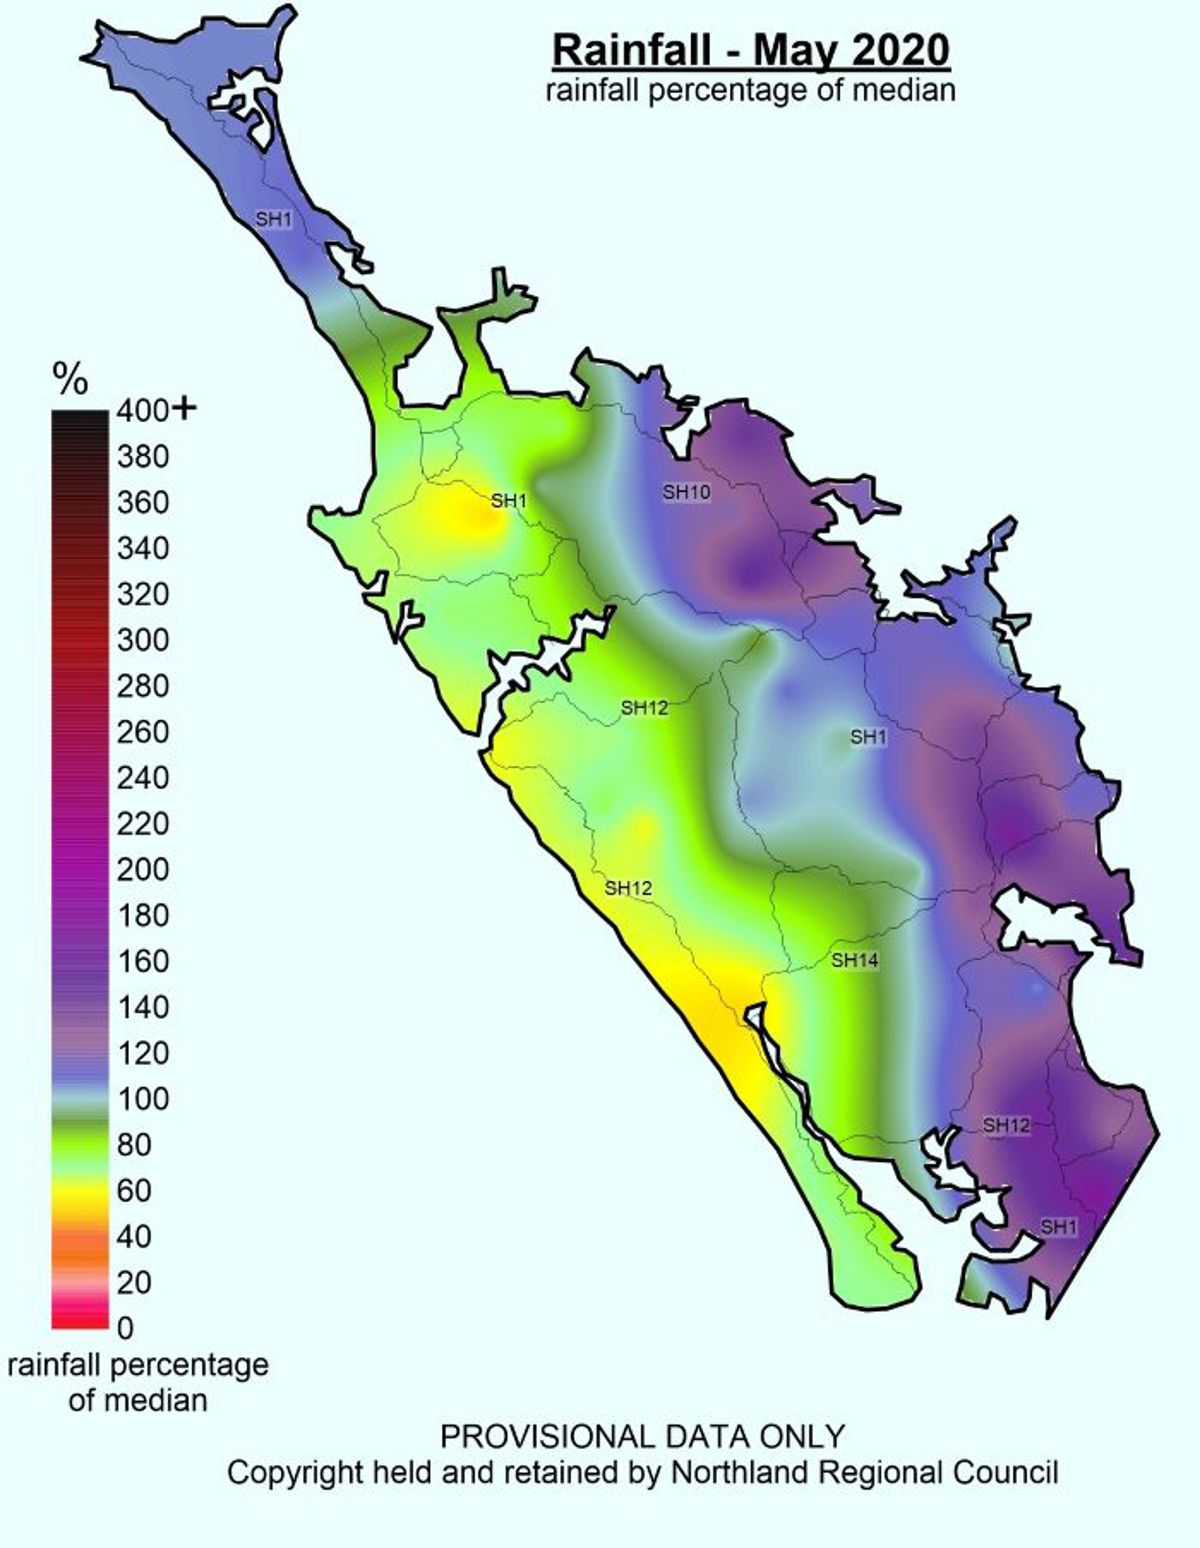
Rainfall % median map for Jan 2020 to June 2020


SPI Index map for the dry period, July 2018 to June 2020 and for the most recent month June 2020
One year and six-month rainfall deficit percentage values
River flow
River flows have recovered well with rainfall throughout June. The rainfall event at the end of May/beginning of June increased base flows at all rivers, and the subsequent consistent showers and fronts associated with low pressure systems on 25 – 26 June, have kept river flows up. All flow stations recorded above typical flows for the month.
Flow Map June 2020
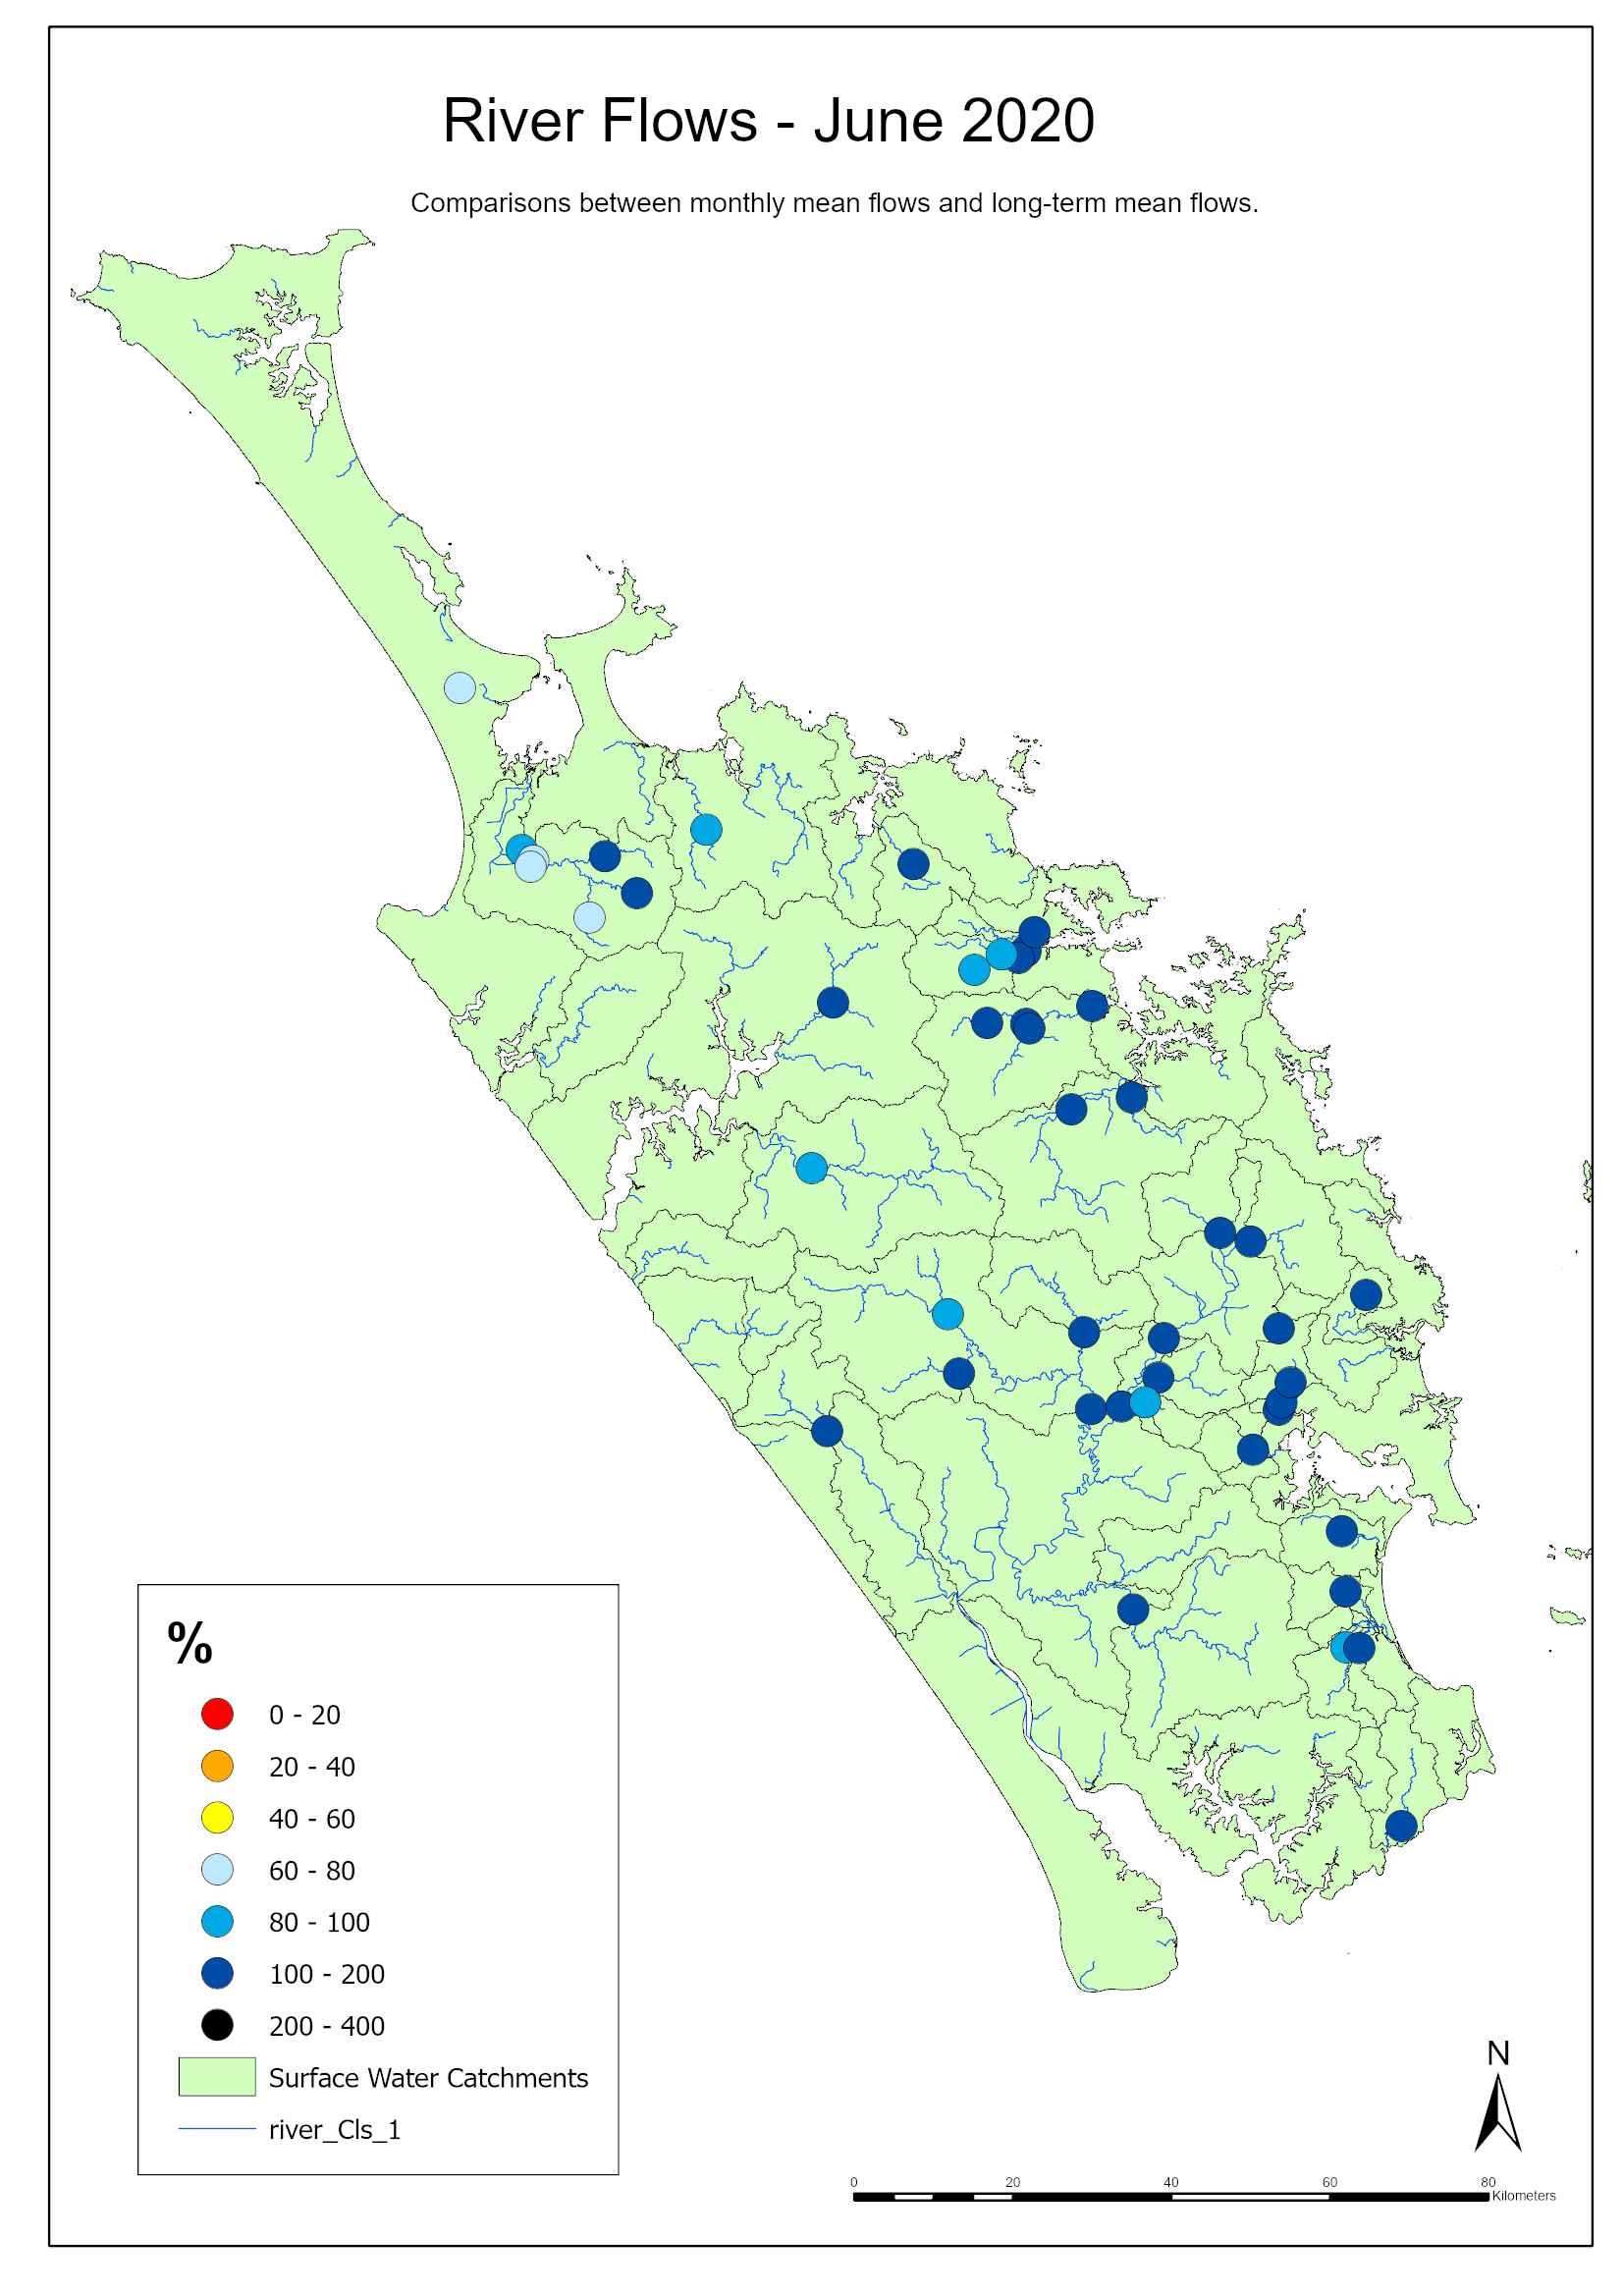
Current (07/07/2020) River Flows relative to Mean Annual Low Flow (MALF) and 1:5 year low flows (DMF)

Groundwater
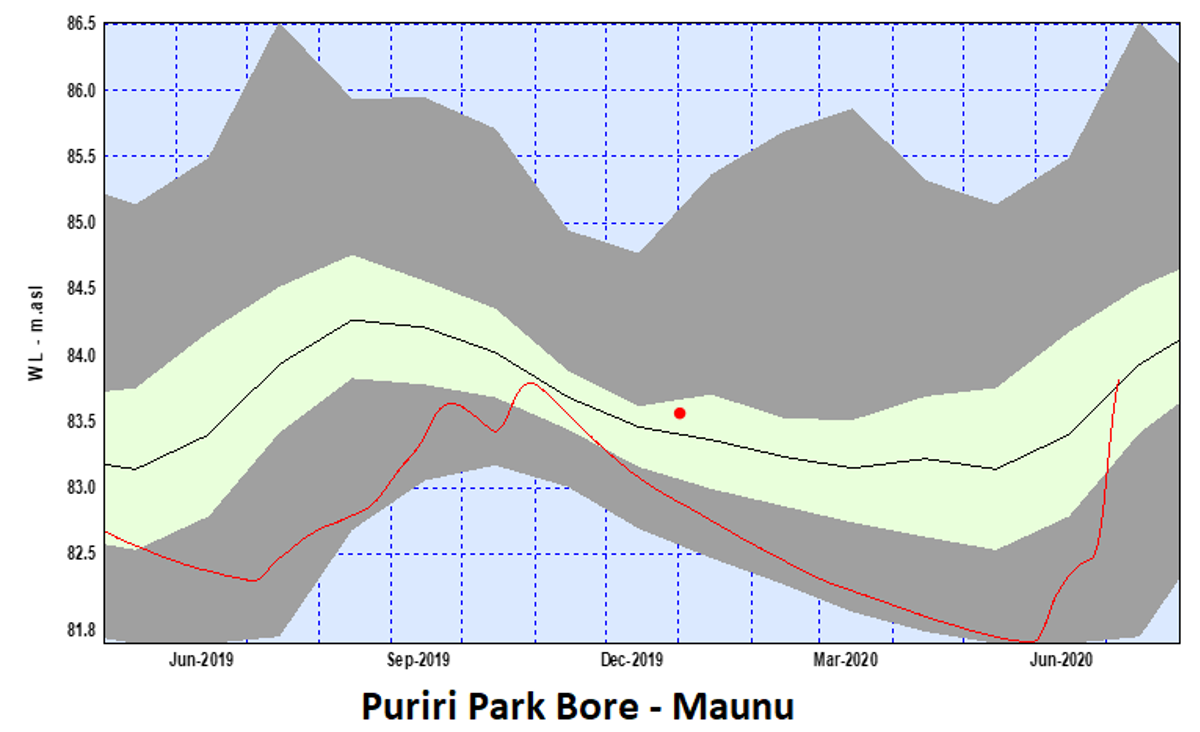
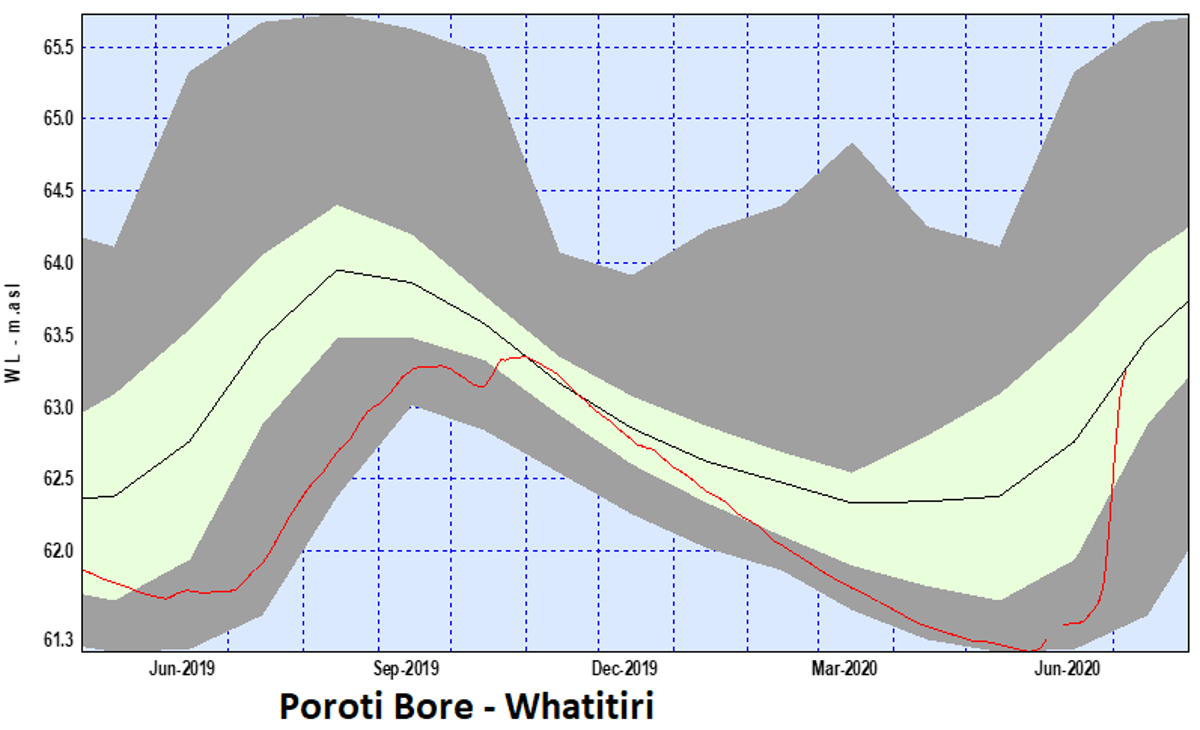
Water level readings indicate that Russell, Taipa/Coopers Beach and Mangawhai/Tara are below average for June 2020. Puriri Park (Whangarei), Poroti and Ruawai all appear to have recovered well with levels now typical of this time of year.
|
Groundwater Systems |
Status for June 2020 |
|
Aupouri |
OK |
|
Taipa |
BELOW AVERAGE |
|
Russell |
OK |
|
Kaikohe |
BELOW AVERAGE |
|
Whangārei |
BELOW AVERAGE |
|
Marsden-Ruakaka |
BELOW AVERAGE |
|
Mangawhai |
BELOW AVERAGE |
|
Poroti |
OK |
One-year groundwater trends (red) relative to the long-term average (black) and upper and lower percentiles (bottom grey area denotes 0-20th percentiles)


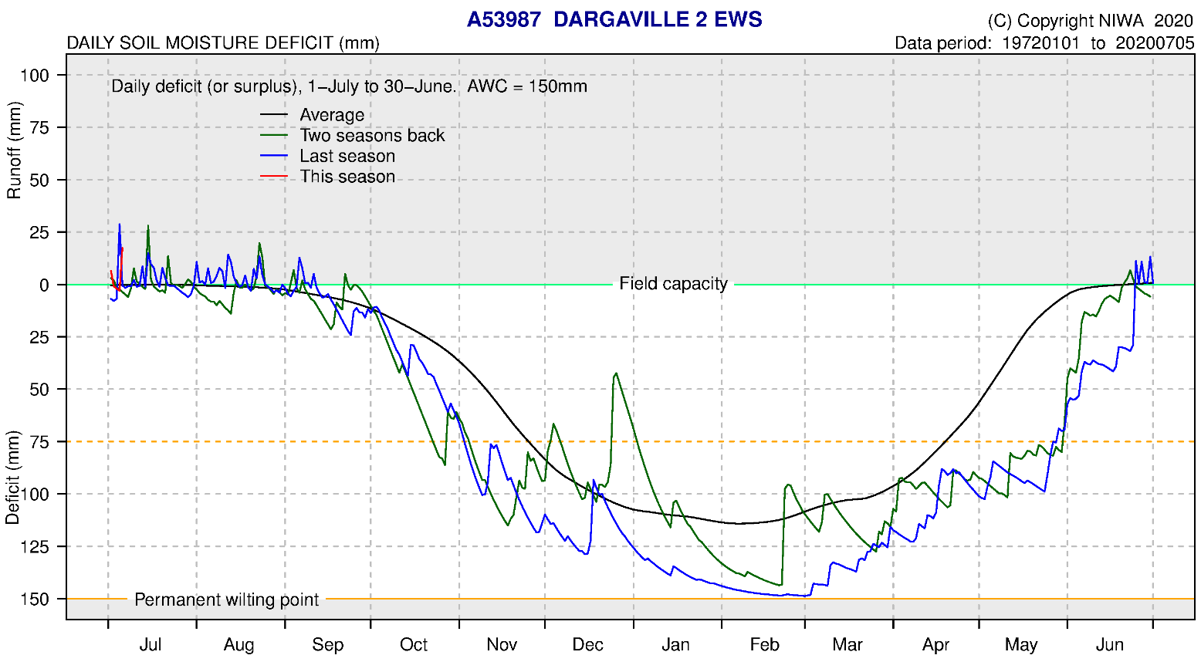
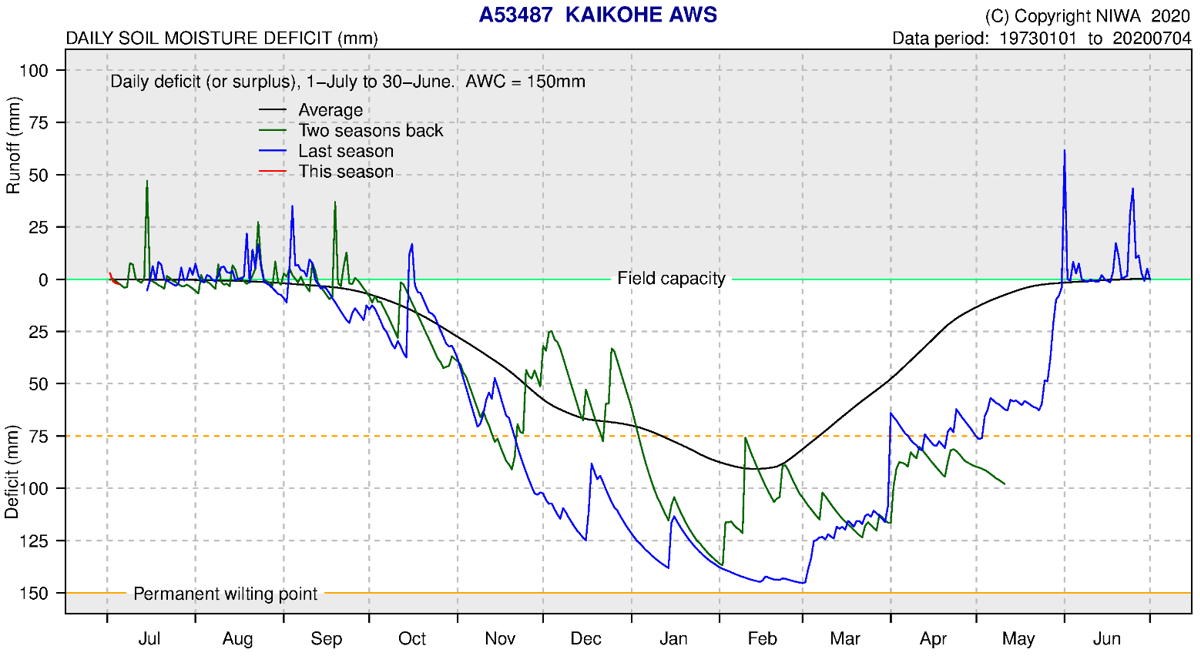
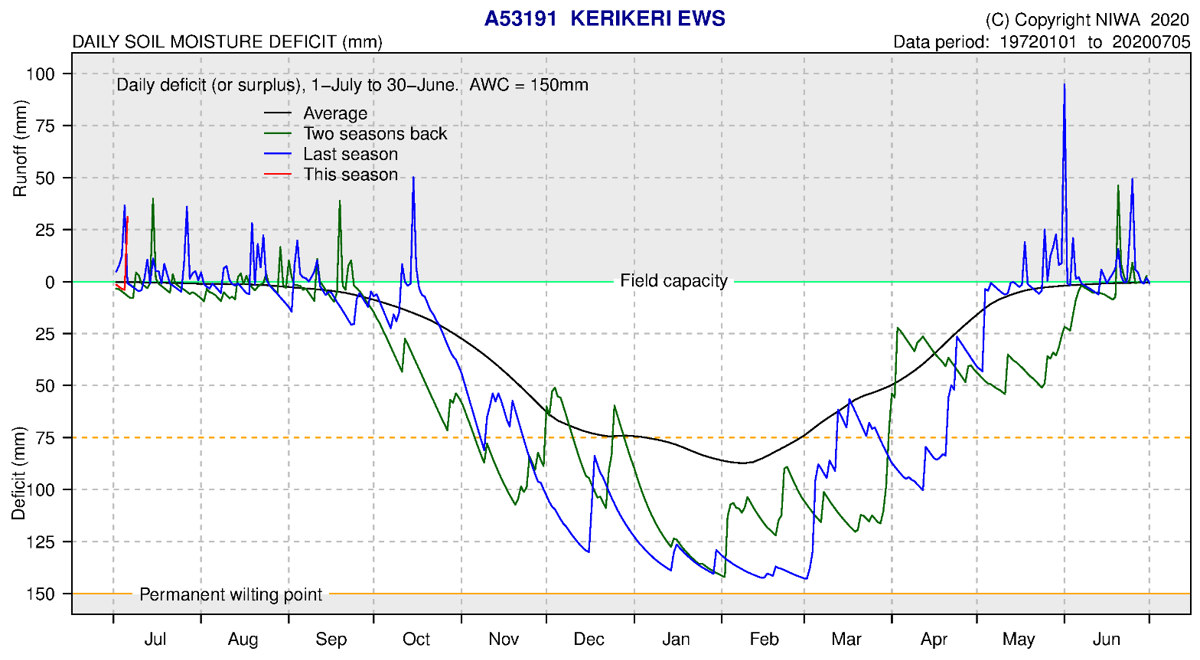
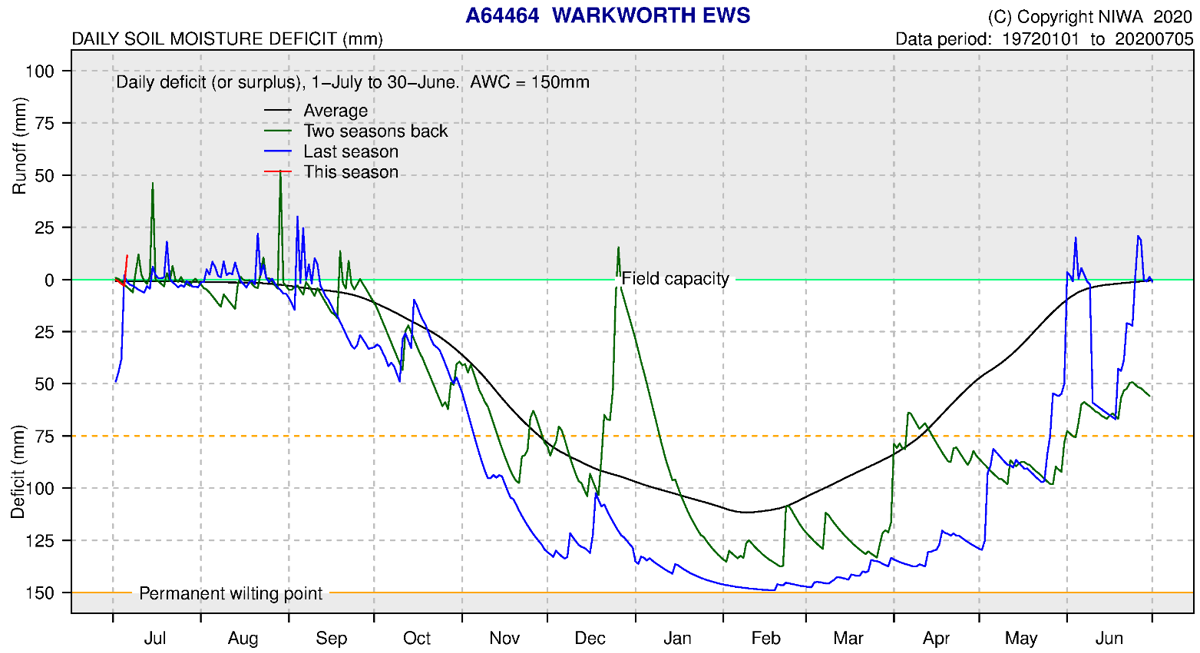
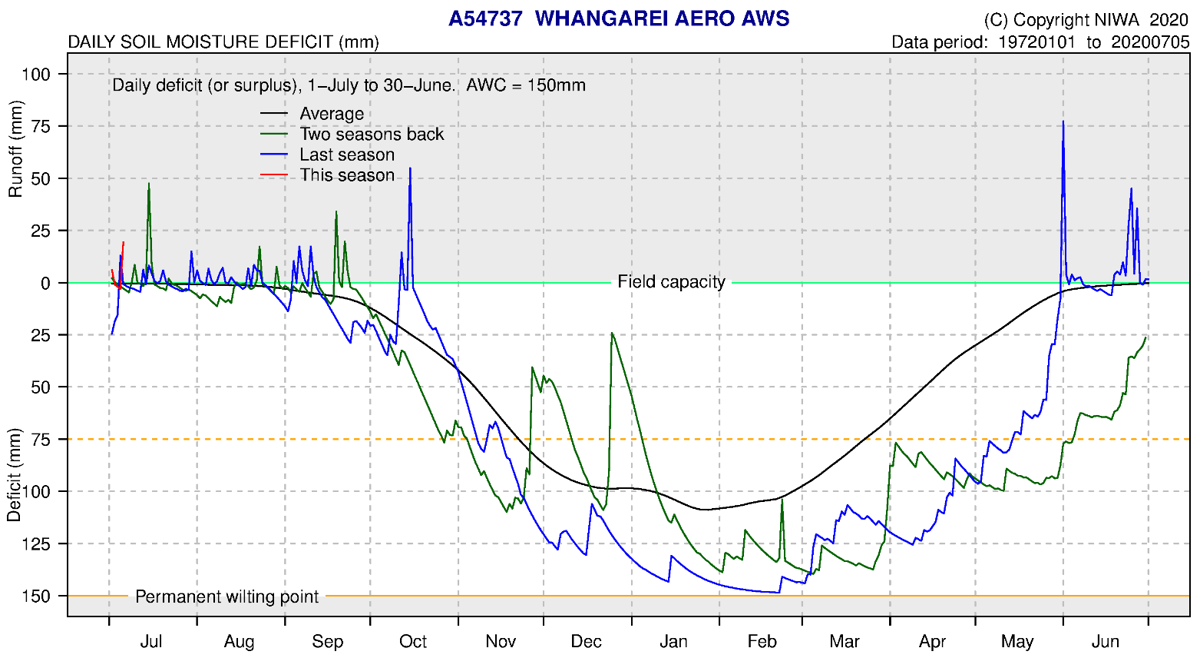
Soil moisture deficits
NIWA water balance modelling indicates soil moisture deficit is at or above field capacity at all NIWA climate stations. This is typical for this time of year. “SMD is calculated based on incoming daily rainfall (mm), outgoing daily potential evapo-transpiration (PET, mm), and a fixed available water capacity (the amount of water in the soil 'reservoir' that plants can use) of 150 mm” (NIWA).
|
NIWA Climate Station |
Observed Soil moisture deficit (mm) as of 07/07/2020 |
Average May soil moisture deficit |
Difference between Expected and Average |
|
Kaitaia |
0-25 mm |
0 mm |
0 |
|
Kerikeri |
0-25 mm |
0 mm |
0 |
| Whangārei |
0-25 mm |
0 mm |
0 |
|
Kaikohe |
0-25 mm |
0 mm |
0 |
|
Dargaville |
0-25 mm |
0 mm |
0 |
|
Warkworth |
0-25 mm |
0 mm |
0 |