July 2020 climate report
31 Aug 2020, 12:00 PM
Summary
The wet weather during June and July, including one particularly intense weather system on from 15 to 18 July, has well and truly recovered river flows across Northland, has increased most aquifer levels to near normal conditions and has gone a long way to alleviating the long period rainfall deficit.
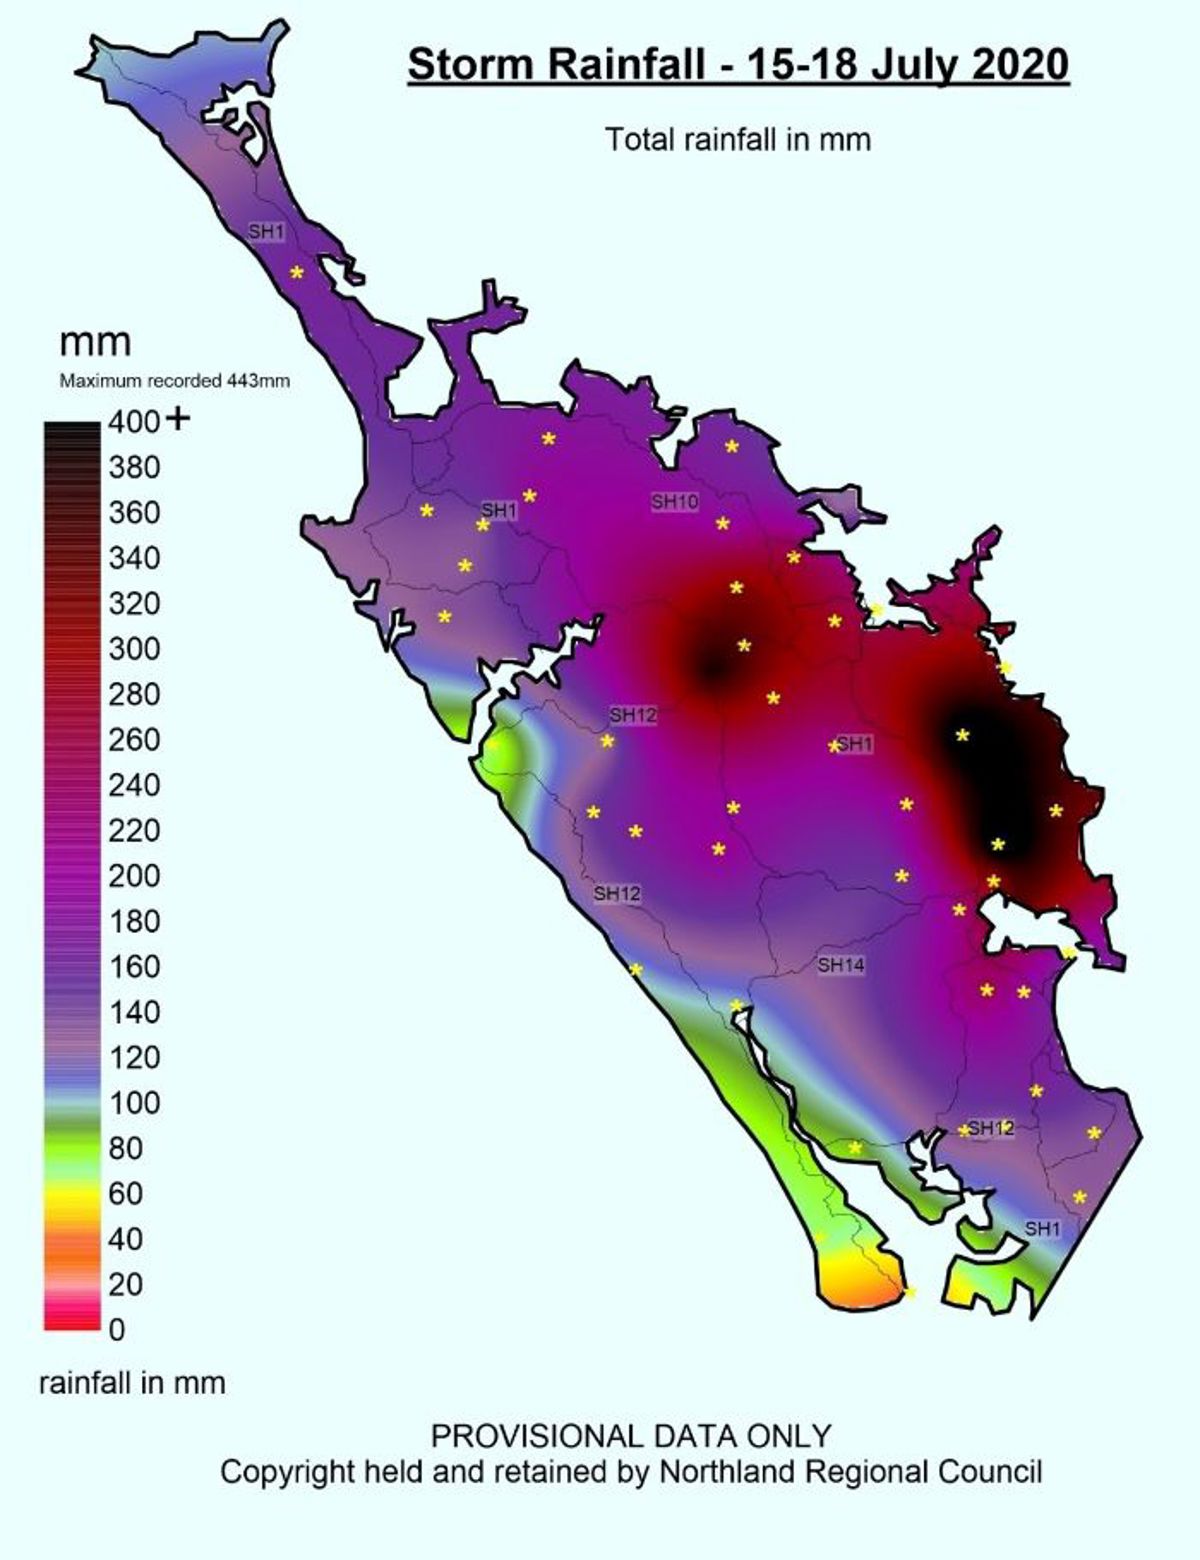
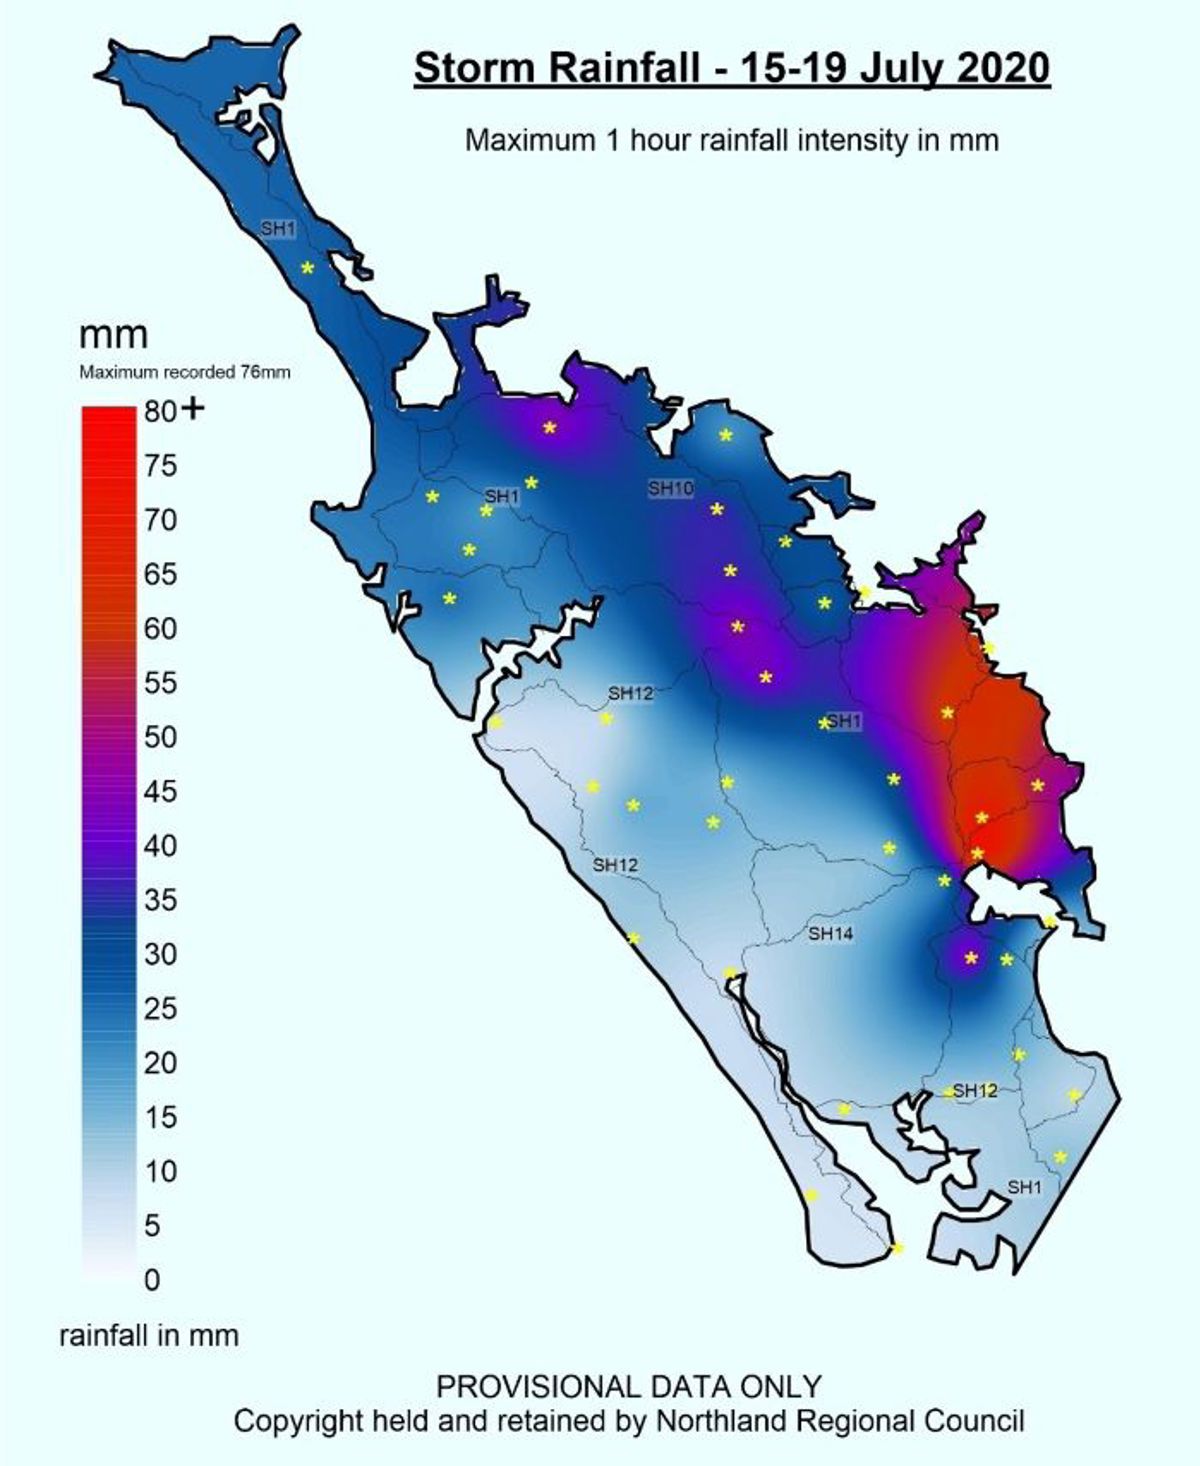
The significant weather event between the 15 and 18 July shaped the month as a very wet one. This began as a moderate event on 15 and 16 July with flooding around Kaeo, Taipā and Waimate North Road. This was followed by a day of little rain for the remainder of 16 July, then a long series of intense storm cells from early morning on 17 July until midday on 18 July. These storm cells began in the already saturated and elevated Waitangi catchment with periods of intense rain up to 45mm per hour from 4am to 3pm, causing the second highest flows in the Waitangi River since 1979. Widespread rain then began spreading throughout the region and recurring storm cells became more focused around Whangārei, with some extremely intense short period rainfall in Whangārei, and the Northern catchments of Whangārei Harbour (~1:100 year rainfall). This led to the highest recorded flows in the Hātea river since 1986 and the Waiarohia River since 1979.
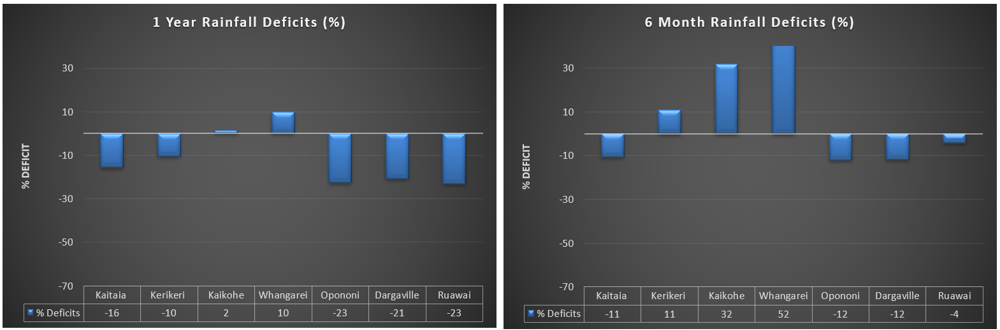
Rainfall deficits over a 6-month period are now only slightly below normal (below zero) for Kaitaia, and the West Coast (~11% deficit) and above normal for Kerikeri, Kaikohe and Whangārei, meaning that these areas have received more rainfall over the last 6 months than is typical for this period. There remains a moderate rainfall deficit over the 12-month period for the West Coast (~20%), which indicates that river and groundwater systems in these areas may reach lower levels earlier than typically observed in summer.
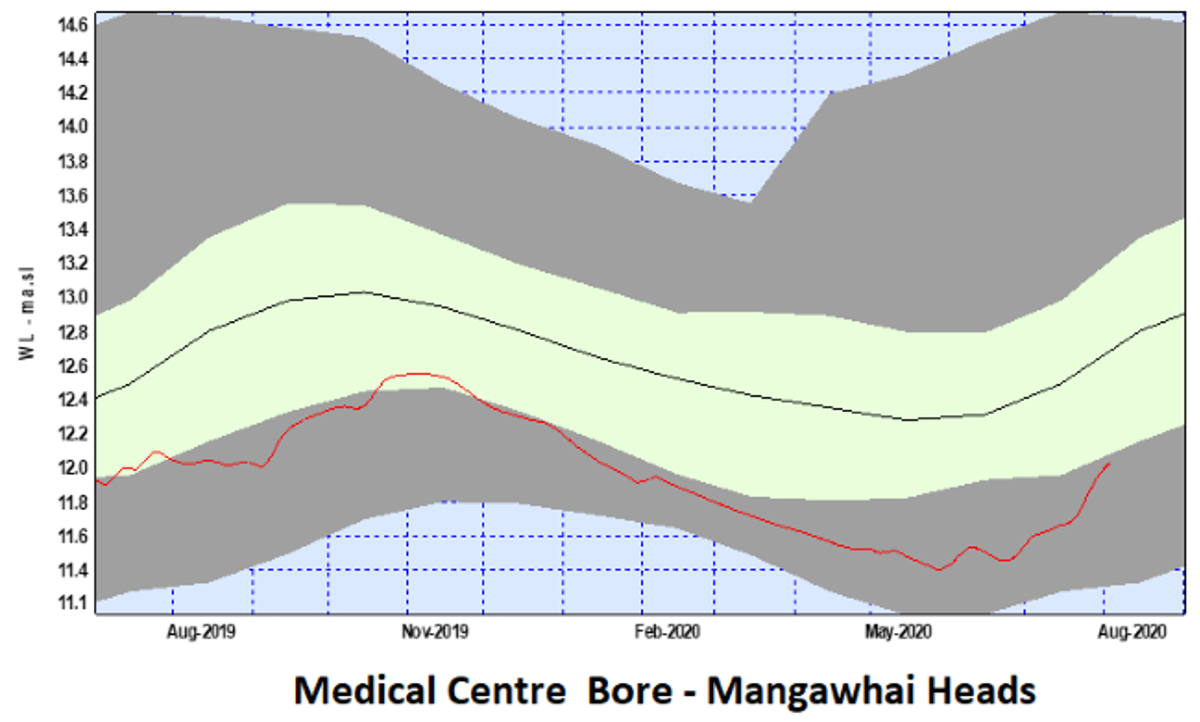
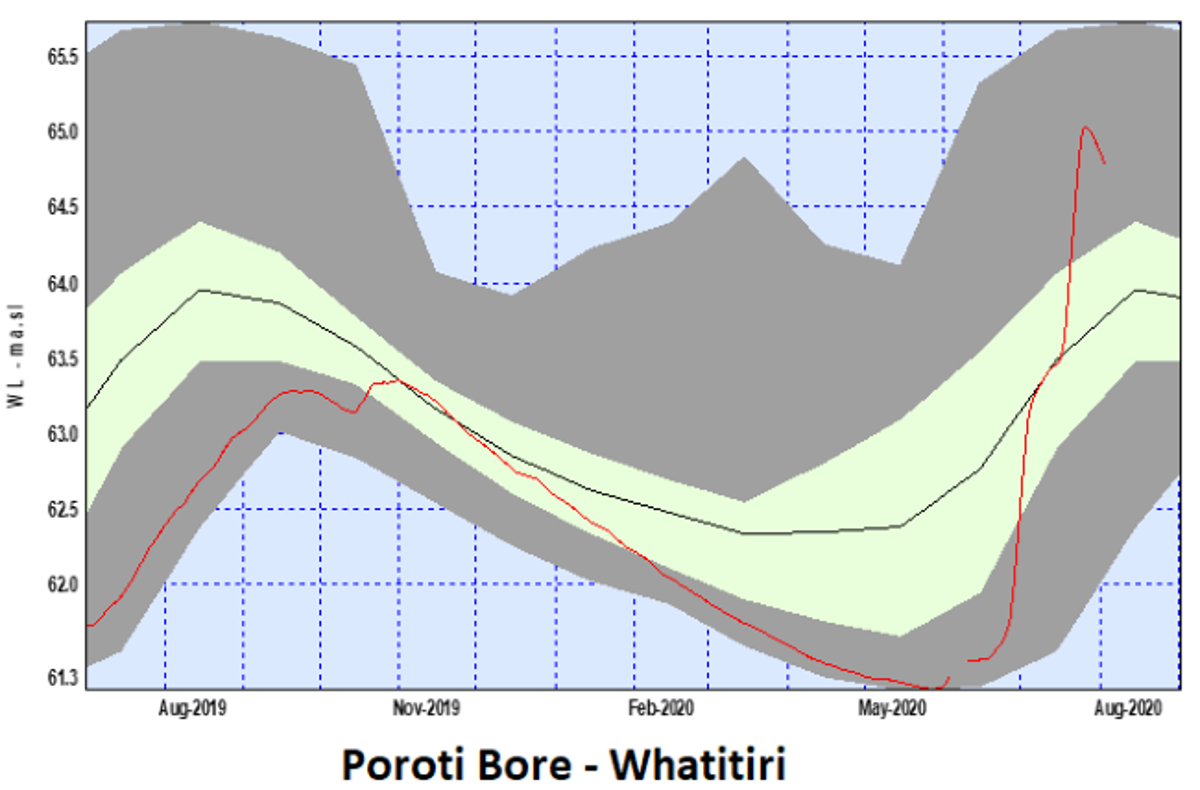
Groundwater levels have recovered well in most areas, with only Mangawhai levels remaining a bit below typical for this time of year.
Outlook
August - October
The long-range forecast from August to October is for near normal rainfall for Northland. The potential for the development of La Niña conditions over the next three months remains, and if it does develop, then the occurrence of rain bringing north-easterly winds could continue being frequent, as they have been since June (NIWA).
NIWA Temperature, Rainfall, Soil Moisture and River Flows probabilities for August to October 2020
| Temperature | Rainfall | Soil moisture | River flows | |
| Above average | 60• | 35 | 20 | 30 |
| Near average | 30 | 40• | 45• | 40• |
| Below average | 10 | 25 | 35 | 30 |
Rainfall
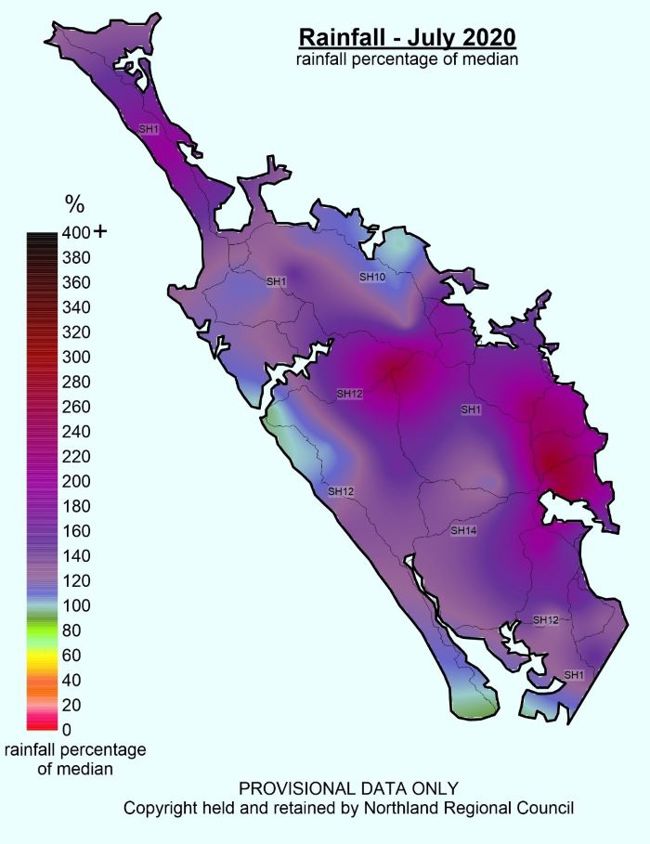
July 2020 was another wet month for the region, with all areas near or exceeding the long-term median rainfall for this month, and some areas exceeding the long-term median by a long shot. The wettest areas for the month were those that received the most rain over the 15 to 18 July weather event, particularly north of Whangārei Harbour and the Eastern Hills, with another hard-hit area around Kaikohe / inland of the Bay of Islands.
- 60mm in 30 minutes falling the North Regional Council Glenbervie Forest rain gauge (1:100 year rainfall)
- 50.6mm in 30 minutes at the North Regional Council Water Street rain gauge (1:100 year rainfall). This led to significant flooding in the Whangārei township, the highest recorded flows in the Hātea river since 1986, the Waiarohia River since 1979 and what would have been the highest recorded flow in the Raumanga River had the Hopua te Nihotetea Detention Dam not throttled back the flows.
- Rain Gauges in the Waitangi, Kerikeri, Kaeo, Mangakahia, Otiria, Whakapara and Bream Bay catchments received rainfall in the order of 1:10 to 1:50 year rainfall events.
- Most of the region got off much lighter than these hard-hit areas, with much of the west coast receiving rainfall in the order of a common annual event and in the Awanui Catchment a 1:5 year rainfall event.
- Close to 280% of typical July rainfall fell in Kaikohe, the Hātea catchment and Whangārei township.
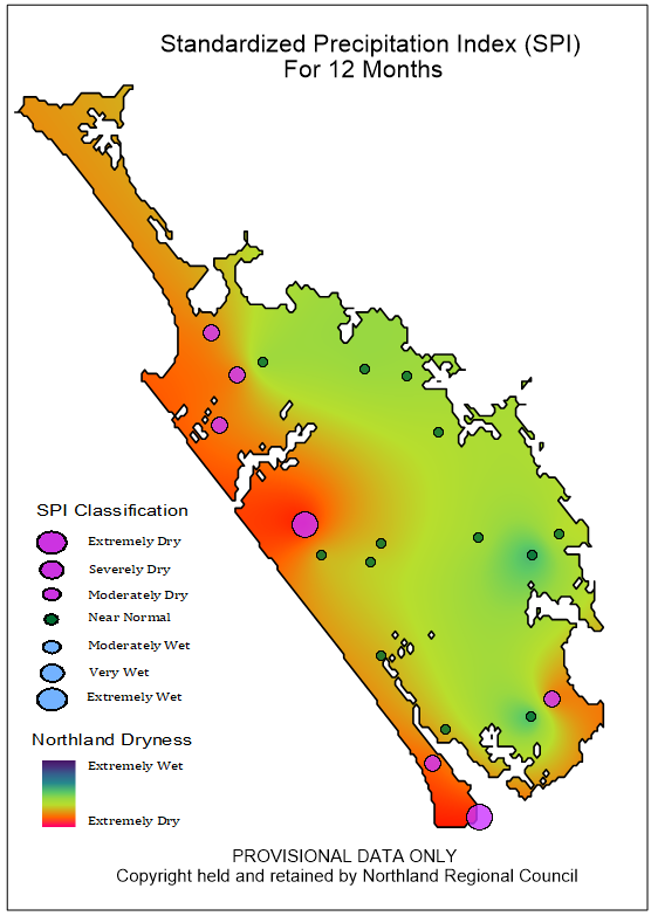
The long term (12 month) rainfall deficit that had been accumulating in Northland since July 2018 has now been alleviated in Kaikohe and Whangārei and lessened significantly in Kaitaia and Kerikeri (now around -10%). The West Coast is the only area where a moderate deficit of ~23% remains (see rainfall deficit plots below).
Rainfall % median map for June 2020 to July 2020
Rainfall maps for the 15 to 18 July weather event:


SPI Index map for the 12-month period, July 2019 to July 2020
One year and six-month rainfall deficit percentage values
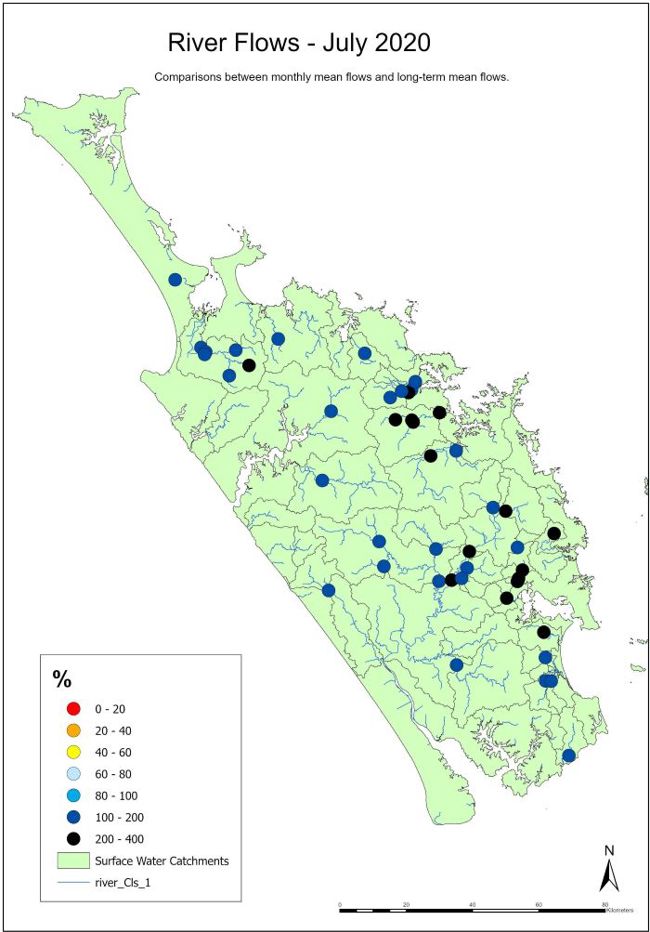
River flow
For July 2020, river flows were 200-400% above normal in many rivers along the east coast of the region with the remaining catchments at 100-200% compared to long term averages (see map below “River Flows – July 2020).
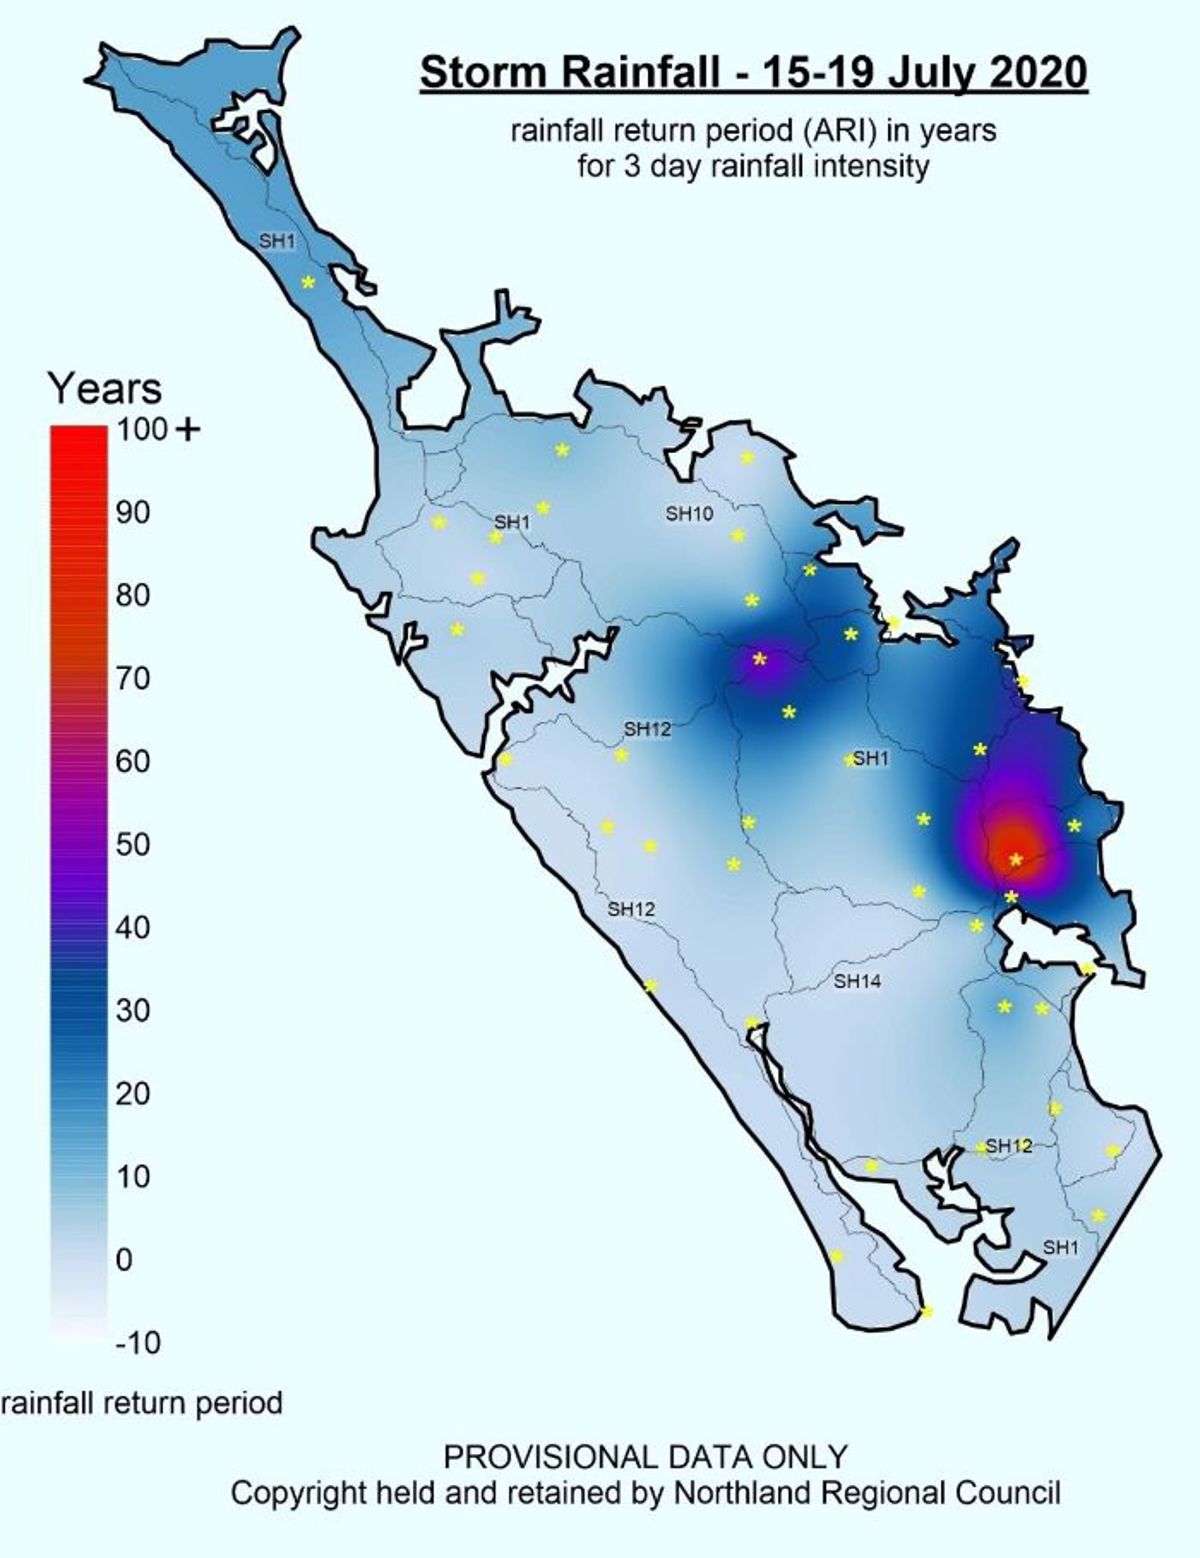
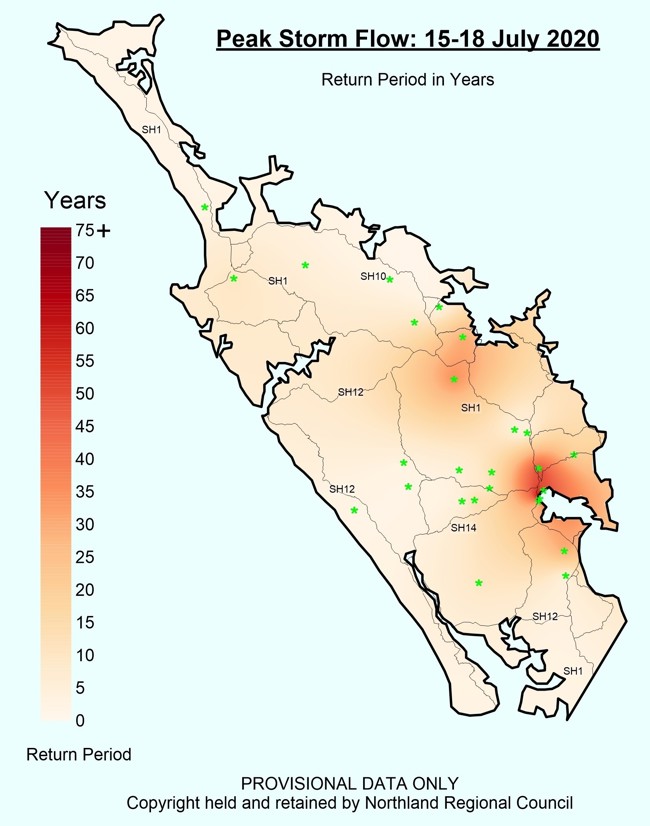
The second map below (Peak Storm Flow: 15-18 July 2020) shows the effect of the rainfall during the 15-19 July storm on peak river flows, expressed as a return period. The Whangārei area had the highest peak flow return periods, with the Waiarohia, Hatea and Mangaharuru Rivers recording flows of 1:50 year return periods or greater. These were highest recorded flows in the Hātea river since 1986, the Waiarohia River since 1979 and what would have been the highest recorded flow in the Raumanga River had the Hopua te Nihotetea Detention Dam not throttled back the flows. The Ruakaka and Ngunguru Rivers also experienced high flows with ~1:30 and ~1:20 year return periods, respectively. In the Bay of Islands area, the Waitangi and Waiharakeke Rivers recorded high flows of ~1:30 year return period.
Flow Map June 2020
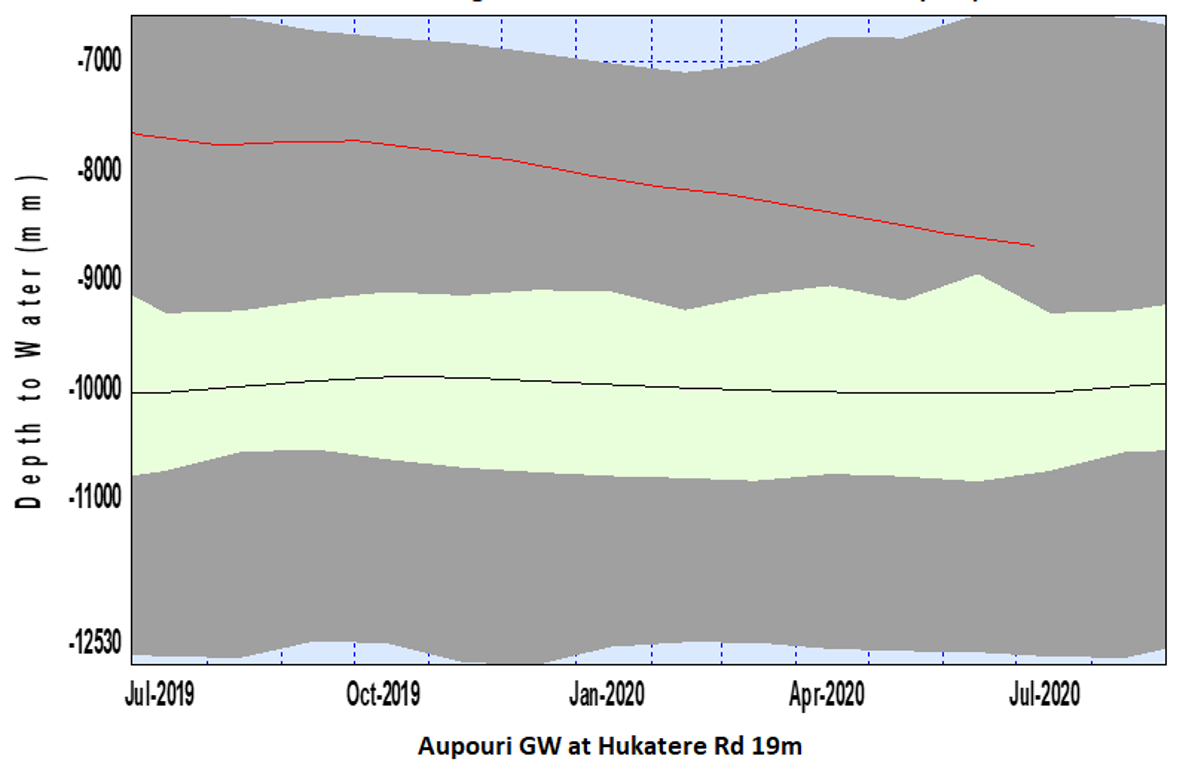
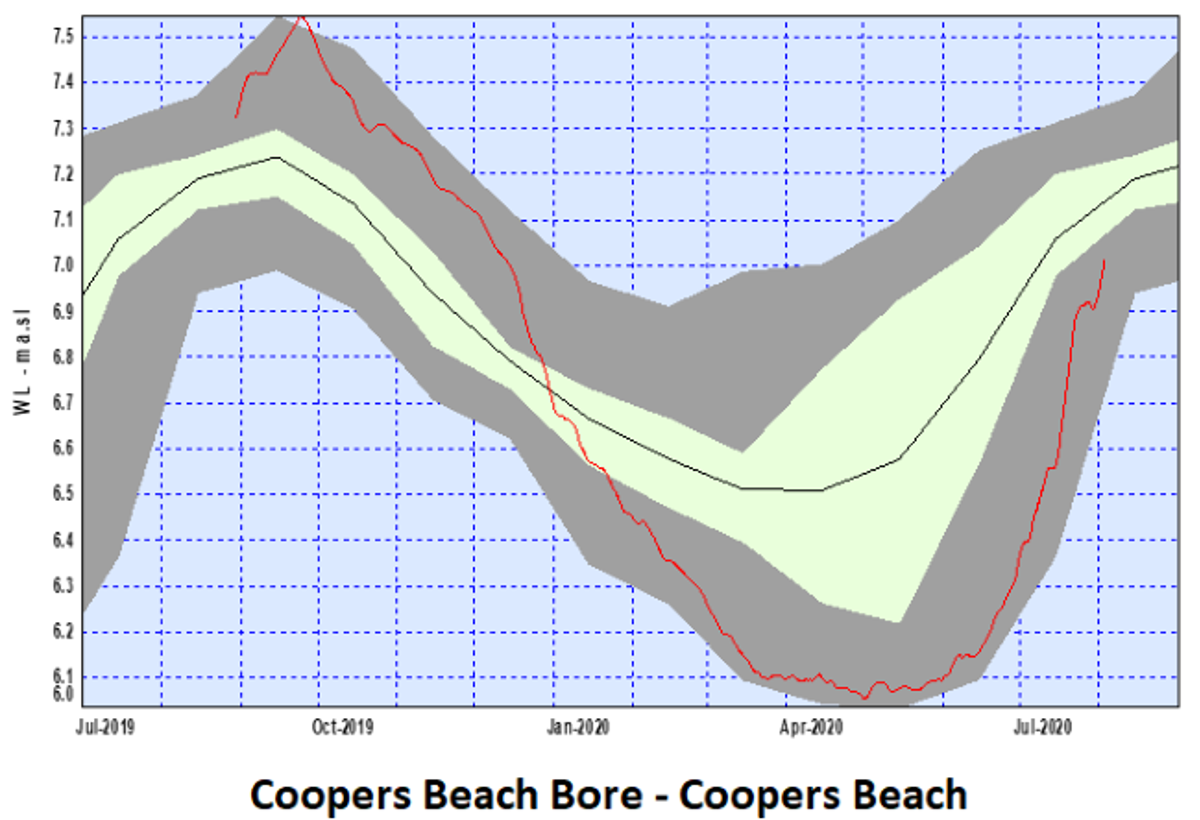
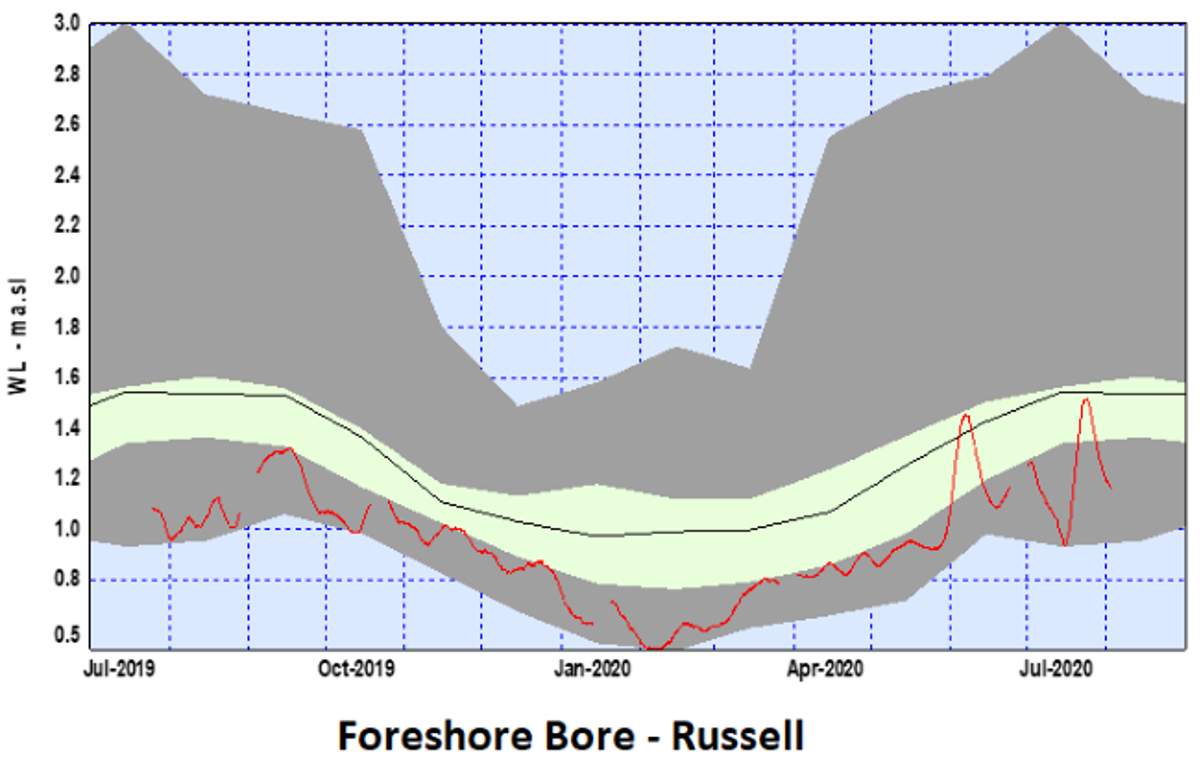
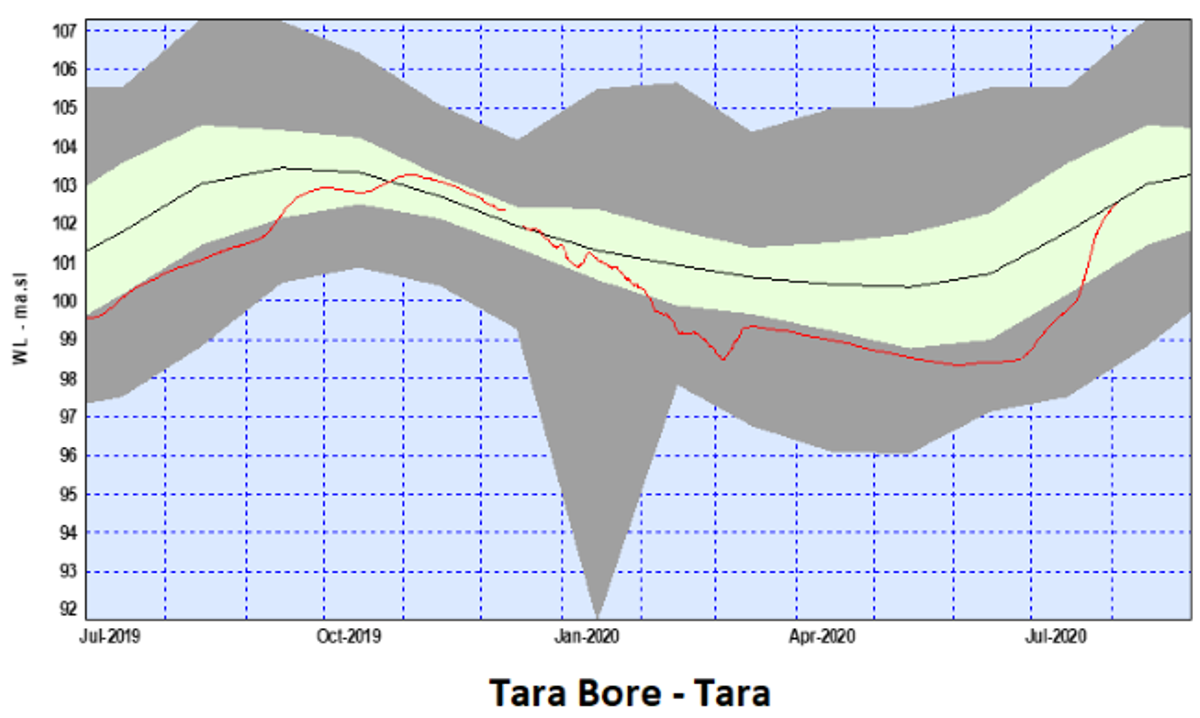
Groundwater
Water level readings indicate that the Mangawhai groundwater system is below average for July 2020. All other aquifers appear to have recovered well with levels now typical of this time of year. The rain during June and July has done a good job replenishing Northland’s aquifers.
Northland aquifer status
|
Groundwater Systems |
Status for July 2020 |
|
Aupouri |
OK |
|
Taipa |
OK |
|
Russell |
OK |
|
Kaikohe |
OK |
|
Whangārei |
OK |
|
Marsden-Ruakaka |
OK |
|
Mangawhai |
BELOW AVERAGE |
|
Poroti |
OK |
One-year groundwater trends (red) relative to the long-term average (black) and upper and lower percentiles (bottom grey area denotes 0-20th percentiles)


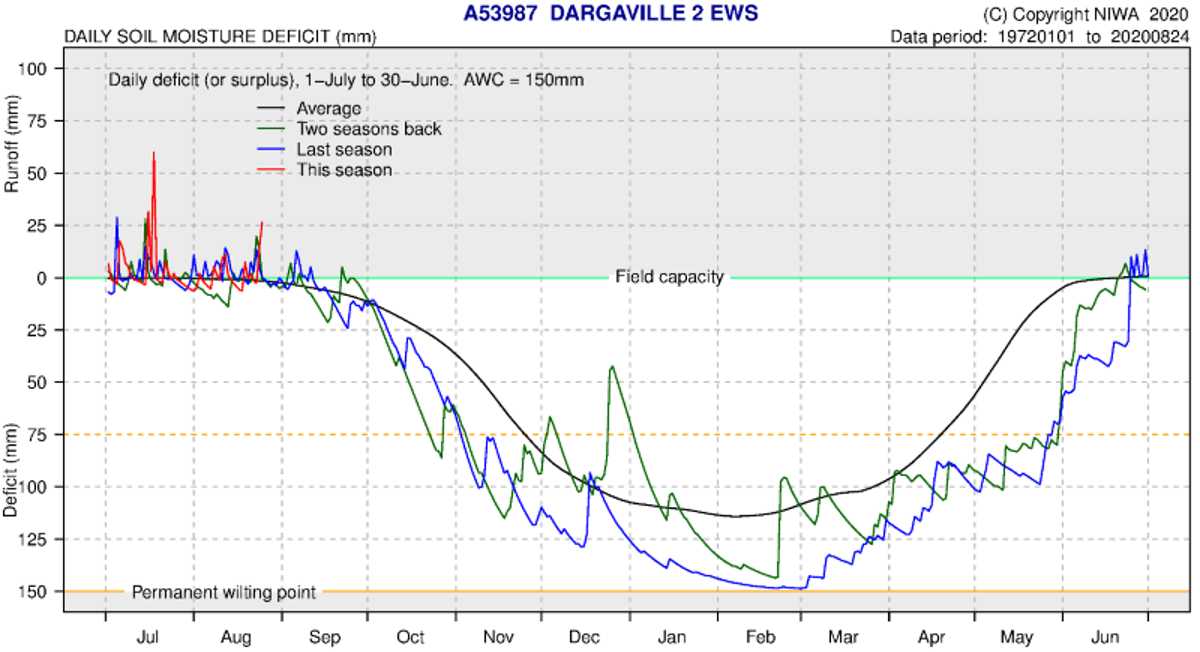
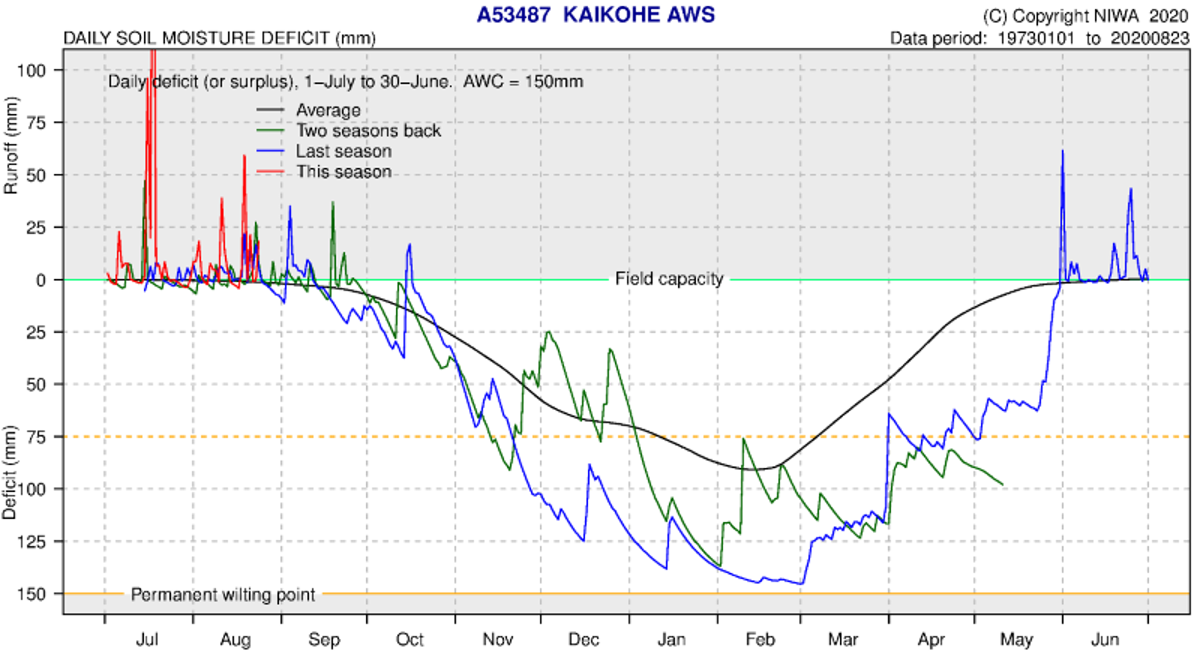
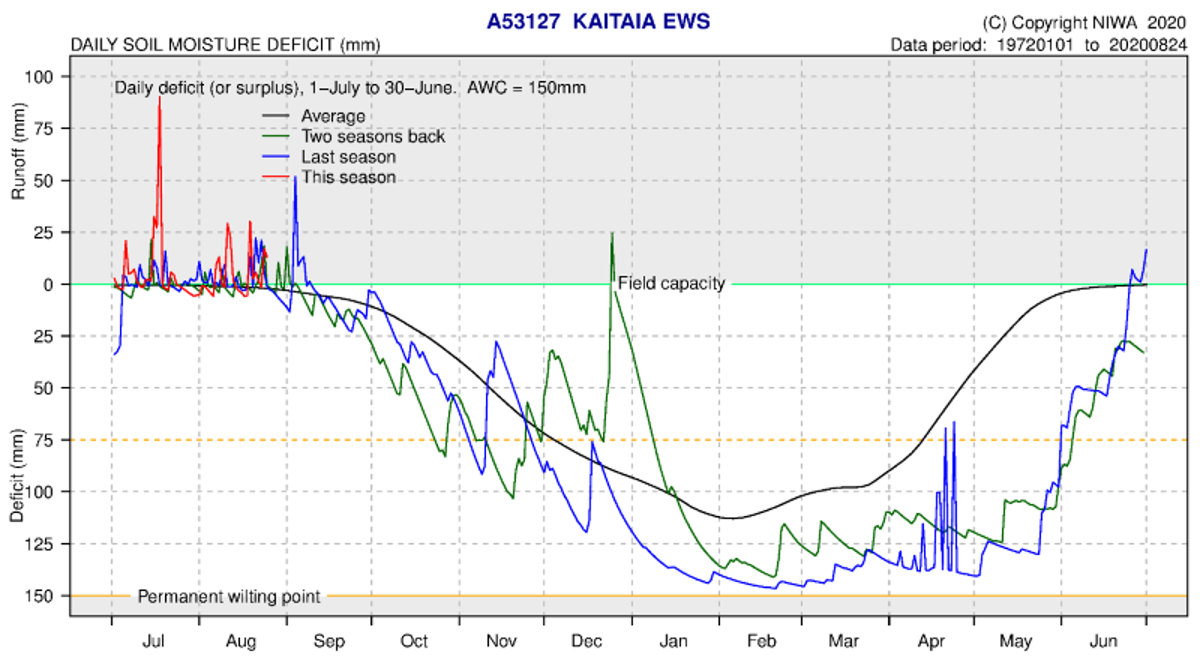
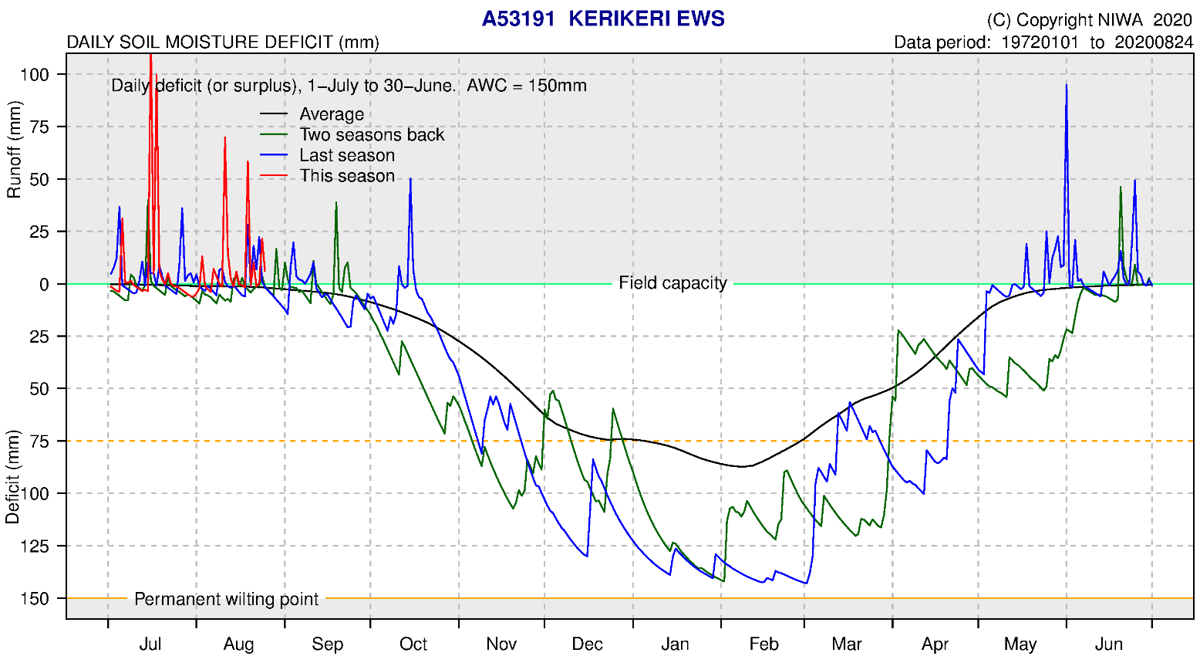
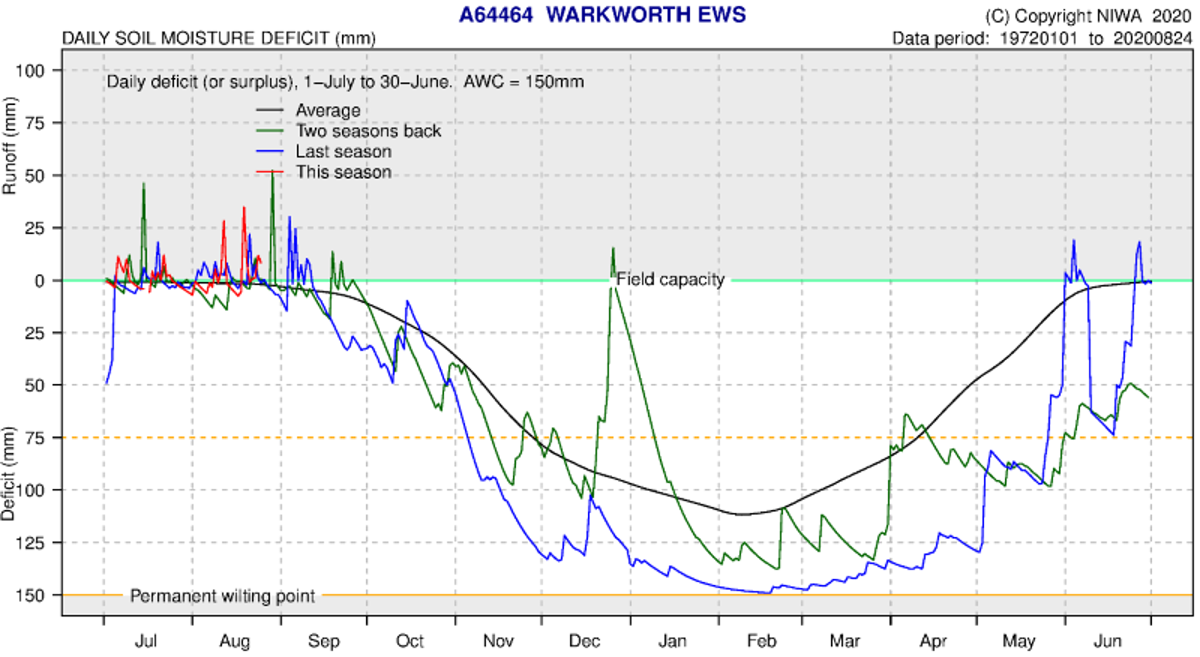
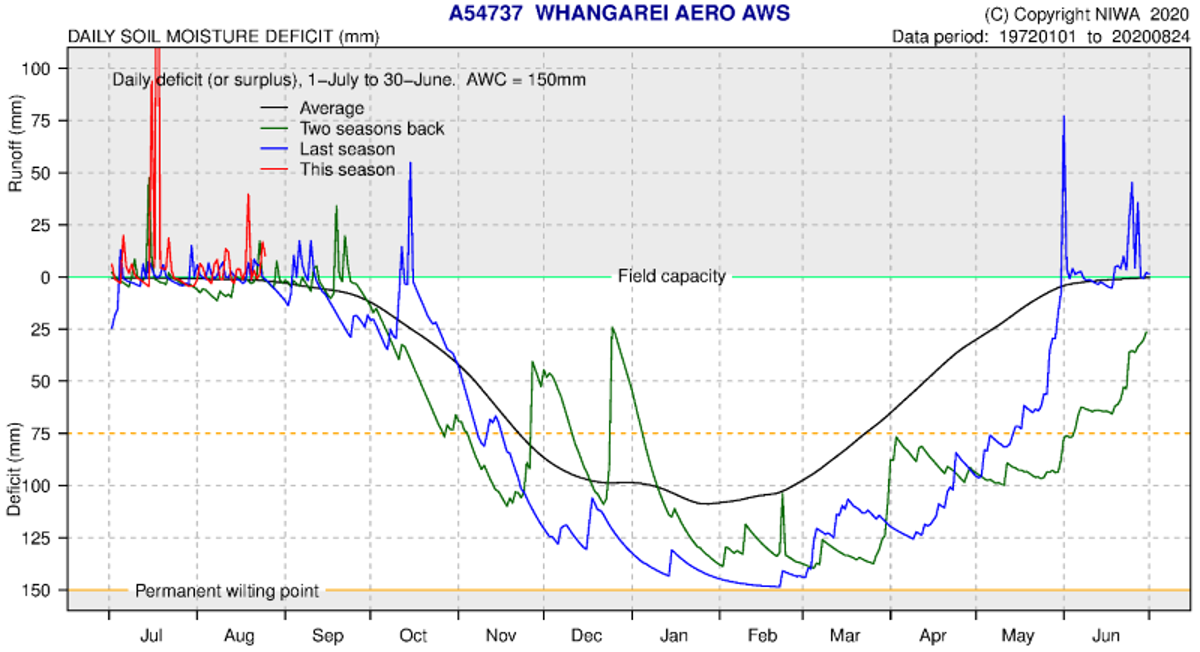
Soil moisture deficits
NIWA water balance modelling indicates soil moisture deficit is at or above field capacity at all NIWA climate stations. This is typical for this time of year. “SMD is calculated based on incoming daily rainfall (mm), outgoing daily potential evapotranspiration (PET, mm), and a fixed available water capacity (the amount of water in the soil 'reservoir' that plants can use) of 150 mm” (NIWA).
|
NIWA Climate Station |
Observed Soil moisture deficit (mm) as of 24/08/2020 |
Average July soil moisture deficit |
Difference between Expected and Average |
|
Kaitaia |
0-25 mm |
0 mm |
0 |
|
Kerikeri |
0-25 mm |
0 mm |
0 |
| Whangārei |
0-25 mm |
0 mm |
0 |
|
Kaikohe |
0-25 mm |
0 mm |
0 |
|
Dargaville |
0-25 mm |
0 mm |
0 |
|
Warkworth |
0-25 mm |
0 mm |
0 |