February climate report 2019
14 Feb 2019, 12:39 PM
Current situation
The rain in late December 2018 provided a brief break from the dry weather, delivering 60-90mm to most of the region. However, throughout January a static subtropical ridge has hovered over the Tasman, blocking low pressure systems to the south and leading to sustained high pressure and predominantly westerly winds. With these hot dry winds and record low January rainfall figures along the east coast catchments, the region has quickly dried out.
Catchments in the Bay of Islands area in particular are under pressure, now with 7 months of nearly continuous below average rainfall. January rainfall totals at Waitangi at McDonald Road were the lowest since records began in 1987. This area received 40-50mm early February 2019, which was needed as rivers were getting down to critical flows. However, a significant amount of rain in the scale of 300mm is required in the Bay of Islands area to break the dry spell.
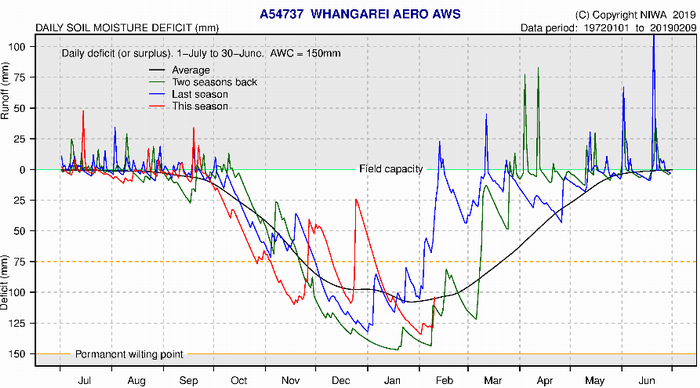
Other catchments have been showing the signs of the dry January, with flows all rivers well below the average for January and many with flow between 0-20% of average, and January rainfall at Hatea at Glenbervie the lowest since records began in 1948. Soil moisture deficits in all areas except Whangārei are below average for the beginning of January.
Outlook
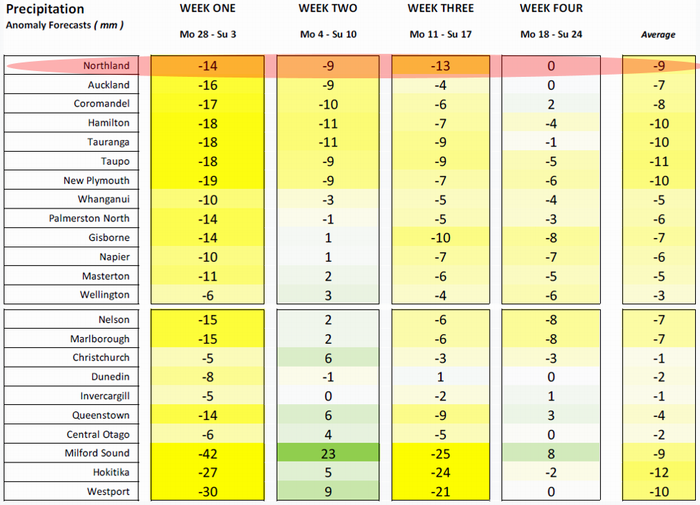
Metservice have forecast some modest rain for weeks two and four of February, but overall below average rainfall in Northland for in forecast for February 2019 (refer to Metservice table below).
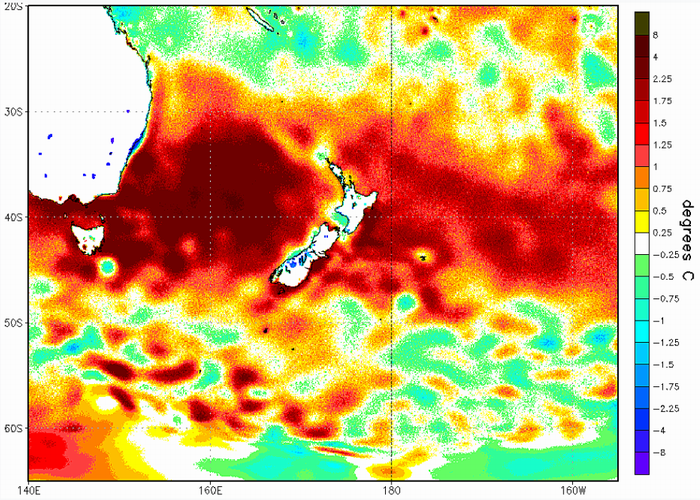
Sea surface temperatures have continued to rise, with a particularly strong warming in January. However, Metservice and NIWA note that the coupling of sea surface temperatures and atmospheric conditions typical of ElNino conditions has not yet occurred and the establishment of ElNino weather patterns may not occur until winter. Metservice are predicting tropical cyclone activity from mid-February and a shift to a southerly regime about this time, though most of the tropical rainfall will be falling east of the country for this month. Temperatures for the remainder of February are predicted to be near average for the month.
Sea surface temperature anomaly 29 January
Metservice February 2019 rainfall prediction
Rainfall
November | December | January
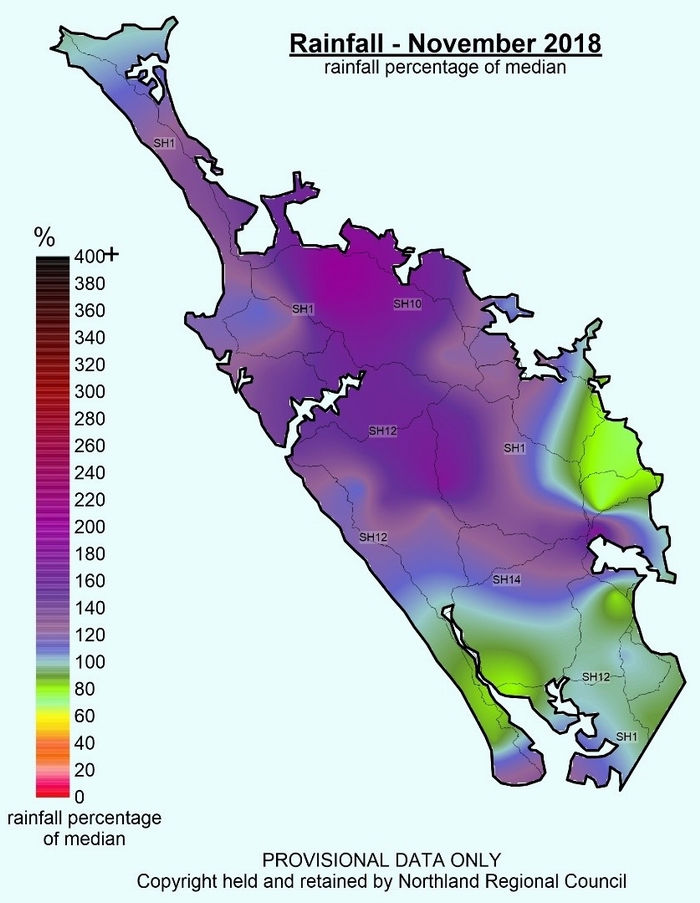
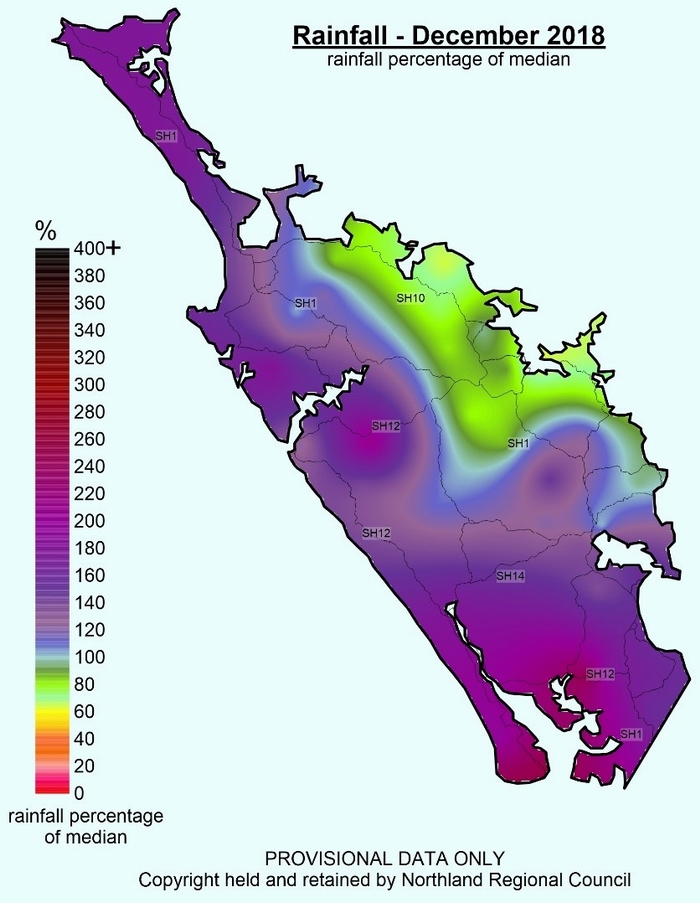
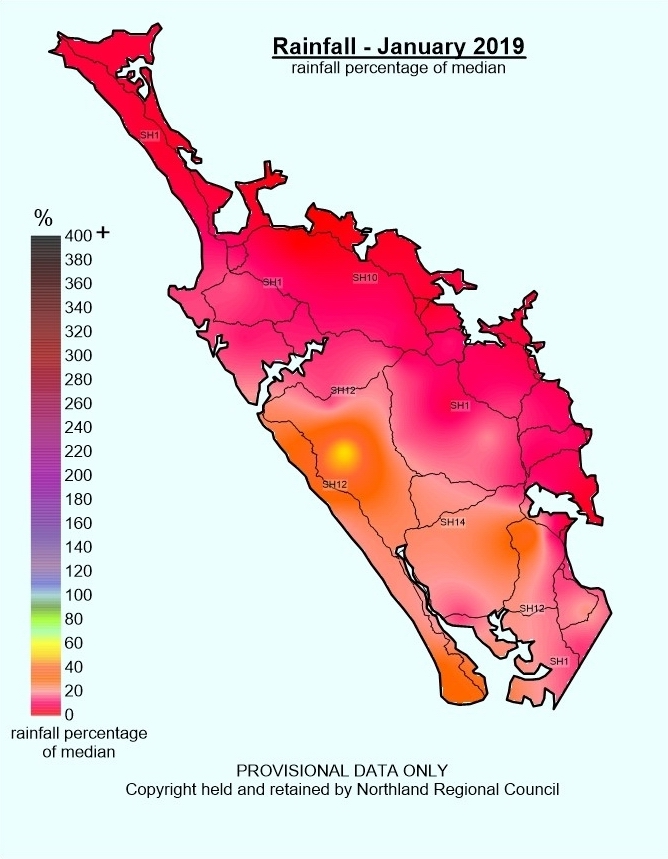
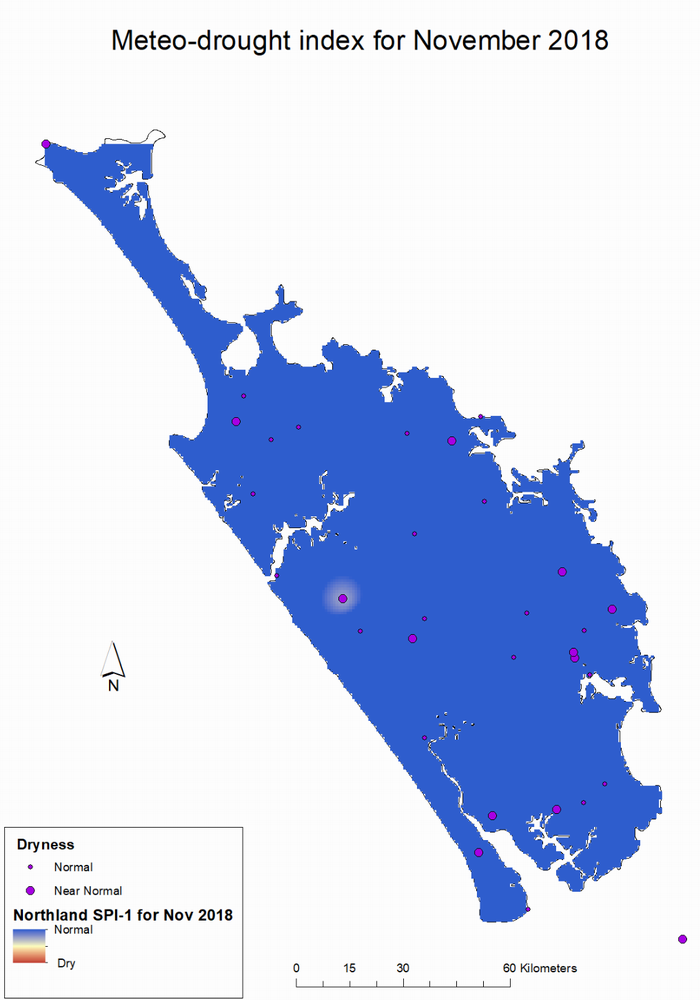
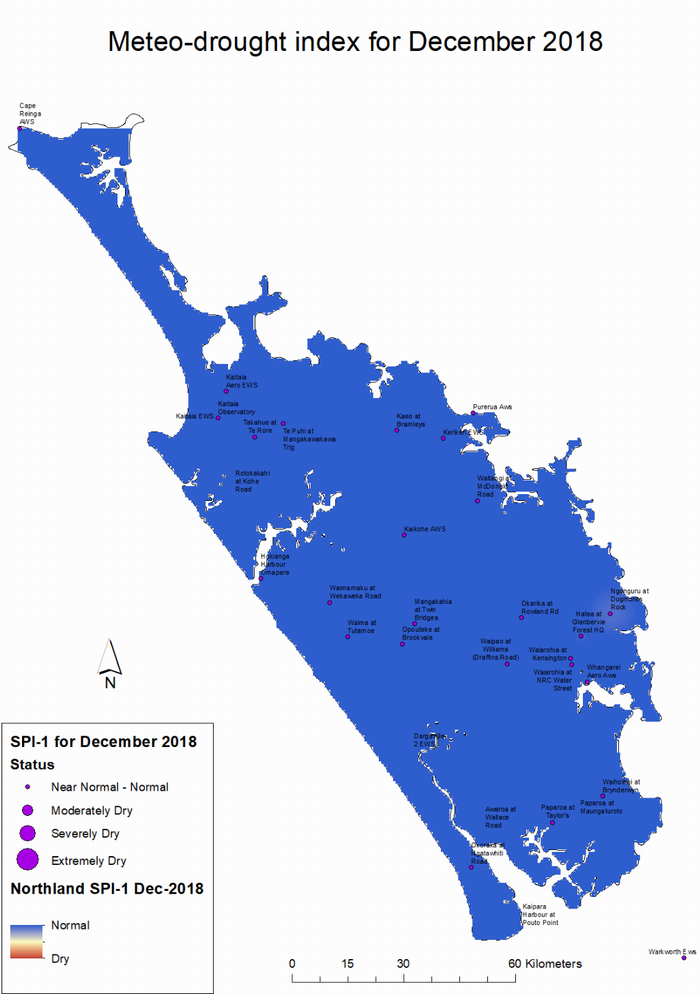
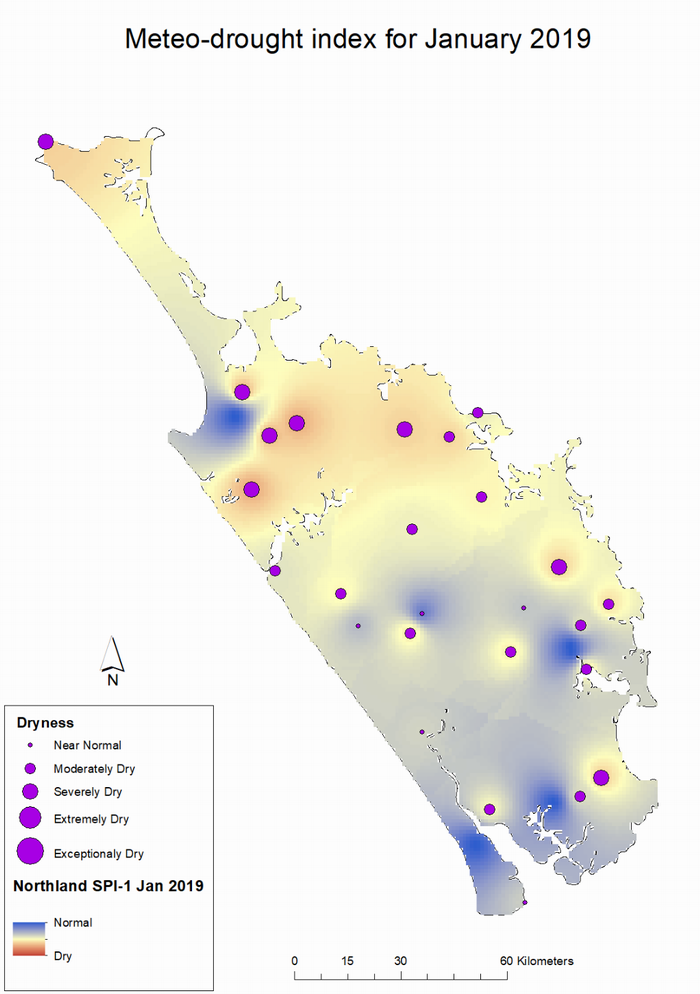
November and December 2018 rainfall figures were near normal or above normal in all areas except the Bay of Islands/eastern hills. However, January 2019 has been exceptionally dry in all areas of Northland, with the far north, mid north, Bay of Islands and Whangārei areas receiving only around 10% of the expected January rainfall. Bream Bay and the southern parts of Northland received around 15% of expected January rainfall, while the west coast received around 25%.
Previous months
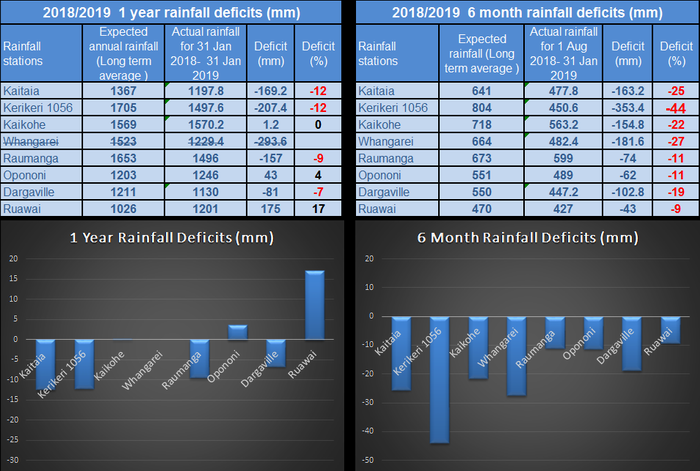
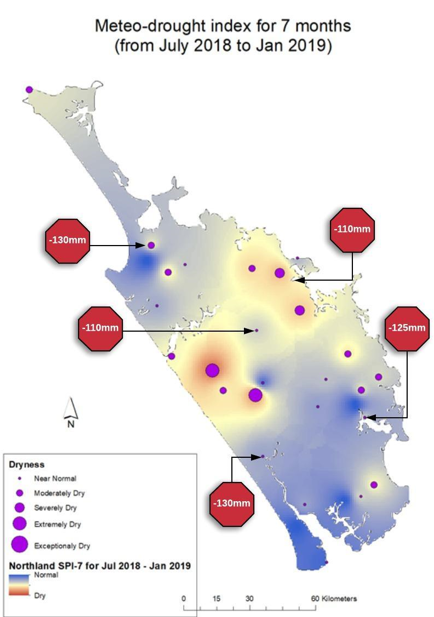
Looking at the rainfall deficits for the previous 6 months, there is an overall trend of rainfall deficit throughout the region, despite the rainfall reprieves over November-December. As expected, with the continuation of below average rainfall in the Bay of Islands area for over 6 months, there is a large rainfall deficit here of 350mm. The NRC SPI Index rates this area as severely dry using the previous 7 months of rainfall data. Similarly, below average rainfall was recorded in Kaitaia, Kaikohe and Whangārei for the 2018 months of July, August, September, October and January 2019. This has led to large 6-month rainfall deficits here of 160mm, 154.8mm and 181.6mm, respectively. The NRC SPI Index rates this area as near normal to moderately dry using the previous 7 months of rainfall data. Bream Bay, Kaipara and West Coast gauges show deficits of 43 – 103 mm. Note also that West Coast stations Waimamaku at Wekaweka Road and Opouteke at Brookvale (which were not used in deficit calculation, due to their short period of record) have a 7 month SPI Index rating of extremely dry.
One year and six-month rainfall deficit values
NRC SPI index map for July 2018 to January 2019
Median Rainfall Maps November 2018 to January 2019
NRC SPI Index Maps November 2018 to January 2019
River flow
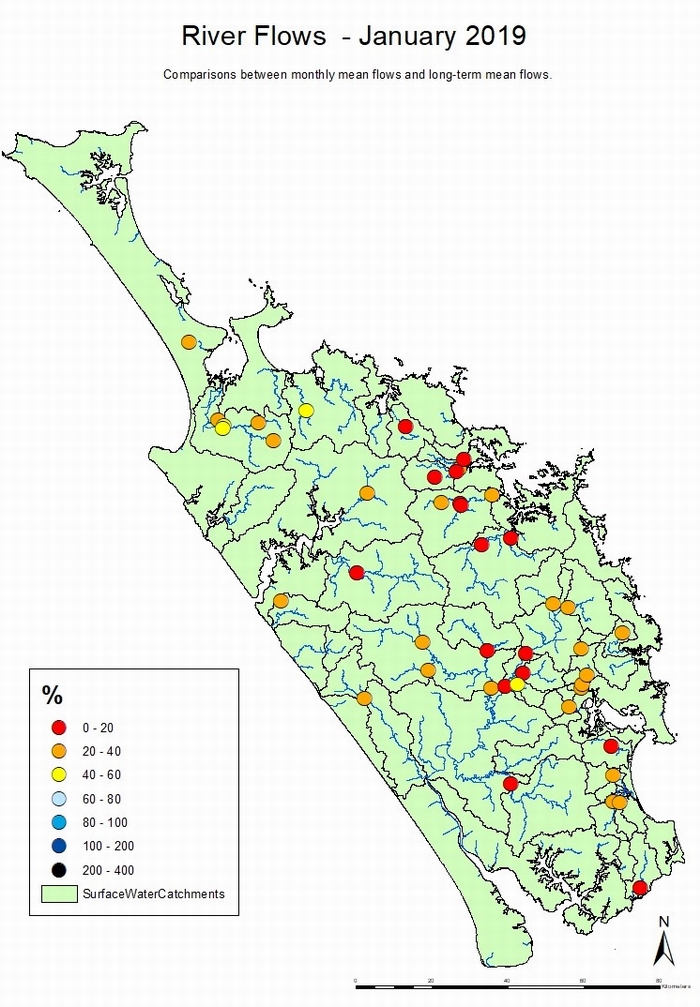
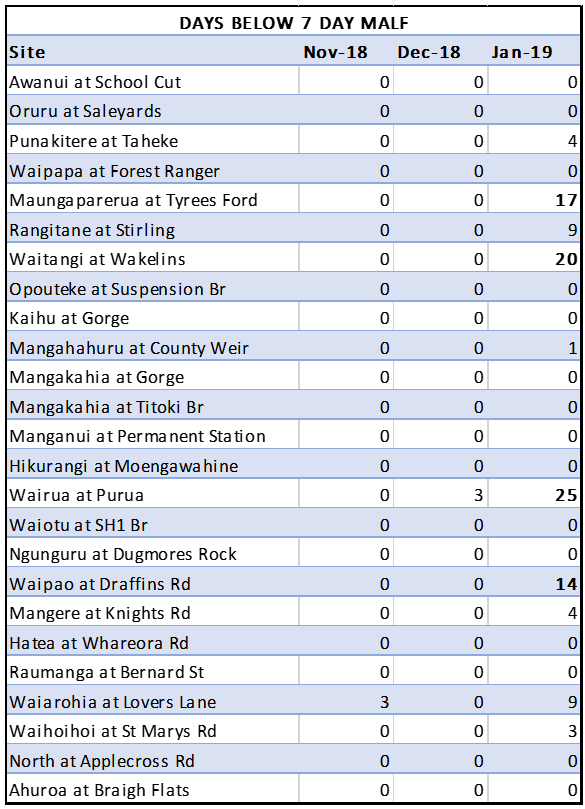
Toward the end of January, the river flows were getting very low, particularly in the Bay of Islands and Kaihu catchment. Some reprieve was felt with rainfall in the Bay of Islands of up to 40mm at the beginning of February 2019, but much more is needed to keep rivers above drought flows over the next month. At the end of January most of the NRC river stations were recording flows of 20-40% or 0-20% of typical January flows. The recorder stations Maungaparerua at Tyrees Ford, Waitangi at Wakelins, Wairua at Purua and Waipao at Draffins Rd recorded between 14 and 25 days below MALF for the month of January.
Flows have since increased with the February rain, but could return to these drought flows by the end of this month if February rainfall is minimal as predicted. The table below displays an estimate of days of no rain required for MALF and DDF to be reached. Some rain is expected in week 3 of February, so some of these thresholds are unlikely to be met per the “Predicted River Flows” table below.
Flow map
January 2019 and table of days below 7 day MALF at river recorders Nov 2018-Jan 2019
Predicted River Flows for Northland from 11 January 2019 estimated from recession curves (assuming no rainfall from this point onwards):
| Water level recorder | Days to reach Mean Annual Low Flow (MALF) |
Days to reach 1-in-5 year low flow |
| Awanui at School cut | 5 | 15 |
| Kaihu at Gorge | 7 | 10 |
| Maungaparerua at Tyrees Ford | 0 | 5 |
| Ngunguru at Dugmores Rock | 10 | 35 |
Groundwater
Water level reading indicates that the Russell, Kaikohe and Whangārei aquifers are below average for January 2019. The systems at Aupouri, Taipa, Poroti and Mangawhai appear OK.
Northland aquifer status
| Groundwater systems | Status for January 2019 |
| Aupouri | OK |
| Taipa | OK |
| Russell | BELOW AVERAGE |
| Kaikohe | BELOW AVERAGE |
| Whangārei | BELOW AVERAGE |
| Poroti | OK |
| Mangawhai | OK |
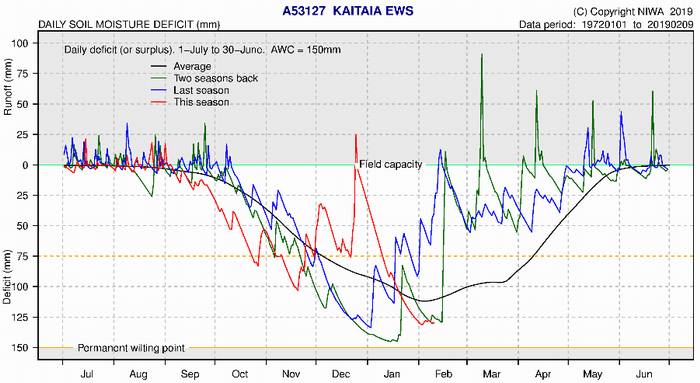
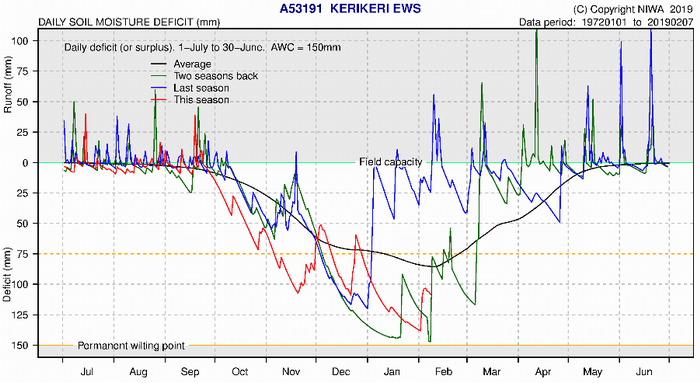
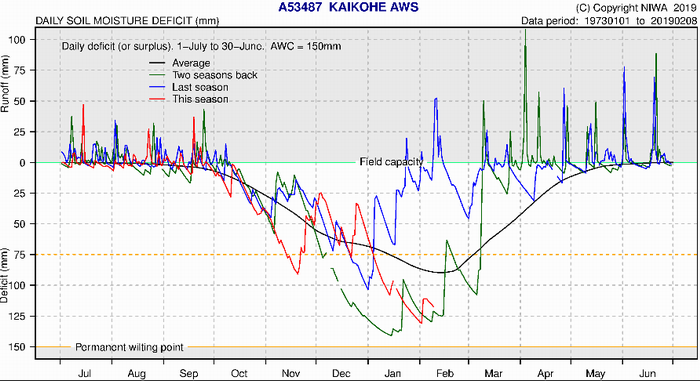
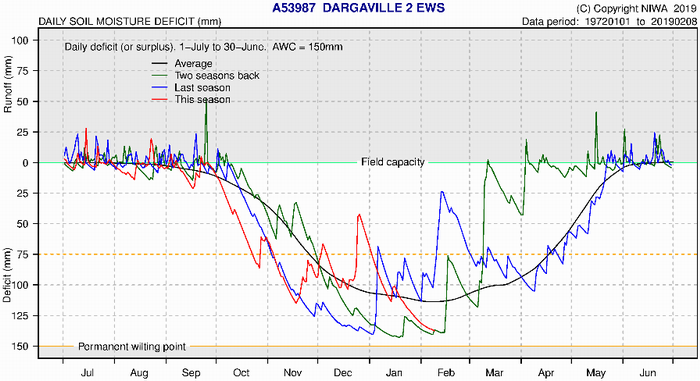
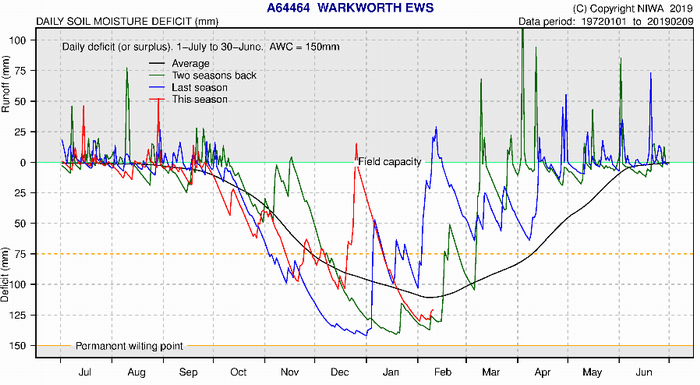
Soil moisture deficits
NIWA water balance modelling indicates soil moisture deficit is below average at Kaitaia, Kerikeri, Kaikohe, Dargaville and Warkworth.
Soil moisture deficit at NIWA climate stations
| NIWA Climate station | Soil moisture deficit (mm) as of 09/02/2019 | Normal soil moisture deficit (mm) |
| Kaitaia | -125 | -110 |
| Kaikohe | -105 | -85 |
| Kerikeri | -115 | -85 |
| Whangārei | -105 | -105 |
| Dargaville | -135 | -115 |
| Warkworth | -125 | -110 |