Society
Population
How fast has our population grown?
Northland is home to just over 158,000 people, 3.6 percent of New Zealand's population (Table 1 and Figure 1)1. During 2007-2011, Northland's population increased by 3.6% or 5600 people, equivalent to an annual growth rate of 0.7%. This is lower than the annual growth rate of 1.1% for Northland during the previous five years 2002-2006, when the population grew by 8300 persons. It is also lower than the rate at which the national population has grown. However, the national population growth rate is dominated by Auckland, where one-third of New Zealand's population lives and which, at 1.6% per annum, grew faster than any other region during 2007-2011. If Auckland is excluded, the annual population increase in the rest of New Zealand is only 0.8% during 2007-2011, similar to that of Northland.
Over the past 10 years, six regions have consistently had a lower population growth rate than Northland: Gisborne, Hawkes Bay, Taranaki, Manawatu-Wanganui, the West Coast and Southland.
Figure 1: Northland population, 2002-2011
Source: Statistics New Zealand
Where do people live?
Northland's population is split evenly between urban and rural areas (Table 1 and Figure 2). This is very different from the New Zealand population as a whole: 86% of the national population lives in urban areas and only 14% in rural environments.
In comparison with other regions, Northland is the most rural, with the highest proportion of its population living outside urban areas. Northland's population is also becoming more rural, with higher growth rates in rural areas as compared to urban areas, over the last 10 years.
One-third of Northland's population lives in the Whāngārei urban area, with a further 18% living in the Whāngārei rural area. In total, just over 50% of the Northland population lives in the Whāngārei district. In contrast, a far greater proportion of the populations in both the Far North and Kaipara districts live in rural areas.
In the Far North district, which accounts for 37% of Northland's population, 60% of people live in rural areas. The proportion is even greater in Kaipara, where just over 75% of the Kaipara district population is rural.
Table 1: Selected population and household indicators for Northland
- The 14 regions are Northland, Auckland, Waikato, Bay of Plenty, Gisborne, Hawkes Bay, Taranaki, Manawatu-Wanganui, Wellington, Tasman/Nelson/Marlborough, West Coast, Canterbury, Otago and Southland.
- Northland Regional Council estimate based on Statistics New Zealand population estimates and projections.
- Includes Pacific Islanders, Asian, Middle Eastern, South American and Africans.
- The total number of families is greater than the number of family households because some households contain more than one family.
Source: Statistics New Zealand, Population Estimates and Projections, Census for 2001 and 2006.
Figure 2: Composition of Northland and New Zealand population by rural and urban areas, 2011
Source: Statistics New Zealand
During 2007-2011, the 3.6% increase in Northland's population has mainly taken place in the Whāngārei urban and rural areas, which together accounted for about 70% of the growth (Figure 3). These two areas also experienced the largest population increases during 2002-2006.
Outside Whāngārei, the Kerikeri urban area is the next most significant area of population growth. Kerikeri's population has increased by 14% or 820 people since 2006. This followed a 20% increase during 2002-2006.
The populations in rural areas of Kaipara and the Far North have also grown over the past ten years. In contrast, the number of people living in the urban areas of Kaipara and the Far North outside Kerikeri has remained relatively static or has decreased slightly.
Figure 3: Contribution of rural and urban areas to Northland's population growth, 2002-2011
- Measured by the area's contribution to the percentage point change in Northland's population during the five-year period. For example, in the five years 2007-2011, the Whāngārei rural area contributed a 1.5% increase in Northland's population, which in total increased by 3.6%.
- Areas ordered according to 2007-2011 growth rates.
- Urban-Far North: Coastal area includes settlements at Taipā-Maunganui, Paihia and Russell.
Source: Statistics New Zealand
Northland's ethnicity and religions
What is the ethnic profile of Northland?
Northland has a relatively high proportion of people of Māori ethnicity (Table 1 and Figure 4). Almost one-third of the population is Māori compared to just 15% at the national level. Only Gisborne, with 48%, has a higher proportion of Māori. Just over 50,000 Māori live in Northland, representing 7.5% of the total Māori population.
The proportion of the Northland population identified as of European ethnicity (62%) is slightly lower than at the national level with only Auckland and Gisborne having a smaller proportion.
Fewer than 10,000 people of other ethnic groups live in Northland. They represent just 6% of the region's population compared to 20% nationally.
Figure 4: Composition of Northland and NZ population by ethnicity, 2011
- MEASA: Middle Eastern, African and South American.
Source: Statistics New Zealand
Figure 5: Contribution of ethnicity to Northland's population growth, 2002-2011
- Measured by the ethnic group's contribution to the percentage point change in Northland's population during the five-year period. For example, in the five years 2007-2011, the Māori population contributed a 1.6% increase in Northland's population, which in total increased by 3.6%.
- Groups ordered according to 2007-2011 growth rates.
- MEASA: Middle Eastern, African and South American.
Source: Statistics New Zealand
During 2007-2011, people of Māori ethnicity contributed most to the 3.6% increase in Northland's population (Figure 5). Northland's Māori population is estimated to have increased by 2500 persons or 5.2% over these five years, accounting for almost half the population increase.
This is a complete reversal of the situation in the proceeding five years. During 2002-2006, the 5.7% increase in Northland's population was predominately driven by a rise in people of European ethnicity. The European population rose by 5600 persons (6%) in 2002-2006 while the Māori population increased by just 900 (2%).
One explanation for the difference in ethnic growth rates between the two periods could be economic-induced migration patterns. When the Northland and national economies were growing during 2002-2006, Europeans were attracted to Northland for lifestyle reasons while Māori perhaps headed south for employment. The opposite may have occurred during 2007-2011. The economic slow-down may have led to Europeans leaving the region to find jobs and Māori, unable to secure employment elsewhere, returning to their ancestral homes and communities.
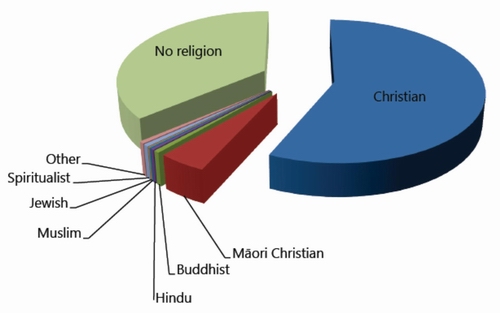
What are the most common religions in Northland?
The main religion in Northland is Christianity with approximately 56% of respondents in the 2006 census considering themselves Christian. This is followed by no religion (36%), Māori Christian (4.5%), Buddhism (0.59%), Spiritualism (0.57%), Other (0.56%), Hinduism (0.42%), Islam (0.16%), and Judaism (0.11%) (Figure 6).
Figure 6: Composition of Northland by religion
Population age
What is the age structure of Northland?
Another important feature of the demographic structure of Northland is the relatively high proportion of people outside the working age, that is, children under 15 and adults over 65 (Table 1 and Figure 7). Almost 40% of Northland's population fits into one of these two categories, making it the region with the highest proportion of non-working age persons (and conversely the region with the lowest proportion of working age persons).
Within the working age population, Northland has the lowest proportion of people aged 15-39 years. This reflects the fact that many young people move out of the region once they have finished secondary school, for tertiary education and training. Another factor is the relatively low level of wages and salaries paid in Northland which is not an attraction for people starting their working career, particularly those who have accumulated student debt.
Figure 7: Composition of Northland and New Zealand population by broad age groups, 2011
Source: Statistics New Zealand
Only older age groups are contributing positively to population growth in Northland (Figure 8). During 2007-2011, the strongest growth was in the population aged over 65, which grew by 19% or 4100 persons. This was up from a 16% increase (3000 persons) in the previous five years.
While people aged over 65 is also the fastest growing age group nationally, only the Tasman/Nelson/Marlborough region is estimated to have experienced a marginally faster growth rate in this population age group than Northland during 2007-2011.
At the other end of the age spectrum, Northland's population of children (aged 0-14) has decreased during 2007-2011 by some 2% or 800 children.
This continues the trend seen in 2002-2006 however this decrease is not unique to Northland. While nationally the number of children has grown by 0.7% over the period 2007-2011, the number of children is estimated to have decreased in nine of the 14 regions. As a consequence of these changes, the median age of the Northland population has increased from 38 in 2006 to 40 in 2011. It was 34 in 1996.
The aging of Northland's population will continue. By 2031 it is projected that 27% of Northland's population will be aged over 65 and the median age will be 45.
Figure 8: Contribution of broad age groups to Northland's population growth, 2002-2011
- Measured by the age group's contribution to the percentage point change in Northland's population during the five-year period. For example, in the five years 2007-2011, the number of persons aged over 65 contributed a 2.7% increase in Northland's population, which in total increased by 3.6%.
- Age groups ordered according to 2007-2011 growth rates.
Source: Statistics New Zealand
Northland's households and families
What is the structure of households and families?
There are estimated to be 62,400 households in Northland (Table 1). Just over 70% of households are occupied by families, the same proportion as at the national level. A further 26% are single person households, which is slightly higher than the national average of 24%. However, all regions with the exception of Auckland and Waikato have a proportion of single households greater than the national average, with five regions having a greater proportion than Northland.
Among the 14 regions, Northland has experienced the highest growth rate in single person households during 2007-2011. The remaining 3% of Northland households are made up of non-family multi-person households. Northland has the lowest proportion of these types of households reflecting the low proportion of population in the 15-39 age group, which are more likely to live together in flatting arrangements.
The most common family type in Northland, and New Zealand as a whole, is a couple without children. This type makes up 46% of Northland families, and has been the fastest growing family type over the past 10 years.
Couples with a child (or children) make up a further one-third of Northland families. This is lower than the national average of 39%, and is the lowest among the 14 regions. Moreover, the number of couples with child(ren) in Northland is estimated to have decreased by 4% during 2006-2011. This decrease is both a recent phenomenon and a national trend.
In 2002-2006, all regions with the exception of Southland experienced an increase in the number of couples with child(ren). By contrast, all regions, with the exception of Auckland, experienced a decrease during 2006-2011.
On the other hand, Northland has a relatively high proportion of single parent families, accounting for 21% of families in Northland. Only Gisborne and Hawkes Bay have a higher proportion. It is estimated that the rate of increase in this family type has slowed down, from 1.2% per annum during 2002-2006 to 0.6% per annum during 2007-2011.
Governance
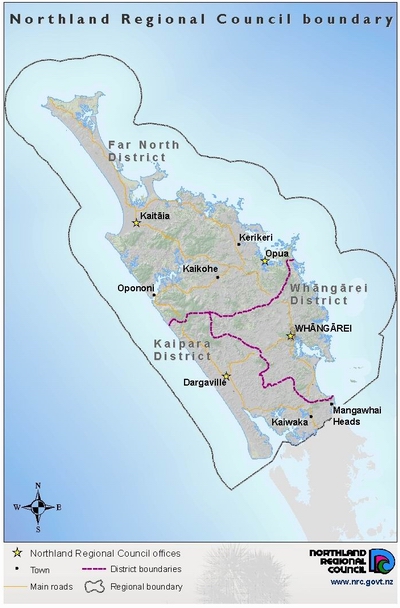
Northland has a land area of 12,548km² (1.25 million hectares) and 12,000km² of coastal waters. It extends northwards of a line from the Ōruawharo arm of the Kaipara Harbour and a point just south of the Mangawhai Harbour and the east coast.
Northland has one regional council and three district councils, these being Far North, Kaipara and Whāngārei. All four bodies were constituted on 1 November 1989, by Order in Council following the Local Government Commission's Final Reorganisation Scheme for the Northland Region. They carry out various functions, some of which are derived from the Resource Management Act.
The area administered by the Northland Regional Council covers the entire land area of the region and its associated coastal waters. These waters include 14 major harbours and extend 19.2 kilometres (12 nautical miles) offshore to the limits of the territorial sea. The Far North, Kaipara and Whāngārei district councils administer land areas of 684,100; 303,400 and 271,900 hectares respectively. Figure 9 shows the administrative boundaries of the region and its key features.
Figure 9: Administrative boundaries of Northland and key features
1 Due to the Christchurch earthquake in February 2011, the 2011 Census was postponed until 2013. Consequently, the 2011 population estimates by Statistics New Zealand used in this publication are based on the results of the 2006 Census and other appropriate data.