8.3 What is the state of coastal water quality?
Water quality for recreational use
Surveillance water quality sampling and testing is undertaken by the NRC during summer to assess the suitability of marine waters for recreational bathing purposes.
Samples are analysed for levels of enterococci bacteria, which are the indicator most closely correlated with health effects in New Zealand marine waters. When enterococci bacteria exceed a level of 140 enterococci per 100 ml (‘alert mode'), the Microbiological Water Quality Guidelines (MFE 2002) recommends that sampling is increased and the source of contamination identified.
During the five summers between 2002/2003 and 2006/2007 surveillance water quality sampling was undertaken on a weekly basis at up to 57 sites. Most sampling sites are located within semi-enclosed coastal water bodies, such as estuaries and harbours, as water quality within these locations is more variable than open coast sites.
What is the quality of coastal waters for bathing purposes?
 A total of 2564 water quality samples were collected during the five summers between 2002 and 2007 from up to 57 sites. Ninety-three percent of these samples were less than the ‘alert mode' standard of 140 enterococci per 100 ml, indicating the water is likely to be safe for swimming. Ninety-six percent of water quality samples collected were less than the ‘action mode' standard of 280 enterococci per 100 ml.
Water quality at virtually all semi-enclosed sites or sites adjacent to major river outflows is reduced to reasonably poor following heavy rainfall. Enterococci levels usually return to a level considered suitable for recreational bathing purposes after several days have elapsed following heavy rainfall.
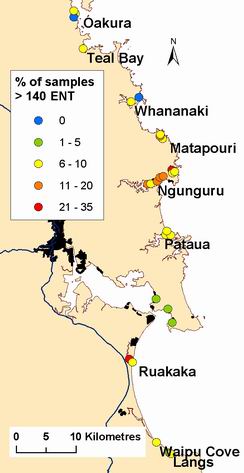
In Whangarei District there are two sites with more than 20% of their samples above 140 enterococci per 100ml, at Ruakaka River and Church Bay; and two sites with 100% of their samples below 140 enterococci, Whananaki near the estuary mouth and Oakura Beach below the shops as shown in figure 4 (right).
Figure 4: Percentage of samples between 2002 and 2007 that are greater than 140 Enterococci per 100ml for sites in the Whangarei District.
Of the seven sites in the Kaipara District all comply with the guideline of 140 Enterococci per100ml on at least 80% of sampling occasions, as shown in figure 5 (below). However none of these sites had 100% of their samples comply with the guideline.
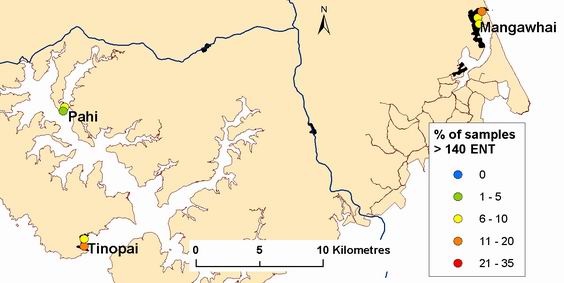
Figure 5: Percentage of samples between 2002 and 2007 that are greater than 140 enterococci per 100ml for sites in the Kaipara District
In Far North District there is only site with more than 20% of its samples above 140 enterococci per 100ml, which is Rawene, while five sites complied with the guideline of 140 enterococci on all sampling occasions, as shown in figure 6 (below). This was four sites in the Bay of Islands (English and Matauwhi Bays and two sites at Russell) and Cable Bay near Taipa.
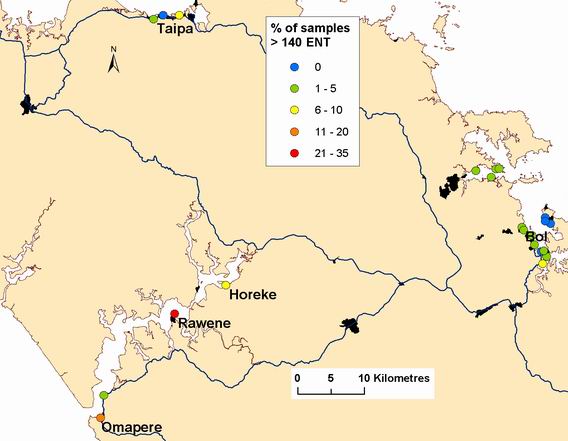
Figure 6: Percentage of samples between 2002 and 2007 that are greater than 140 enterococci per 100ml for sites in the Far North.
Whangarei Harbour study
Water quality in Whangarei Harbour has been regularly monitored to identify trends in water quality. More recently the monitoring has been limited to sampling 20 sites as shown in figure 7 (below), on a monthly basis. The parameters tested include temperature, dissolved oxygen, bacterial levels, turbidity and water clarity.
The bacterial results from 2001 (when enterococci testing was introduced) onwards can be compared to the recreational bathing guideline of 140 enterococci per 100 ml even though this sampling is not part of the recreational bathing sampling programme. However caution should be taken as these samples are not collected using the recreational bathing sampling methods i.e. they are collected from a boat at depth all year round.
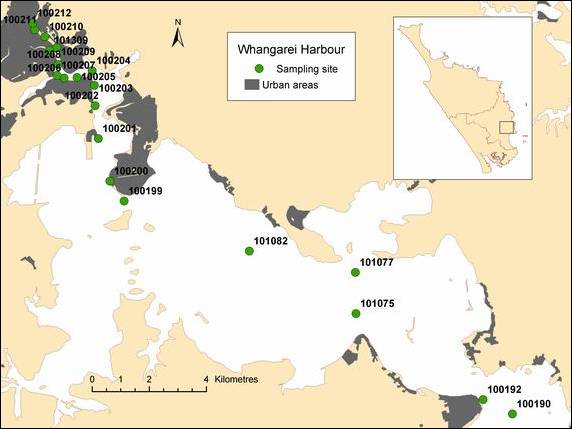
Figure 7: Whangarei Harbour study sampling sites.
In general, water quality is poor in the upper harbour near the Town Basin and improves as you move down the harbour as shown in table 1 and figure 8 (below). The upper harbour sites frequently exceed the 140 enterocooci per 100ml guideline, on anywhere between 20 to 35% of sampling occasions.
Sites from Waikaraka seaward meet the guideline on all sampling occasions, due to the large mixing volume of the lower harbour. The Onerahi foreshore, a popular swimming beach, meets the guideline on 98% of sampling occasions, this equates to only one exceedance in October 2003 at both sites 100200 and 100199.
Table 1: Percentage of samples in compliance with recreational bathing guideline of 140 enterococci per 100ml from September 2001 to November 2006. Note: Sites are in order from upper harbour to lower harbour.
| Site number | Site description | Percentage of samples < 140 ENT |
| 100212 | Hatea River above bridge | 79.6 |
| 100211 | Mid Town Basin | 74.5 |
| 100210 | Smiths boat yard | 71.4 |
| 101309 | Opposite Baxters | 63.3 |
| 100209 | Orams Marine | 76.0 |
| 100208 | United Carriers | 70.0 |
| 100207 | Limeburners Creek | 70.2 |
| 100206 | Fagans | 77.6 |
| 100205 | Cullhams | 81.3 |
| 100204 | Kissing Point | 84.0 |
| 100203 | Beacon | 87.8 |
| 100202 | Slipway | 89.8 |
| 100201 | Main Wharf | 93.9 |
| 100200 | Kaiwaka Point | 98.0 |
| 100199 | Onerahi Jetty | 97.9 |
| 101082 | Waikaraka | 100.0 |
| 101077 | Manganese Point | 100.0 |
| 101075 | One Tree Pt off lead light | 100.0 |
| 100192 | NZRC Jetty | 100.0 |
| 100190 | Mair Bank outer marker pile | 100.0 |
This decreasing trend in bacterial levels as you move down the harbour corresponds to decreasing turbidity and increasing water clarity as shown in figure 9 (below).
These trends are most likely as a result of a combination of a greater proportion of freshwater influence and potential inputs from more concentrated boating activity (e.g. Town Basin marina) in the upper harbour and a lower dilution effect compared to the lower harbour.

Figure 8: Median Enterococci (n/100mL) levels in Whangarei Harbour for 2001 - 2006.
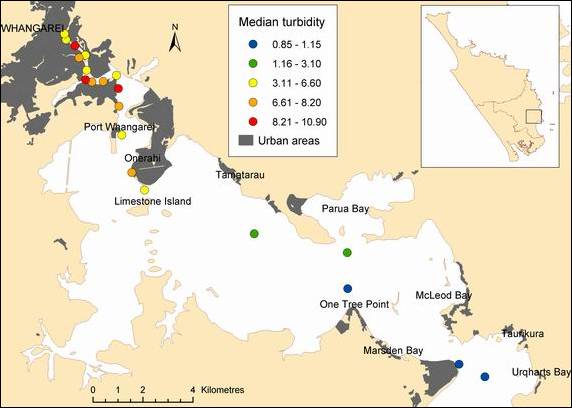
Figure 9: Median turbidity (ntu) levels in Whangarei Harbour for 2001 to 2006.
Trends in Whangarei Harbour water quality
There was a significant improvement in bacterial levels at several upper harbour sites in the area of Limeburners Creek between 1989 and 1990 linked to an upgrade in the Whangarei wastewater treatment plant (NRC 2002b). A formal trend analysis was carried out on temperature, dissolved oxygen and faecal coliform levels for eight sites in the upper Whangarei Harbour for data from 1986 to 2007. The results are presented in table 2 (below).
There was a decreasing trend in faecal coliform levels at all eight sites for this 20-year period but particularly for sites in the vicinity of Limeburners Creek (sites 100205, 100206 and 100207). There was an increasing trend in dissolved oxygen levels at all eight sites for this 20-year period. There was also an increasing trend in temperature at three sites, interestingly the same three sites that had the largest decreasing trend for faecal coliforms.
Table 2: Significant trends (i.e. p ≤ 0.05) for eight Whangarei Harbour sites from 1986 to 2007 with the slope of the trend (i.e. change per year) and the number of samples in brackets. Note: NS = No significant trend
| Site number | Description | Temperature °C/year (n) | Dissolved oxygen mgL-1/year (n) | Faecal coliforms MPN100mL-1/year (n) |
| 100205 | Culhams | 0.04 (290) | 0.06 (289) | -37 (383) |
| 100206 | Fagans | 0.02 (285) | 0.06 (286) | -71 (381) |
| 100207 | Limeburners Crk | 0.04 (347) | 0.1 (347) | -100 (469) |
| 100208 | United Carriers | NS | 0.04 (290) | -15 (392) |
| 100209 | Orams | NS | 0.07 (288) | -8 (350) |
| 100210 | Smiths | NS | 0.06 (304) | -11 (366) |
| 100211 | Town Basin | NS | 0.1 (293) | -5 (358) |
| 100212 | Hatea River | NS | 0.1 (291) | -7 (355) |
To check that the decreasing trend in faecal coliforms for this 20-year period was not due to the significant change after the upgrade in 1989, further trend analysis was carried out on subsets of the data. Trend analysis was carried out on faecal coliform data from 1986 to 1991 and from 2000 to 2007. The results are shown in table 3 (below).
These results show the large improvement in faecal coliforms levels at the three sites near Limeburners Creek in the six-year period, 1986 to 1991, during which the treatment plant upgrade was carried out. However this is not the case when we look at the last six years of data, which shows there are no significant trends.
Table 3: Significant trends (i.e. p ≤ 0.05) for faecal coliform levels (MPN100mL-1/year) for eight Whangarei Harbour sites with the slope (i.e. change per year) and the number of samples in brackets. Note: NS = No significant trend
| Site number | Description | Jan 1986 – Dec 1991 | Jan 2000 – Apr 2007 |
| 100205 | Culhams | -335 (150) | NS |
| 100206 | Fagans | -561 (151) | NS |
| 100207 | Limeburners Creek | -3811 (151) | NS |
| 100208 | United Carriers | NS | NS |
| 100209 | Orams | NS | NS |
| 100210 | Smiths | NS | NS |
| 100211 | Town Basin | NS | NS |
| 100212 | Hatea River | NS | NS |
Median faecal coliform levels for the last five years for Whangarei Harbour are shown in figure 10 (below). The high results in the upper harbour can partly be contributed to discharges and sewage spills from the Whangarei wastewater treatment plant and reticulation system. Other potential sources include illegal discharges from boats and freshwater catchment inputs such as leaking septic tanks or run off from small areas of low intensity agricultural farming and feral animals in areas of native and exotic forest.
Since 1 January 2002 there have been 43 sewage spill incidents in the Whangarei Harbour and its contributing streams reported to the regional council, which includes spills from the Whangarei wastewater treatment plant as well as other minor spills from onsite systems.
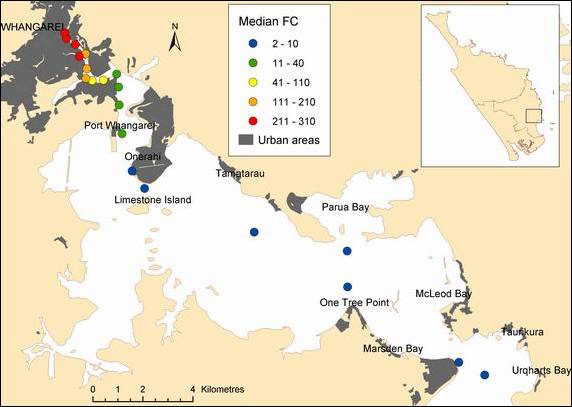
Figure 10: Median faecal coliform levels (MPN/100mL) in Whangarei Harbour for 2001 to 2006.
The Okara Park pump station, located on Port Road, is the largest pump station in the Whangarei sewer system. Raw sewage from Whangarei City and outlying suburbs (excluding Onerahi) flows to the Okara Park pump station from where it is pumped to the Whangarei Wastewater Treatment Plant on Kioreroa Road. The Okara Park pumps have the ability to pump up to 800 litres of sewage per second. If the sewage flow exceeds this rate, which can occur during extreme wet weather events, the excess is discharged into the Hatea River, at a location adjacent to the Okara Park stadium. This overflow during storm events is a consented activity.
A common problem with reticulated sewer systems is the effects of stormwater, which can enter sewer pipes either directly via inflow, such as from illegal gutter connections, or indirectly via infiltration such as pipeline fractures. The volume of sewage combined with stormwater can exceed the capacity of the sewer system, resulting in overflows. A particular site of concern in central Whangarei is Butter Factory Lane, where the back up of sewage and stormwater during extremely wet weather can cause local sewers to overflow affecting shop owners and other people in the central business district.
Whangarei District Council has started an upgrade of the Whangarei Wastewater Treatment System. Recently the second stage of the high flow bypass (i.e. during heavy rain) has been diverted to discharge the secondary treated sewage to the wetland on Kioreroa Road, rather then directly to Limeburners Creek. The next step is adding ultraviolet treatment to this bypass discharge before it is discharged to the wetland. The Whangarei District Council is also currently investigating options to reduce the occurrence of overflows in the reticulation system and determining whether there is a cost-effective solution.
Water quality for shellfish gathering
Sampling to assess the suitability of microbial water quality for recreational shellfish gathering is undertaken by the NRC at a number of popular recreational shellfish gathering sites during summer. This programme involves testing the water at popular shellfish gathering sites for concentrations of faecal coliform bacteria. Up to 17 sites have been sampled on a weekly basis for four summers from 2003/04 to 2006/07.
The guideline for recreational shellfish gathering water quality is a median faecal coliform count not exceeding 14 MPN per 100 ml over a shellfish-gathering season and not more than 10% of samples exceeding 43 MPN per 100 ml (MFE 2002). Non-compliance with either of these parameters indicates that the waters are not suitable for the purpose of recreational shellfish gathering.
What is the quality of coastal waters for recreational shellfish gathering?
The compilation of all results for the four summers from 2003/2004 to 2006/2007 indicated that the water quality of most areas sampled were unlikely to comply, or may not comply, with the water quality guideline for recreational shellfish gathering. A total of 605 water quality samples were collected during these four summers from up to 17 sites. Twenty-three percent of these samples exceeded a faecal coliform count of 43 per 100ml.
Of the 17 sites, 14 had more than 10% of samples that exceeded a faecal coliform count of 43 per 100ml as shown in figure 11 (below) and three sites exceeded the median faecal coliform limit of 14 per 100 ml, as shown in figure 12 (below). These results indicate that three of the 17 sites sampled were compliant with the water quality guideline for recreational shellfish gathering. These were sites at Cable Bay, Ruakaka and Paihia.
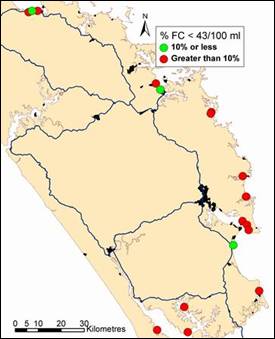
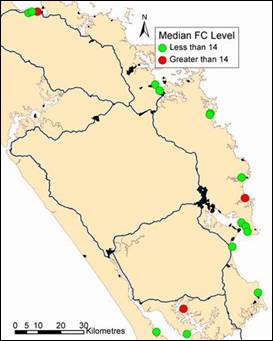
Figure 11: Percentage of samples for the last four summers less then the 43 faecal coliforms/100ml guideline (left). Figure 12: Median faecal coliform for the last four summers less then the guideline of a median faecal coliform of 14 MPN/100ml (right).
The majority of sites are within semi-enclosed coastal water bodies, such as harbours and estuaries, and these results are influenced by runoff following rainfall. These results are indicative only, as they were not collected over an entire shellfish-gathering season (which in Northland is considered year round) and are a composite of samples collected over several summer sampling periods. Nevertheless, these data provide a reasonable snapshot of the suitability of water-quality for recreational shellfish gathering purposes in the areas assessed.
Viruses in shellfish
Shellfish from the Bay of Islands and Whangaroa Harbour were studied between January 2004 to February 2006 to determine whether the shellfish were contaminated with human enteric viruses from sewage (Greening and Lewis 2007).
The study showed that shellfish beds were frequently contaminated with human viruses over the two-year period, particularly in the Bay of Islands. At two traditional shellfish- gathering areas in the Bay of Islands, human enteric viruses were detected in 19 of 49 shellfish samples. This is of concern as shellfish are a significant source of food for the local community. Further investigation and routine sampling will be established at selected sites in the future. Overall there was little virus contamination detected in oysters from the Whangaroa Harbour.
Water and sediment quality for ecosystems
Far North harbour water and sediment quality
The main contaminant issues affecting Far North Harbour ecosystems are sedimentation and nutrient enrichment, primarily resulting from land use activities.
 Ecosystems are changing in response to sediment and nutrient inputs, with increased sedimentation affecting a change to finer sediments enriched with nutrients. These effects are presently being witnessed, anecdotally, in many of these estuaries with increased areas of intertidal flats colonised by mangrove, fewer areas colonised by seagrass (due to higher turbidity) and less filter feeding infaunal invertebrates.
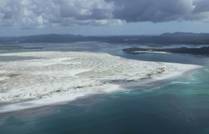
Parengarenga Harbour (right).
Reducing sediment, nutrient and microbial contamination will require significant changes in current land use practices and management, and is likely to require considerable time before positive changes can be realised.
Investigations were undertaken to assess sediment and nutrient levels in water and sediment of selected Far North Harbours in May to August 2004. Data from these investigations was compared with other estuarine systems and contaminant guideline values to assess the ‘health' of the estuaries.
Harbour water quality
The nutrient and turbidity water quality results for harbour waters were compared to the Australian and New Zealand Environment and Conservation Council trigger values for south-east Australia (ANZECC 2000). These trigger values are considered the most suitable standard for comparison in the absence of a set of trigger values specific to New Zealand. Concentrations of nutrients above the trigger level values indicate the potential for adverse environmental effects as a result of nutrient enrichment.
Highest concentrations of suspended solids and highest turbidity were recorded for the West Coast estuaries. This is considered to be largely a function of the catchments of these particular estuaries and historic sediment loading following land clearance practises in the contributing catchments. These catchments all have substantial areas of deforested pastoral highlands with steep topographies. These areas are prone to erosion during high intensity rainfall events, which provide for high sediment-load transport from upper catchments to estuarine areas.
Table 4: Mean total phosphorus (TP), dissolved reactive phosphorus (DRP), ammoniacal nitrogen (NH4), nitrate, nitrite nitrogen (NNN), suspended solids (SS) and turbidity results in estuarine waters in 2004. Results in bold italics exceed the ANZECC trigger value.
| Harbour | TP (g/m3) | DRP (g/m3) | NH4 (g/m3) | NNN (g/m3) | SS (g/m3) | Turbidity (ntu) |
| Hokianga | 0.064 | 0.013 | 0.042 | 0.092 | 15.8 | 10.8 |
| Whangape | 0.052 | 0.011 | 0.033 | 0.036 | 31.7 | 15.8 |
| Herekino | - | 0.007 | 0.018 | 0.033 | 20.7 | 10.6 |
| Parengarenga - North | 0.018 | 0.009 | 0.038 | 0.026 | 6.7 | 1.5 |
| Parengarenga - South | 0.058 | 0.009 | 0.103 | 0.031 | 5.2 | 1.2 |
| Houhora | 0.029 | 0.013 | 0.043 | 0.039 | 6.1 | 1.6 |
| Rangaunu | 0.030 | 0.011 | 0.037 | 0.036 | 6.9 | 2.8 |
| Taipa | - | 0.013 | 0.025 | 0.029 | 8.5 | 5.4 |
| Mangonui | - | 0.010 | 0.018 | 0.047 | 6.8 | 3.2 |
| Whangaroa | - | 0.010 | 0.024 | 0.035 | 7.6 | 3.4 |
| Overall Mean | 0.039 | 0.011 | 0.044 | 0.043 | 10.8 | 5.1 |
| ANZECC Trigger Values | 0.03 | 0.05 | 0.015 | 0.015 | - | 0.5 - 10 |
| Coastal Plan Maximums | - | 0.01 | 0.005 | 0.06 | - | - |
Concentrations of nutrients were elevated in all harbour water bodes in comparison to the ANZECC guidelines, particularly for ammoniacal nitrogen and nitrate-nitrite nitrogen. Elevated nitrogen concentrations are of concern, as nitrogen is typically the ‘limiting' nutrient in marine ecosystems. Potential impacts that may occur include changes in community composition (i.e. increased growth rate and distribution of mangrove), particularly when combined with sedimentation, and increased risk of algal blooms. However, the ranges of concentrations encountered appear similar to other northern North Island harbours, and is indicative of developed catchments and land use activities.
Table 5: Northland total phosphorus (TP), dissolved reactive phosphorus (DRP), nitrate nitrite nitrogen (NNN) and ammoniacal nitrogen (NH4) results compared to other northern NZ examples.
| Parameter (g.m-3) | Northland range (mean) | Waitemata range (mean) (Lam 1979) | Tauranga/Ohiwa range (mean) (Park 1994) |
| TP | 0.018 – 0.064 (0.039) | N/A | (0.022) |
| DRP | 0.09 – 0.013 (0.011) | 0 – 0.022 (0.01) | 0.005 – 0.015 (0.005) |
| NNN | 0.026 – 0.092 (0.043) | 0.002 – 0.3 (0.1) | 0.032 – 0.216 (0.115) |
| NH4 | 0.018 – 0.103 (0.044) | 0.01 – 0.02 | 0.005 – 0.036 (0.021) |
Harbour seabed sediment quality
High proportions of fine sediments, elevated nutrient levels and organic content in the Hokianga and Whangape estuaries, and to a lesser extent the Mangonui and Whangaroa estuaries, indicate a high level of sedimentation in these estuaries.
High sedimentation is likely to be a result of catchment modification and catchment land use, such as pastoral farming and forestry. The sedimentation of these estuaries, coupled with elevated nutrient concentrations, is likely to be having a significant effect on the composition of the estuarine flora and fauna. For example, anecdotal evidence points to an increase in the proportion of mangrove-colonised intertidal flats and a reduction in filter feeding infaunal invertebrates (such as pipi and cockle), as sediment composition changes to a higher fines content.
Table 6: Estuarine mean seabed sample analysis results for Northland harbours in 2004.
| Mean % of fine1 | Mean ash (g/100g)2 | Mean TP (mg/kg) | Norm TP (mg/kg)3 | Mean TN (mg/kg) | Norm TN (mg/kg)4 | |
| Hokianga | 53.6 | 13.5 | 492.6 | 1870 | 1300 | 3160 |
| Whangape | 50.2 | 13.2 | 375.6 | 868 | 1500 | 3398 |
| Herekino | 9.7 | 4 | 216.0 | 2478 | 900 | 10048 |
| Parengarenga Nth | 16.2 | 2.4 | 108.5 | 887 | 5792 | 40620 |
| Parengarenga Sth | 5.7 | 1.1 | 66.2 | 895 | 650 | 1368 |
| Houhora | 5.5 | 1.5 | 84.3 | 1497 | 3533 | 57531 |
| Rangaunu | 11.6 | 4.0 | 204.9 | 2769 | 960 | 3478 |
| Taipa | 19.4 | 4.3 | 561.2 | 3325 | 600 | 3793 |
| Mangonui | 32.5 | 6.8 | 689.7 | 2483 | 1200 | 3648 |
| Whangaroa | 45.1 | 6.0 | 702.7 | 2005 | 1067 | 2659 |
| Overall Mean | 23.5 | 5.3 | 300.3 | 1790 | 2451 | 15018 |
1 Percentage of sediment < 63um fraction as an overall proportion of total sample dry weight.
2 Grams of ash per 100 grams of sediment dry weight.
3 Mean total phosphorous normalised to % of sediment < 63 um (mg/kg).
4 Mean total nitrogen normalised to % of sediment < 63 um (mg/kg).
Antifouling contaminant monitoring
There are approximately 2800 registered moorings and nine marina facilities in Northland's coastal waters, mostly situated within sheltered east coast harbours and embayments.
High concentrations of moorings have the potential to cause contamination of water and sediments from the metals and booster biocides leached from antifouling paints, applied to the hulls of vessels.
A study was undertaken of mooring areas in Mangonui Harbour, Doves Bay, Opua and Parua Bay (Whangarei Harbour) in February 2006 to assess:
· Concentrations of the common antifouling paint biocides Diuron and Irgarol in seawater, in and adjacent to high-density mooring areas.
· Concentrations of copper, lead and zinc in the surface of seabed sediments and in the flesh of pacific rock oysters at sites in and adjacent to high-density mooring areas.
Concentrations of Irgarol in seawater were less than detection limits at all sites sampled, whilst Diuron was detected in seawater in low concentrations at two sampling sites. In all cases the concentrations recorded were less than the applicable guideline limits for the protection of marine organisms as shown in table 7 (below).
Table 7: Marine environmental protection guidelines for Irgarol and Diuron in seawater (adapted from Stewart (2003)), and results from NRC study in 2006.
| Guidelines | Irgarol (ng/L) | Diuron (ng/L) |
| NZ Environmental Exposure Limits | 24 | 1800 |
| Netherlands Max Permissible Concentrations | 24 | 430 |
| Range of concentrations in NRC study | All samples < 5 | < 20 – 30 |
Concentrations of copper, lead and zinc in sediments were recorded in concentrations below recommended guideline limits for the protection of the ecological health of sediments as shown in table 8 (below). Concentrations of copper and lead generally showed a pattern for highest concentrations in those sediments in the closest vicinity of the highest density of moorings.
Table 8: ANZECC (2000) sediment quality guidelines and summary of results from 2006 study.
| Copper (mg/kg) |
Lead (mg/kg) |
Zinc (mg/kg) |
|
| Low effect guideline trigger value | 65 | 50 | 200 |
| High effect guideline trigger value | 270 | 220 | 410 |
| Range of concentrations in NRC study | 2.2 – 31.0 | 2.5 – 19.3 | 16.6 – 93.1 |
Copper, lead and zinc in oyster flesh were recorded in concentrations similar to those recorded for other comparable moderately-disturbed northern New Zealand coastal ecosystems. Concentrations of copper in oyster flesh were typically greatest at those sites in closest vicinity of the highest density of moorings.
Table 9: Concentrations of metals in oyster flesh from 2006 study compared to other studies.
| Study | Location | Copper (mg/kg) |
Zinc (mg/kg) |
Lead (mg/kg) |
| NRC study | Various high density mooring areas, Northland | 15.3 – 88.7 | 102 - 382 | 0.01 – 0.072 |
| Tricklebank (2003) | Marsden Point, Northland | 30.8 – 56.9 | 145 - 249 | 0.029 – 0.036 |
| ARC (1992) | Tamaki Estuary, Auckland | 39 - 133 | 182 - 523 | <0.54 – <1.01 |
| ARC (2001) | Manukau Harbour, Auckland | 21 - 96 | 190 - 393 | <0.59 - <0.74 |
Note: Results were converted from dry weight valves to wet weight values using a conversion ratio of 1:6.8 as per Chen and Chen (2002). The data in this table was taken from Tricklebank (2003).
Whangarei Harbour Sediment-Metal Monitoring
At low concentrations most metals are harmless; however, accumulation of metals in sediments can cause concentrations to reach toxic levels. Metal concentrations in seabed sediments of the Whangarei Harbour have been assessed on an irregular basis since 1985, with the most recent sampling taking place in 2002. Approximately 16 sites, as shown in figure 13 (below), are sampled each time for a range of metals including lead, zinc, copper, cadmium, chromium and nickel. The sampling is undertaken to assess spatial and temporal trends in metal concentrations and any possible toxicity issues.
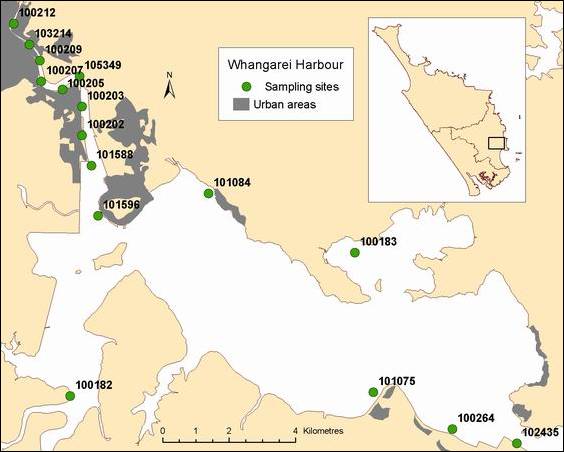
Figure 13: Location of Whangarei Harbour sites sampled for metals in the sediment.
In 2002 zinc was found in the highest concentrations, generally followed by copper, lead, chromium and then nickel as shown in figure 14 (below). Cadmium was found in the lowest concentration, in fact so low it does not show on figure 14.
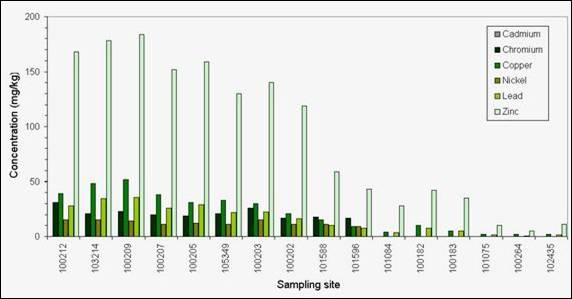
Figure 14: Metal concentrations (mg/kg) in sediment samples for all Whangarei Harbour sites sampled in 2002.
In 2002 the metal concentrations at all sites were below the ‘low effect level' trigger value from the ANZECC guidelines for marine sediment, indicating a low probability for adverse effects on the ecosystem (ANZECC 2000).
A number of sites in the upper harbour area had concentrations of lead nearing the ANZECC ‘low effect level' trigger value of 50 mg/kg as shown in figure 15 (below), while sites in the lower harbour had extremely low levels.
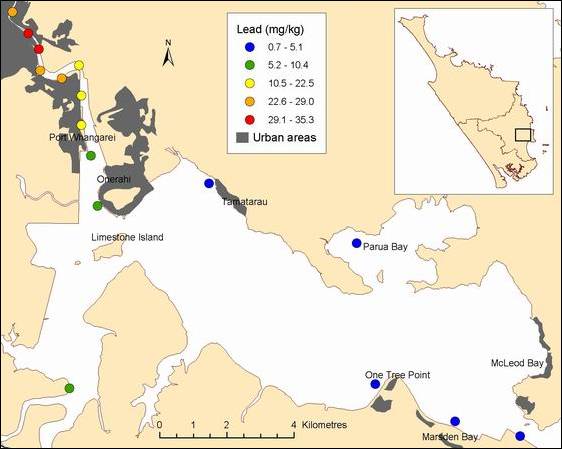
Figure 15: Lead (mg/kg) in sediment samples from the Whangarei Harbour in 2002.
Similarly to lead, several sites in the upper harbour had concentrations of zinc near the ANZECC low level trigger value of 200 mg/kg as shown in figure 16 (below), while lower harbour sites had very low concentrations.
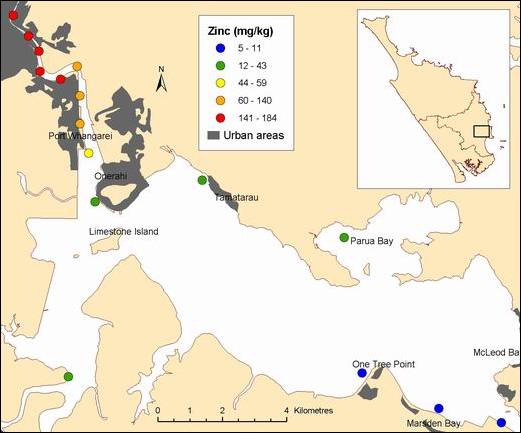
Figure 16: Zinc (mg/kg) in sediment samples from the Whangarei Harbour in 2002.
Likewise copper concentrations neared the ANZECC low level trigger value of 65 mg/kg for several upper harbour sites in 2002 as shown in figure 17 (below). Nickel was also elevated at some upper harbour sites, nearing the ANZECC low level trigger value of 21 mg/kg. Both cadmium and chromium levels in 2002 were extremely low and were well below their respective ANZECC trigger values of 1.5 and 80 mg/kg at all sites.
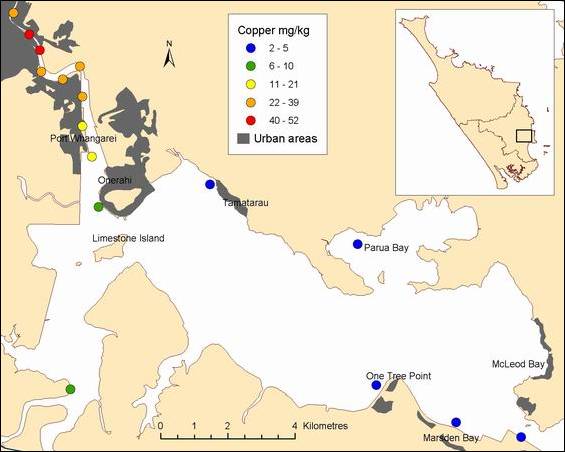
Figure 17: Copper (mg/kg) in sediment samples from the Whangarei Harbour in 2002.
A trend was evident for a decreased concentration in metal levels with increased distance from the urbanised area of Whangarei City. This trend is most likely a result of:
· Sediment type tending to coarser in gradient down harbour.
· Supply of metals decreasing in gradient down harbour.
· Tidal flushing and tidal mixing increasing in gradient down harbour.
There was no strong indication of an overall increase in the concentration of metals in the sediments over time as shown in figures 18 to 21 (below). In fact, in some cases there appeared to have been a reduction in the concentration of some metals in the upper harbour sites between 1990 and 2002, particularly for zinc (figure 19) and copper (figure 21).
Lead is showing a slightly increasing trend at two sites (100212 and 103214) but has had a significant decrease at some of the other sites between 1990 and 2002 (figure 18). Although chromium has not decreased much between 1990 and 2002, since 1985 there has been an overall reduction in chromium concentrations in sediments from the upper Whangarei Harbour (figure 20).
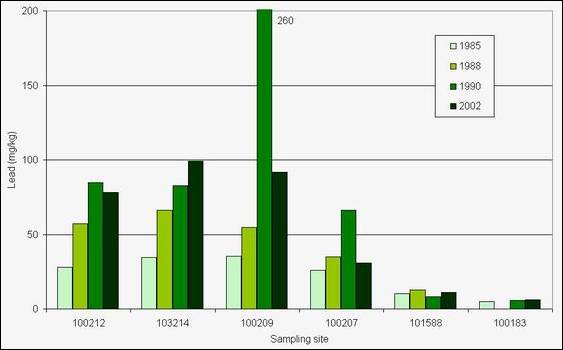
Figure 18: Lead concentrations (mg/kg) in sediments samples from several sites in the upper Whangarei Harbour in 1985, 1988, 1990 and 2002.
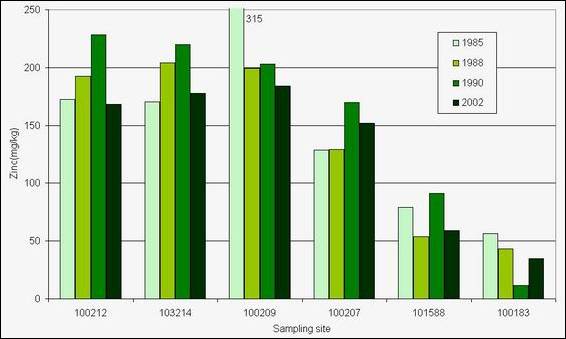
Figure 19: Zinc concentrations (mg/kg) in sediments samples from several sites in the upper Whangarei Harbour in 1985, 1988, 1990 and 2002.
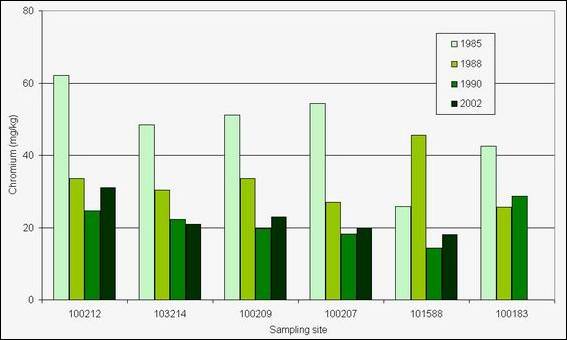
Figure 20: Chromium concentrations (mg/kg) in sediments samples from several sites in the upper Whangarei Harbour in 1985, 1988, 1990 and 2002.
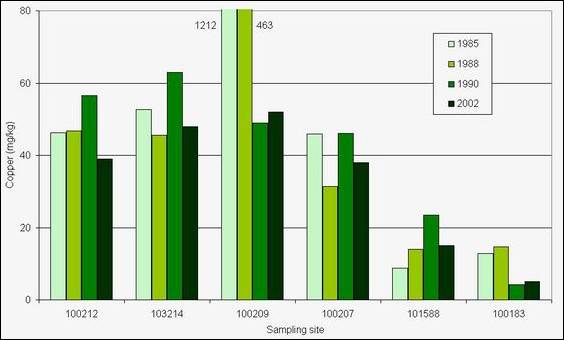
Figure 21: Copper concentrations (mg/kg) in sediments samples from several sites in the upper Whangarei Harbour in 1985, 1988, 1990 and 2002.