7.3 What is the state of coastal hazards?
Natural shoreline dynamics
Shoreline ‘state', that is the trend in the location of the shoreline, can generally be classified into three categories:
· Eroding (shoreline is retreating landward)
· Equilibrium (shoreline is generally stable)
· Accreting (shoreline is extending seaward)
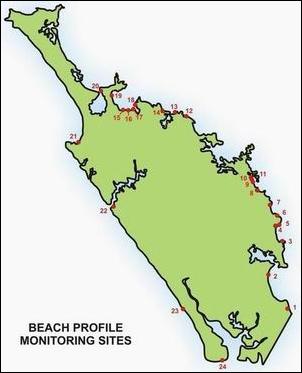
These three states are related to five key factors, namely, sediment supply to the beach, wave energy, sea-level change, location of shoreline and man-made modification to shoreline (i.e. dune system). Twenty-four beaches throughout Northland are monitored on a regular basis, as shown in figure 1 (below). An estimation of their long-term shoreline state is presented in table 3 (below).
Northland's west coast beaches generally display a long-term trend for equilibrium or accretion, with high to moderate sediment supply, high wave energy and largely unmodified shorelines. There are exceptions to this, such as embayed harbour beaches like Omapere which display a long-term trend for erosion, due to variability in sediment supply and extensive man-made modification to the shoreline.
 The state of Northland's east coast beaches is more diverse, due to the greater shoreline complexity and more extensive shoreline modification. The majority of east coast beaches tend to be in an equilibrium state, for example Oakura, Taipa and Taupo Bay. There are also a number of eroding east coast beaches, including Tauranga Bay and Pataua South. Erosion of these systems appears to be largely a function of natural fluctuations in sediment supply coupled with extensive modification of the foredune system.
Figure 1: Beaches included in the beach profile monitoring programme.
Table 3: Beaches monitored as part of the beach profile monitoring programme, with their estimated long-term shoreline state. Note: Numbers correspond to those in figure 1.
| Number in figure 1 | Beach | Record commenced | Generalised shoreline state |
| 1 | Mangawhai spit | 2000 | Equilibrium |
| 2 | Bream Bay | 1976 | Accreting |
| 3 | Pataua South | 1998 | Eroding |
| 4 | Wellingtons (Whangaumu) | 1998 | Eroding |
| 5 | Ngunguru spit | 1998 | Equilibrium |
| 6 | Matapouri | 1998 | Eroding |
| 7 | Whananaki spit | 1998 | Equilibrium |
| 8 | Te Mimiha (Helena) | 1999 | Equilibrium |
| 9 | Teal (Ngawai) | 1999 | Equilibrium |
| 10 | Oakura | 1998 | Equilibrium |
| 11 | Ohawini | 1998 | Equilibrium |
| 12 | Te Ngaire | 2002 | Equilibrium |
| 13 | Tauranga | 2002 | Eroding |
| 14 | Taupo | 1999 | Equilibrium |
| 15 | Hihi | 1999 | Eroding |
| 16 | Coopers Beach | 2003 | Equilibrium |
| 17 | Cable Bay | 2003 | Equilibrium |
| 18 | Taipa | 1990 | Equilibrium |
| 19 | Tokerau | 1990 | Equilibrium |
| 20 | Rangiputa | 1999 | Eroding |
| 21 | Ahipara | 1999 | Equilibrium |
| 22 | Omapere | 2002 | Eroding |
| 23 | Glinks | 1994 | Accreting |
| 24 | Pouto | 1989 | Equilibrium |
Note: The above are indicative observations only. Shorelines may display several states (i.e. erosion and accretion) in different sections of the shoreline.
Recent shoreline dynamics
In the period following the damaging easterly storms of July 2000, the majority of Northland's east coast beaches have been in an accretionary phase. This is consistent with the moderate to weak El Nino conditions that have predominated over the past five years. This phase has enabled dune systems to rebuild and grow seaward under the existence of favourable ‘dune building' conditions, as shown for Ruakaka Beach in figure 2 (below).
Those areas where the foredune complex and native vegetation have been extensively modified are an exception to this trend. In these areas modification of the foredune significantly reduces the ability of the dune to retain sand and grow seaward during accretion phases. As a result the erosion dominates over accretion, causing a long-term trend for shoreline erosion.
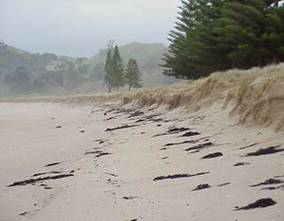
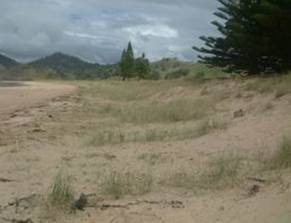
Erosion scarp to Whananaki North beach in July 2000 following erosion (left) and same location in March 2006 following the predominance of weak El Nino conditions demonstrating beach and dune rebuilding (right).
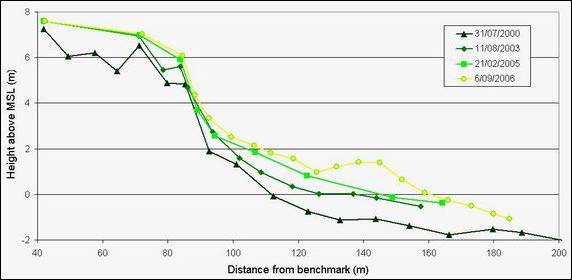
Figure 2: Beach profile survey data for Ruakaka Beach, Bream Bay. The extent of beach rebuilding is apparent in the surveys following the damaging easterly storms of July 2000.
Coastal flooding
Wave-assisted coastal flooding occurs when high tides coincide with intense low-pressure weather systems causing storm surge and wave run-up to temporarily inundate low-lying coastal hinterlands.
Many factors contribute to the potential risk of coastal inundation, including extent of low-lying land, degree of exposure, beach slope, near-shore sea-bed shape among others. A number of Northland coastal communities are exposed to coastal flooding. Projected sea-level rise associated with climate change to year 2100 is likely to substantially increase the extent of areas subject to inundation. This is particularly the case for locations with low topography, particularly low-lying barrier-spit systems and progradational coastal lowlands.
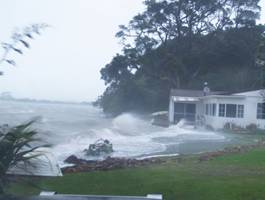
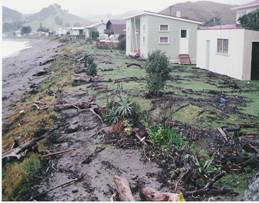
Moderate storm surge event in Ngunguru Estuary in July 2007 (left), photo courtesy of Gloria Bruni, and debris from storm wave run-up causing temporary inundation of low-lying properties at Teal Bay in August 1989 (right).
Tsunami Hazard
A tsunami is a natural phenomenon that results when a large volume of water is displaced causing a series of waves to be generated, most commonly due to earthquakes causing seafloor displacement. Tsunami can devastate coastal communities causing inundation, strong currents, contamination and other effects. Tsunami generally occur as a large, broken low wave or mass of water.
The post-historic record shows that New Zealand has been affected by more than 40 tsunami in the last 150 years. Of these, four moderate tsunami inundated Northland's east coast. One of these events is documented in figure 3 (below). The prehistoric record indicates at least one large event, or a series of large closely-spaced events, have affected Northland's coast in the last 600 years, plus others.
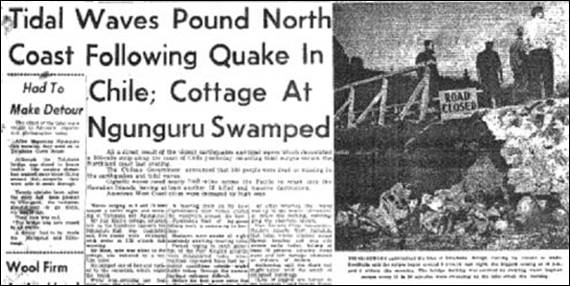
Figure 3: Newspaper article following the moderate 1960 Chile tsunami, sourced from The Northern Advocate.
Tsunami hazard is considered a significant risk for Northland and could affect a number of Northland's coastal communities. A generalised tsunami hazard-risk model for Northland indicates that a moderate hazard and risk exists for most of the northwest and east coast, a high hazard and moderate risk for the north, and a low hazard and risk for the west. The hazard is largely a function of tsunami source, intensity and return period.
Sources from near the South American coast are the most likely to cause a moderate event that would affect most of Northland's east coast, as shown in figure 4 (below), with an annual exceedance probability of around 1 – 2 %.
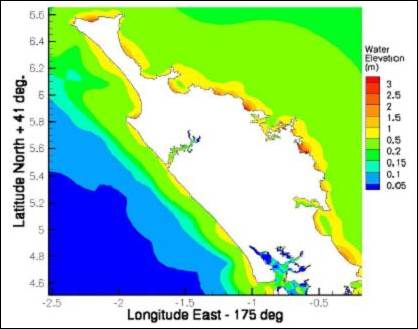
Figure 4: Maximum water surface elevations modelled for a tsunami generated from a magnitude 9.0 earthquake located near the Chilean coast (Image courtesy of NIWA).
Hazard zones
Coastal hazard zones (CHZ) identify areas of coast that may be subject to coastal hazards, usually erosion and/or coastal flooding. CHZ enable local authorities to better plan and manage coastal development in areas susceptible to coastal hazards by providing for building set back and/or restrictions on the type of development that is permitted. CHZ have been derived for more than 24 coastal settlements in Northland and incorporated in the district planning maps.
To assess the state of coastal hazards, based on the amount of property and development within CHZ, a GIS-based analysis was undertaken of coastal communities within the zones to determine:
· The number of properties and dwellings in coastal hazard zones.
· The capital values of properties in coastal hazard zones.
· The setback distance from the coastline of each dwelling located in a coastal hazard zone.
Approximately 638 dwellings are located within or partially within identified coastal hazard zones, indicating a probability of exposure to risk from coastal hazards (i.e. erosion and/or coastal flooding) within a timeframe of the next 50 to 100 years.
Mean setback distances of dwellings within hazard zones range from 11 metres at Matapouri Beach to a maximum of 89 metres at Tokerau Bay shown in table 4 and figure 5 (below).
Table 4: Summary of setback distances and number of dwellings within identified coastal hazard zones.
| Community | Mean setback of dwellings from shoreline (m) | Number of dwellings in CHZ 1 | Number of dwellings in CHZ 2 | Total number of dwellings in CHZ's |
| Teal Bay | 11 | 8 | 10 | 18 |
| Matapouri | 12 | 18 | 1 | 19 |
| Tauranga Bay | 13 | 4 | 2 | 6 |
| Cable Bay | 14 | 2 | 0 | 2 |
| Taiharuru | 17 | 7 | 1 | 8 |
| Ohawini | 18 | 7 | 8 | 15 |
| Pataua Estuary | 20 | 22 | 28 | 50 |
| Taupo Bay | 21 | 30 | 5 | 35 |
| Te Ngaire | 21 | 13 | 3 | 16 |
| Oakura | 23 | 48 | 33 | 81 |
| Whangaumu | 25 | 3 | 12 | 15 |
| Omapere | 26 | 17 | 15 | 32 |
| Pataua North | 35 | 22 | 15 | 37 |
| Taipa | 36 | 0 | 28 | 28 |
| Langs Beach | 38 | 4 | 0 | 4 |
| Rangiputa | 38 | 16 | 25 | 41 |
| Coopers Beach | 39 | 21 | 14 | 35 |
| Opononi | 41 | 0 | 21 | 21 |
| Ahipara | 45 | 25 | 11 | 36 |
| Bland Bay | 53 | 0 | 4 | 4 |
| Helena Bay | 59 | 2 | 2 | 4 |
| Hihi | 68 | 1 | 16 | 17 |
| Ruakaka | 77 | 1 | 5 | 6 |
| Tokerau | 89 | 1 | 107 | 108 |
| Totals | 272 | 366 | 638 |
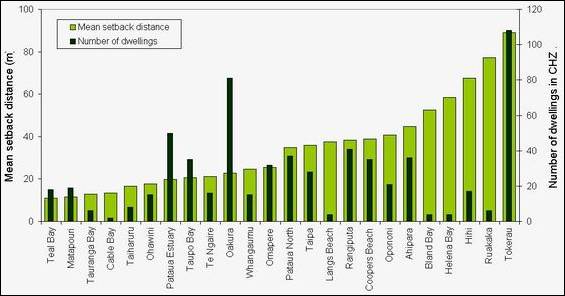
Figure 5: Mean setback distances of dwellings from high tide within designated coastal hazard zones and total number of dwellings within coastal hazard zones.
Approximately 1,092 properties are located within, or partially within, identified coastal hazard zones. The total capital value of these properties is approximately $453 million. The market value of these properties is likely to be much higher.
Total capital values of properties for communities within identified coastal hazard zones ranged from $1.2 million at Helena Bay to $49.9 million at Oakura Bay shown in figure 6 and table 5 (below).
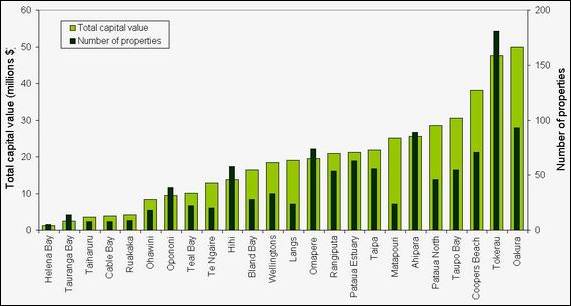
Figure 6: Total capital values (based on 2006 data) of properties within hazard zones and number of properties within coastal hazard zones.
Table 5: Capital value of property located within coastal hazard zones.
| Community | Property count | Total capital value ($) | Mean capital value ($) |
| Helena Bay | 5 | 1,181,500 | 236,300 |
| Tauranga Bay | 14 | 2,480,000 | 177,143 |
| Taiharuru | 8 | 3,590,000 | 448,750 |
| Cable Bay | 8 | 3,929,400 | 491,175 |
| Ruakaka | 9 | 4,254,000 | 472,667 |
| Ohawini | 18 | 8,422,000 | 467,889 |
| Opononi | 39 | 9,401,000 | 241,051 |
| Teal Bay | 22 | 10,020,000 | 455,455 |
| Te Ngaire | 20 | 12,817,000 | 640,850 |
| Hihi | 58 | 13,729,500 | 236,716 |
| Bland Bay | 28 | 16,475,000 | 588,393 |
| Wellingtons | 33 | 18,459,000 | 559,364 |
| Langs | 24 | 19,136,000 | 797,333 |
| Omapere | 74 | 19,471,000 | 263,122 |
| Rangiputa | 54 | 20,891,200 | 386,874 |
| Pataua Estuary | 63 | 21,270,000 | 337,619 |
| Taipa | 56 | 21,827,000 | 389,768 |
| Matapouri | 24 | 25,054,000 | 715,829 |
| Ahipara | 89 | 25,576,900 | 287,381 |
| Pataua North | 46 | 28,545,000 | 620,543 |
| Taupo Bay | 55 | 30,506,500 | 554,664 |
| Coopers Beach | 71 | 38,203,000 | 538,070 |
| Tokerau | 181 | 47,612,500 | 263,052 |
| Oakura | 93 | 49,860,000 | 536,129 |
| Sum | 1092 | $452,711,500 |