14.2 What are the pressures on our soil and land resources?
Land use
Northland's land cover is dominated by grassland (Land Cover Database 2) and therefore presumably pastoral farming, with 48% of the region in grassland (predominantly high production grassland), as shown in table 1 (below). There were only small percentage changes in land use between 1997 and 2002 (also shown in table 1).
Table 1: Proportion of different land uses in Northland in 1997 and 2002 based on the land cover classes in LCDB1 and 2 and the percentage difference between 1997 and 2002. Data source: LCDB, Ministry for the Environment.
LCDB1 (1997) |
LCDB2 (2002) |
||||
| Land use based on land cover | Area (Ha) | % of region | Area (Ha) | % of region | % differ |
| High production pastoral farming | 599709 | 46.4 | 593169 | 45.9 | -1.1 |
| Low production pastoral farming | 26812 | 2.1 | 26394 | 2.0 | -1.6 |
| Exotic forestry | 172411 | 13.3 | 181761 | 14.1 | 5.4 |
| Other exotics | 10385 | 0.8 | 10182 | 0.8 | -1.9 |
| Horticulture | 9264 | 0.7 | 9265 | 0.7 | 0.0 |
| Indigenous forest | 274761 | 21.3 | 273434 | 21.1 | -0.5 |
| Other native (scrub etc) | 119298 | 9.2 | 118501 | 9.2 | -0.7 |
| Urban area | 7406 | 0.6 | 7439 | 0.6 | 0.5 |
| Water (rivers, lakes & estuaries) | 72122 | 5.6 | 72026 | 5.6 | -0.1 |
| Other land cover classes | 669 | 0.1 | 665 | 0.1 | -0.6 |
Currently the most recent land use data available for Northland is the Land Cover Database 2 (LCDB2) data that was created from satellite imagery captured over the 2001/2002 summer. However it is hoped that Ministry for the Environment will continue to ensure that this data is collected regularly at a national level and made available to regional councils.
The other land use data available for Northland is the Agricultural Production Statistics collected by Statistics New Zealand. There is land use data for Northland for six years from 1994 to 2006, as shown in table 2 (below). Note: caution should be taken interpreting the results as the population size is inconsistent for each year.
Table 2: Land use in Northland at 30 June of each year for various years from 1994 to 2006, based on the results from Agricultural Production surveys conducted by Statistics New Zealand.
Area (000 Hectares) |
||||||
| Land use | 1994a | 1995b | 1996b | 2002a | 2003b | 2006b |
| Grazing, arable, fodder and fallow land | 616 | 621 | 607 | 516 | 486 | 488c |
| Horticultural land | 6 | 6 | 7 | 5 | 5 | NA |
| Planted production forest | 148 | NA | NA | 193 | 174 | 158 |
| Other land | 98 | 83 | 90 | 121 | 126 | 126 |
| Total land | 867 | 861 | 855 | 836 | 794 | 782 |
a In 1994 and 2002 full Agricultural Production Censuses were carried out.
b In 1995, 1996, 2003 and 2006, sample surveys were carried out which are subject to sampling errors.
c This figure for 2006 only includes the area in grassland, it excludes the area in grain, seed and fodder crop.
This data shows an increase in forestry area in Northland in this 12 year period and a decrease in the amount of grazing, arable, fodder and fallow land.
Agriculture
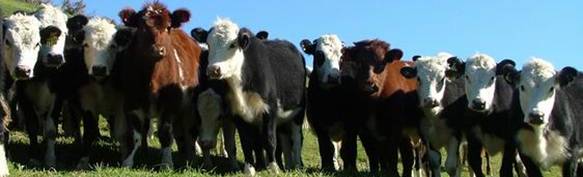
Pastoral farming is still the predominant land use in Northland. Over recent decades there has been a movement away from sheep production and an increase in dairying. Decreases in stock numbers have been offset to an extent by increases in productivity across all parts of the pastoral sector, both in terms of production per animal and production per hectare. Despite these productivity gains, sheep and beef model farm data (MAF 2005) shows that productivity and profitability of Northland farms was low on a per hectare basis when compared with other regions.
The number of sheep in Northland has greatly decreased over the last 18 years, from about 1.3 million in 1990 to 534,000 in 2007, as shown in figure 1 (below). The number of beef cattle decreased up to 2004, since then the number has increased slightly, with an overall decrease of about 100,000 in the 18-year period from 1990 to 2007. The number of dairy cattle in Northland has fluctuated slightly over the last 18 years but stayed relatively stable with an average of 375,000. The decrease in sheep numbers and slight decrease in beef cattle is consistent with elsewhere in New Zealand. However dairy cow numbers for all of New Zealand have increased by 24% in the 10 years from 1996 to 2006 (MFE 2006).
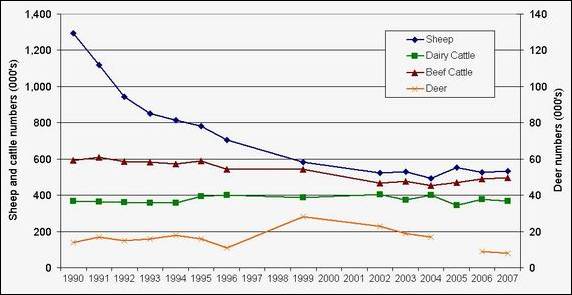
Figure 1: Stock numbers in Northland, including sheep and dairy and beef cattle (left axis) and deer (right axis) at 30 June of each year. Note: data is not available for some years. Data source: Statistics New Zealand.
As farming becomes more intensive it can result in a reduction of water quality, soil health and an increase in some greenhouse gas emissions (MFE 2008). Intensification of pastoral farming has lead to a greater area of fodder and grain cropping in Northland, particularly maize (Doug Foster, Northland Regional Council, pers. comm.). This can lead to long term deep soil compaction and damage to soil structure when either long maturing varieties or late plantings are harvested with heavy equipment late in autumn, when soil conditions are too wet.
Treading by grazing animals can have a significant adverse effect on soil properties and on plant growth under wet soil conditions (Ussher 2004). The most severe treading is when pasture and soil are reduced to a visual muddy mess with pugging damage. This is common on Northland's heavy clay soils, particularly in late autumn and winter. This treading/pugging damage can lead to reduced yield, shallow rooting and nutrient loss from the pasture, damage to the physical, chemical and biological properties of the soil and increased run-off into waterways (Ussher 2004).
Approximately 375,000 tonnes of fertiliser was applied in Northland in the year ending 30 June 2002 (Statistics NZ), as shown in table 3 (below). This is predominantly lime with approximately 212,000 tonnes applied in the 2001/2002 year. Lime application is important for maintaining soil condition and has minimal risk of adverse effects on the environment (Bob Cathcart, NRC, pers. comm.). This equates to approximately 730 kg of total fertiliser per hectare (including 410 kg of lime) based on the area of grazing in Northland at 30 June 2002, as shown in table 3. Note: this does not include horticultural and forestry land uses, which also use these fertilisers but to a much lesser extent.
Table 3: Fertiliser (including lime) applied in Northland in the year ending 30 June 2002 (tonnes) and the amount applied per land in pasture (kg/ha) for the amount of grazing, arable, fodder and fallow land use in Northland at 30 June 2002 (Agricultural Production Census 2002, Statistics NZ).
| Fertiliser applied (tonnes) | Amount per area of pasture (kg/ha) | |
| Land area in grazing, arable, fodder and fallow (ha) | 516,000 | |
| Urea | 17,732 | 34 |
| Di-ammonium phosphate (DAP) | 5,712 | 11 |
| Ammonium sulphate | 2,267 | 4 |
| All other Nitrogen containing fertilisers | 16,231 | 31 |
| Lime | 211,758 | 410 |
| Phosphatic fertilisers | 84,507 | 164 |
| Potassic fertilisers | 36,909 | 72 |
| Total | 375,116 | 727 |
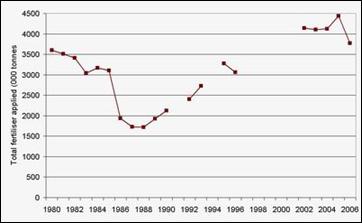 Regional trends in fertiliser usage can be estimated from national usage. Total fertiliser applied in NZ has increased significantly in the last 20 years, as shown in figure 2 (right).
Figure 2: Total fertiliser (including lime) applied in New Zealand (000's tonnes) from 1980 to 2006. Data: Statistics NZ.
Other land uses
Exotic forestry has positive effects on soil erosion and subsequent water quality when the trees are growing and fully established. However, during harvesting short periods of increased erosion occur due to the loss of vegetative cover. In the long term however, the positive effects of exotic forestry on soil conservation outweigh the negative effects of short-term erosion during harvesting.
The region has a well developed horticultural industry, centred mainly on the growing of avocados, citrus, kiwifruit, kumara, squash and flowers. In 2002 approximately 5,100 ha of Northland was used for horticulture and a further 3,000 ha was used for arable and fodder crop land (Stats NZ 2002). If not managed correctly, cropping can result in soil loss and degradation.
Since 1994 there has been a significant increase in the area planted in avocados and grape vines and a significant decrease in the area planted in squash and apples, as shown in table 4 (below). Again, caution should be taken interpreting the results as the population size is inconsistent for each year. The increase in the area planted in avocados and grape vines and decrease in the area of apples is consistent with national figures.
Both viticulture and avocado orchards have the potential to have detrimental effects on the environment, particularly soil health (Everett and Timudo-Torrevilla 2006; Gabzdylova et al. 2006). Copper is the only fungicide registered to control avocado rots in orchards and there are concerns about the impact of copper on the environment because it does not readily degrade (Everett and Timudo-Torrevilla 2006). Copper levels in New Zealand soils can approach levels that are detrimental for the environment (Guernsey et al. 2004). There is currently national research being carried out to reduce copper use in avocado orchards (Everett and Timudo-Torrevilla 2006; Guernsey et al. 2004).
Table 4: Areas planted for some crops in Northland at 30 June of each year. Note: data for many crops is not available such as kumara and citrus and therefore the sum of the data for each year in table 2 is not the total area of Northland in horticultural land use. Data source: Statistics NZ.
| Total area planted in (ha) | 1994 | 2002 | 2003 | 2005 | 2007 |
| Apples | 118 | 71 | 47 | NA | 30 |
| Avocados | 331 | 939 | 1013 | 1001 | 1325 |
| Kiwifruit | 715 | 605 | 601 | 520 | 634 |
| Olives | NA | 146 | NA | NA | 231 |
| Onions | 38 | NA | NA | NA | NA |
| Potatoes | 102 | NA | NA | 11 | 31 |
| Squash | 952 | 104 | 102 | NA | 25 |
| Wine grapes | 27 | 53 | 53 | 72 | 121 |
Mining of non-metallic minerals is a significant contributor to the regional economy. High quality ceramic clay operations are based at Matauri Bay. Limestone is recovered for agricultural purposes and cement manufacturing. The Portland quarry and associated cement works south of Whangarei is the largest in the country. The extraction of aggregate for roading and concrete manufacturing is the region's largest mining industry, with 2.5 million tonnes produced in Northland in 2006 (MED 2006).
Subdivision development
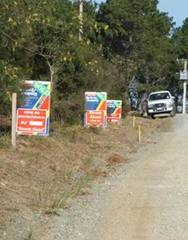 In recent years large areas of land in Northland with prime soils for agricultural and horticultural land use (i.e. rich, free-draining volcanic soils) have been subdivided into lifestyle blocks and for urban development. In most cases this renders it unavailable for sustainable horticultural and agricultural land uses. This is obvious in the areas of Maunu, Kamo and Glenbervie in Whangarei and around Kerikeri in the Far North. Prime soils for horticultural and agricultural land uses include soils classed as 1c1, 2e1, 2w1, 2s1, 3e1, 3s1 or 3s2 in the land resource inventory (Harmsworth 1994; Clarke et al. 1996).
Based on resource consent data for land subdivision from January 2001 to October 2006 for Whangarei District, from June 2002 to February 2007 for Far North District and up to July 2005 for Kaipara District, approximately 9% of Northland's prime soils have been subdivided into 2,209 lots over the last six years, with an average lot size of about two hectares, as shown in table 5 (below).
Table 5: Area of prime soils by district, with the number of resource consents approved for subdivision within these areas, and the number of lots and area associated with these consents.
| Area of prime soils (ha) | No. of resource consents | No. of lots | Average no. of lots | Total area of lots (Ha) | Average lot size (ha) | |
| Whangarei | 12,068 | 279 | 830 | 2.9 | 1833 | 2.2 |
| Kaipara | 3,643 | 12 | 46 | 3.83 | NA | NA |
| Far North | 33,168 | 347 | 1333 | 3.84 | 2530 | 1.9 |
| Total | 48,879 | 990 | 2,209 |
Future development
Whangarei District Council carried out and reported on a detailed analysis of development trends in the Whangarei District (WDC 2007). The report states that subdivision activity in the district over the past five years has been high and is likely to continue into the future.
The report shows schematic images of what three coastal areas are estimated to look like in the future, based on lots that have already been subdivided but not necessarily built on today (2007), all being occupied in the future. Examples of the images are shown below for One Tree Point in 2007 (figure 3) and in the future (figure 4).
As can be seen from the images the visual attributes of One Tree Point and other similar areas undergoing extensive subdivision development will be significantly altered once all lots are occupied. There will be effects on the natural character, open space, visual amenity and ecological values, as well as significant implications relating to the provision of infrastructure (WDC 2007).
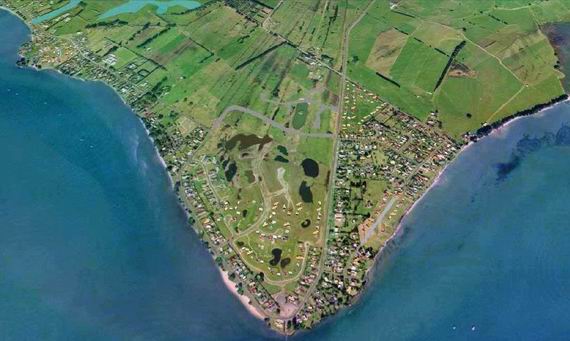
Figure 3: Approximate housing development in One Tree Point, Whangarei in 2007. Source: WDC 2007, pg 26.
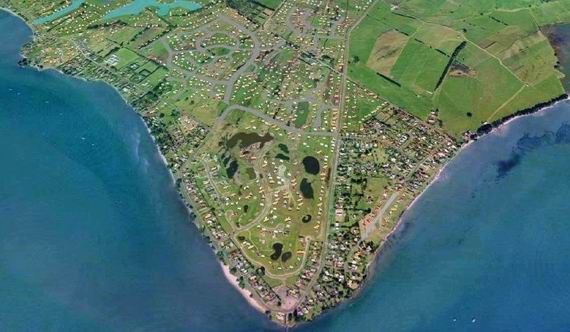
Figure 4: Estimated housing development in One Tree Point, Whangarei in the future (based on subdivision lots already created all being occupied). Source: WDC 2007, pg 27.
The detailed report on development trends in Whangarei district is available on the Whangarei District Council's website:
Land use consents
 Land use consents can give an indication of the main types of pressures on soil conservation and quality. Land disturbance consents in Northland are mainly sought for excavation, extraction or vegetation clearance work and the placement of structures. Land use consents for these latter types of activities are required when there is the potential to cause:
· An increase in erosion
· Significant or long term degradation of water quality
· Increased flood risk
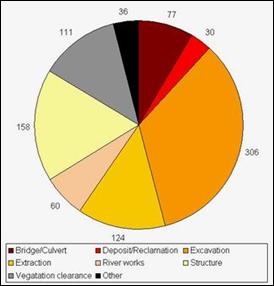
At 1 January 2007 there were 902 land use consents in Northland as shown in figure 5 (right).
Figure 5: Land use consents at 1 January 2007 (below).
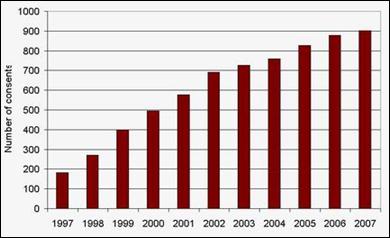
The number of current land use consents in Northland has steadily increased since 1997 as shown in figure 6 (below). This is likely to be a result of increasing economic activity in the region and therefore an increase in consent applications being received by the Council for land use activities such as subdivisions, roading and quarries.
Figure 6: Number of land use consents current at 1 January of each year in the Northland region.
The percentage of significant non-compliance for land use consents (including vegetation clearance, earthworks, quarries and bridge/culvert construction) has decreased over the last four years, as shown in figure 7 (below). This is likely as a result of increased environmental awareness amongst consent holders, forestry companies and earthworks operators, through the Council taking formal enforcement action on non-compliance and carrying out education in the form of workshops, field days, site visits and publications.
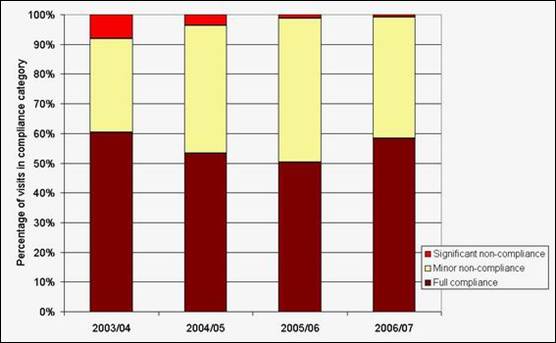
Figure 7: Consent compliance for land use consents
Soil contamination
Cadmium in Northland soils
Cadmium is a non-essential heavy metal that naturally occurs at low concentrations in the environment (MAF 2007). Naturally soils in New Zealand have average cadmium levels of 0.16 mg/kg soil (MAF 2007). Phosphate rock, from which phosphate fertilisers are made, contains cadmium, as a trace impurity, at higher levels than this. Ongoing addition of phosphate fertilisers leads to an accumulation of cadmium. Horticulture, cropping, forestry and pastoral agriculture in New Zealand are reliant upon the application of phosphate fertilisers to maintain economic levels of production.
The reason for monitoring cadmium levels stems from a primary concern over human health and possible economic impacts of losing markets if cadmium levels in primary produce exceed acceptable levels (MAF 2007). Low levels of cadmium in the diet can accumulate over a person's lifetime. The New Zealand Food Safety Authority has estimated the amount of cadmium in the diet of the average New Zealander is at a level far below that which would cause adverse health effects (MAF 2007). However there is evidence that cadmium levels in NZ soils, including Northland, are increasing.
A national study measured the cadmium level of 1,794 soils throughout NZ, including 24 samples from Northland (Taylor et al. 2007). The results indicate that land use was a key driver of topsoil cadmium concentrations. The average cadmium concentration for the Northland soils sampled was 0.33 mg/kg, while nationally the averages for other regions ranged from 0.17 to 0.66 mg/kg (Taylor et al. 2007).
The phosphate rock used in the manufacture of phosphate fertilisers for the New Zealand market has traditionally been from Nauru Island. This source had levels of cadmium that were high by international standards (MAF 2007). A voluntary industry limit on cadmium content in phosphate fertiliser has led to phosphate rock being sourced from other areas. Lower cadmium levels in fertiliser will reduce the rate of accumulation in soils.
The national study on cadmium levels in NZ soils recommended that monitoring of Northland soils is continued with an increase of sites to 50 and the monitoring of fluorine levels as well as cadmium (Taylor et al. 2007). The working group also recommended that a national cadmium strategy should be developed, supported by all stakeholders in order to mitigate future risks from cadmium (MAF 2007).
For more information on contaminated sites in Northland refer to the Waste Hazardous Substances chapter of this report.
Environmental Incidents
All environmental incidents reported to the Council are categorised by what resource is affected as well as type. Some examples of types of incidents recorded as potentially affecting land resources in Northland are:
· Oil, diesel or hazardous substance spills, which can have significant impact on soil quality.
· Earthworks and vegetation clearance, which can increase erosion.
Fifteen percent or less of incidents impacting on land resources every year have a significant or large impact on Northland's soil and land resources, as shown in figure 8 (below) .
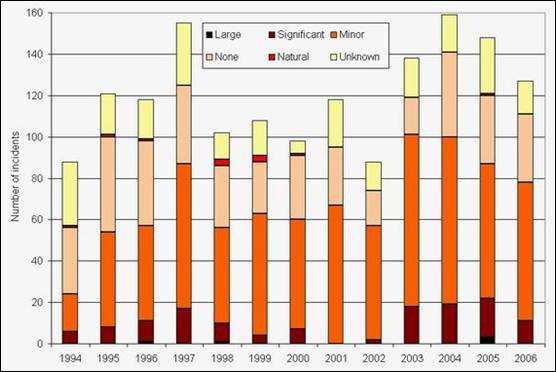
Figure 8: Number of land environmental incidents with their recorded impact on the environment from 1994 to 2006.
Earthworks and vegetation clearance incidents
Almost a third of incidents affecting land reported to the Council every year are incidents relating to earthworks and vegetation clearance, as shown in figure 9 (below). There has been a slight decrease in the number of earthworks and vegetation clearance incidents that affect land resources in Northland from 2004 to 2006. Again this is likely to be as a result of increased environmental awareness through Councils advocacy and education. Inappropriate land management practices when carrying out these activities can cause severe erosion, potentially resulting in land slides, increased sediment discharge and reduced water quality or increased flood risk.
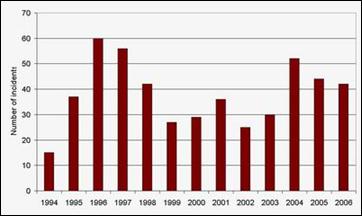
Figure 9: Earthworks and vegetation clearance incidents affecting land resources in Northland from 1994 to 2006.
Pests and weeds
Typically Northland is weedier than elsewhere in New Zealand due to earlier settlement (Bob Cathcart pers. comm.). In areas of early settlement in Northland, such as Mangonui, Whangaroa, Kohukohu, Rawene and Russell, garden plants have had longer to acclimatise and escape into the surrounding environment.
Northland's warm temperate climate and high rainfall also provides conditions that make it vulnerable to a wide range of animal pests and weeds. A wide range of pests and weeds are already established in the region. A predicted climate change forecast, which will see the region warming and becoming drier, will make the region more favourable for weed species. Already established weed and pest species and new organisms are impacting on agriculture, horticulture and the environment, such as tropical grass webworm and guava moth.
 For more information on the impact of pests and weeds on Northland's indigenous biodiversity and ecosystems refer to the Indigenous Biodiversity chapter.
Weed species
There is a wide range of weed species present in Northland that impacts on productive land use and in some cases limits options for land use. Weeds can impact both economically and environmentally on farm performance. Weed species will compete with more desirable species for space, water and nutrients, some are poisonous to stock and prolific weed growth can lead to poor quality pasture which is more vulnerable to erosion.
On the other hand there is evidence that pasture weakened from overgrazing by sheep or damaged by insects (e.g. grass grub) can become infested by wind-blown species such as nodding thistle. A change in pasture management, such as from sheep to dairy cattle, can reduce the infestation of nodding thistle.
Most of the pest plants in Northland that have significant impacts on agriculture, horticulture and the environment are those identified in the Regional Pest Management Strategy (RPMS) for Northland (NRC 2003). At December 2007, this included 15 species with individual strategies, a strategy for five aquatic plants and a strategy for 12 surveillance plants (‘dirty dozen').
The ‘dirty dozen' are 12 major pest plants, which are in other regions of NZ but not yet recorded in Northland, with the exception of the one site of evergreen buckthorn in Matakohe. It includes the following 12 surveillance plants from the RPMS (see section 5.15) that are unwanted in Northland:
1. eelgrass (Vallisneria gigantea)
2. senegal tea (Gymnocoronis spilanthoides)
3. hydrilla (Hydrilla verticillata)
4. nardoo (Marsilea mutica)
5. water poppy (Hydrocleys nymphoides)
6. needlegrass (Stipa tenuissima)
7. skeleton weed (Chondrilla juncea)
8. evergreen buckthorn (Rhamnus alaternus)
9. old man's beard (Clematis vitalba)
10. houttuynia (Houttuynia cordata)
11. entire marshwort (Nymphoides geminata)
12. fringed water lily (Nymphoides peltata)
They are all invasive species which can have detrimental effects on agriculture, horticulture and the environment. For example: senegal tea and nardoo are both poisonous aquatic plants; old man's beard smothers and kills other plants; skeleton weed is a major potential weed for crops, choking harvesting equipment; and needlegrass is a major potential weed of farmland, gardens and the coastal environment.
Table 6 (below) shows some of the invasive species in the RPMS with two scores that give an indication of the weed's relative importance: biological success rating and weediness rating (Esler et al. 1993). Biological success ratings are associated with the plant's ability to establish and spread (out of 21), while weediness (or weed status ratings) refers to the nuisance value of the plant (out of 24). For example, high scores in both would make a plant high priority for management as it can easily spread and establish in new areas and is of high nuisance value.
Table 6: Plants in Northland Pest Plant Management Strategy, (excluding the aquatic pest plants, plants that are controlled in a Community Pest Control Area and surveillance plants (dirty dozen)).
| Pest plant | Biological success1 (out of 21) | Weediness1 (out of 24) | Problems caused |
| African feather grass (Pennisetum macrourum) | 20 | 18 | Invades poor pasture areas, roadsides and reserves. Can suppress other plants and restrict the movement of animals, people and machinery. |
| Bathurst bur (Xanthium spinosum) |
10 | 8 | Its burs devalue wool and its spines can injure stock, Young plants can also be toxic to stock. Dense stands can impede harvesting of crops |
| Broom (Cystisus scoparius & Teline monspessulana) | 12 | 12 | Invades pasture, plantation forests and regenerating native ecosystems. |
| Gorse (Ulex spp.) | 15 | 19 | Hardy; colonises new areas quickly, forming dense thickets. Provides cover for other pests and restricts the movement of stock and people. |
| Lantana (Lantana camara var. aculeate) | 19 | 18 | Forms dense impenetrable thickets. Invades pasture, roadside and bush edges, replacing other vegetation. Poisonous to stock and humans. |
| Manchurian ricegrass (Zizania latifolia) | 19 | 18 | Blocks drains, causes flooding and invades pasture, causing lowered livestock production. |
| Moth plant (Araujia sericifera) | 15 | 13 | Vigorous climbing plant, smothers trees and breaks their branches with its weight. Spreads over considerable distances. |
| Nassella tussock (Stipa trichotoma) | 14 | 14 | Invades pasture, reducing productivity and generally unpalatable to stock. |
| Pampas grass (Cortaderia selloana and C. jubata) | 16 | 17 | Forms dense impenetrable stands, excludes other vegetation, creates a fire risk and provides habitats for vermin. |
| Privet (Ligstrum lucidum and L. sinense) | 11 | 13 | Scent can impact on human health. Toxic to stock and can restrict native plant regeneration. |
| Ragwort (Senecion jacobaea) | 15 | 14 | Quickly invades land, reducing productivity and is toxic to stock. |
| Spartina (Spartina alterniflora, S. anglica and S. x townsendii) | 15 | 15 | Forms dense mats in harbours, which causes silt to accumulate and severely affects marine life. Can cause flooding. |
| Thistle (Carduus nutans and Cirsium arvense) | 13 15 |
11 11 |
Invades pasture and is capable of total ground cover. |
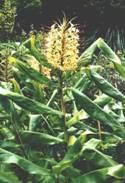
| Wild ginger (Hedychium garderianum and Hedychium flavescens) | 18 15 |
14 12 |
Forest invader, which smothers small plants and prevents forest regeneration. Can contribute to erosion on steep land. |
1. Both the biological success rating and weediness rating are part of the Esler, Liefting and Champion Weediness Index (Esler et al. 1993).
Pest animals
Four pest animal species impact on farm production through both competing with stock for feed and making land more prone to erosion. Rabbits, goats, pigs and possums all potentially impact directly or indirectly. Overgrazing makes soil more vulnerable to erosion and increases the rate of sediment loss to waterways. Possums, goats and pigs all impact on the health of forest remnants, grazing on the understorey vegetation and damaging mature trees, reducing the value of these areas as buffers during heavy rainfall events.
Overall rabbit numbers are relatively low in Northland when compared with other regions in NZ. They cause the most problems in areas with lighter volcanic or sandy soils and numbers fluctuate from year to year dependent upon weather conditions. Numbers build up through summer and drop off in winter. The worst affected areas are coastal sands where numbers can reach levels that seriously affect vegetation cover and can lead to sand drift erosion.
Pigs, possums and goats sometimes cause problems where grazing land adjoins areas of bush. The bush provides cover for the animals which then emerge onto the pasture to graze. Goat control work carried out in Northland in recent years has reduced the size of goat mobs and restricted them to a fewer areas, meaning that damage to pasture is currently rare. Pigs are most likely to cause damage to pasture in the winter months. Possums are being controlled where cooperating landowners work together in community pest control areas.
Pest insects
Pest insects can also have significant impacts on agriculture, horticulture and the environment. Some of the more significant pest insects found in Northland are the tropical grass webworm, Argentine ant and guava moth.
 Severe infestations of the tropical grass webworm, Herpetogramma licarsisalis, were seen on the Aupouri Peninsula in March 1999. If there is a boom in webworm numbers severe damage can be caused to kikuyu pasture and the webworm population can quickly spreads to other pastures. There is usually a seasonal trend in topical grass webworms, with the population growth being related to climatic conditions, with numbers increasing dramatically in warm moist summers.
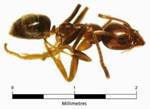
Argentine ants (Linepithema humile) are among the 100 most invasive species on earth. First discovered in New Zealand in 1990, they are believed to have reached Northland via potted plants, freight or wood and are now found throughout the region, especially in urban areas. Argentine ants can form super-colonies of immense size and threaten the region's environment and economy as well as the lifestyle Northlanders enjoy. In New Zealand Argentine ants threaten native insects, lizards and native birds, either attacking them directly or by competing for food like nectar and honeydew.
The guava moth (Coscinoptycha improbana) is a native of Australia. It was first found in Kaitaia in 1997 and is now found north of, and including, Whangarei City, Maungatapere and Whangarei Heads. The guava moth lays its eggs at the ends of fruit, from which the caterpillar hatches out and burrows into the fruit. The caterpillar feed within the ripening fruit producing excrement and encouraging the growth of fungus. Guava moth infests fruit all year round, including yellow guava, feijoa, citrus, plums, peaches, nashi pear and macadamia nuts.