11.3 What is the state of groundwater?
Monitoring and investigation is required to gain an understanding of the extent, quality and quantity of Northland's groundwater resources. This is in order to identify environmental issues and trends and promote informed environmental decision-making.
 The state of the groundwater resource in Northland can be investigated by a number of methods. These include:
· Assessment of groundwater resource characteristics – drilling investigations and pump tests.
· Monitoring and assessing the quantity of groundwater resource, including monitoring taking and drilling activities, recharge and groundwater levels
· Monitoring water quality in a groundwater resource.
· Specific issue-based investigations.
Assessment of groundwater resource characteristics
 Drilling investigations and pump testing has been carried out throughout Northland to identify the basic characteristics of the groundwater resources. A summary of the aquifer characteristics for the principal groundwater resources is shown in table 2 (below). Specific investigations and bore surveys have also been carried out for a number of aquifers to gain an understanding of sustainable yields, refer to section 12.4.
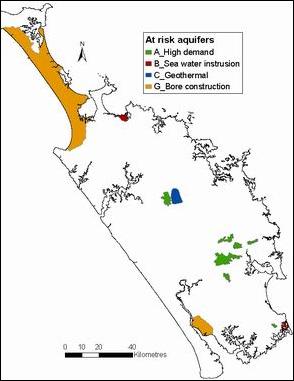
The location of the aquifers identified in the Regional Water and Soil Plan as "at risk" are shown in figure 4 (right). There are other groundwater resources throughout Northland, however, these are either relatively small or have not been identified as "at risk" due to low water demand or potential risk of saltwater intrusion or bore construction.
Figure 4 (right): Aquifers identified as "at risk".
Table 2: Summary of the aquifer characteristics for principal aquifers in Northland.
| Aquifer (zone) | Broad lithologic description | Status | Saturated thickness (m) | Transmissivity (m2/day) | Storativity % |
| Aupouri (Lower Aupouri peninsula) |
Predominantly quartz and feldspar sands overlying limestone/ sandstone/mudstone | Semi unconfined to confined | 12-90 | 12-850 | 0.07-0.00002 |
| Kerikeri/ Kaikohe |
Basalt overlying cretaceous siltstone | Semi confined | 50 | 70-170 | 0.020-0.072 |
| Whangarei (Matarau) | Basalt flows, cones and dikes overlying sandstone/mudstone | Semi unconfined | 8-20 | 108-3660 | |
| Whangarei (Glenbervie) |
Taheke Basalt overlying greywacke/ interbeded sandstone and mud stones | Semi confined | 20-83 | 1 –36.78 | 0.002 |
| Whangarei (Maunu) | Taheke Basalt overlying sandstone/mudstone | Semi unconfined | 8-58 | 30 – 89 | 0.002-0.0006 |
| Whangarei (Maungatapere) |
Basalt with scoria overlying sandstone/mudstone | Semi confined | 11-58 | 25-45 | |
| Whangarei (Whatitiri) |
Taheke basalt overlying sandstone | Confined | 4-30 | 25-4000 | 0.00004-0.0003 |
| Whangarei (Maungakaramea) |
Basalt overlying Micaceous sandstone | Semi unconfined | 45-55 | 3-400 | 0.03 |
| Whangarei (Three mile bush) |
Basalt with scoria overlying sandstone/mudstone | Semi unconfined | 8-55 | 3 – 80 | 0.04 |
| Mangawhai | Consolidated unweathered sands with quartz alluvial mud and gravel | Unconfined | 8-50 | 5-440 | 0.00015-0.08 |
| Taipa | Sand feldspathic with some quartz | Unconfined | 6 to 7 | 90 – 150 | 0.085-0.2 |
| Tara | Basalt flow with underlying sedimentary rocks | Semi unconfined | 4-20 | 38-66 | |
| Russell | Gravels overlying Waipapa group greywacke | Unconfined to semi unconfined | 148-176 | ||
| Other shallow coastal aquifers | Predominantly sands/alluvial mud and gravel. | Unconfined |
Groundwater quantity
Groundwater recharge and discharge
The main source of recharge for the aquifers in the region is rainfall. Lake water loss has been identified as a minor source of groundwater recharge in some areas of Northland (e.g. Pakaraka and Aupouri).
Groundwater recharge tends to occur in winter months due to higher seasonal rainfall and decreased evapotranspiration. Generally drier summer conditions has minimal effect on groundwater levels, but drier than normal winter rainfall conditions result in reduced groundwater recharge and low groundwater levels at the start of the following summer.
Northland's highly variable geology has a major influence on surface water flow regimes and degree of groundwater recharge. In permeable unconfined sand aquifers, a high percentage of rainfall infiltrates quickly into the ground recharging the groundwater. In these areas there is minimal rainfall runoff contributing to stream flow. On the Aupouri Peninsula, the sand aquifer contributes little to stream baseflow as the groundwater level is typically below the stream bed level. The sand aquifers predominantly discharge at or near the coast.
The basalt aquifers in Northland generally have relatively rapid infiltration due to the fractured nature of the geology, and the existence of scoria cones. The predominant discharge from the basalt aquifers is spring flow originating on the edge of the basalt fields. This type of aquifer has considerable storage and the spring flow is generally maintained during dry periods. Spring flow is a major contribution to stream baseflow in the basalt areas.
 Catchments with a significant component of relatively low permeability greywacke sediment allow less infiltration of rainfall and have relatively low aquifer storage volumes. Stream flows in these catchments tend to recede quickly during dry summer periods.
Groundwater level monitoring
Groundwater level is an important indicator for groundwater quantity. The groundwater level at different sites can vary significantly over time and seasons. The main influences on groundwater levels are the recharge of the aquifer, groundwater abstraction and the discharge from the aquifer to surface waters.
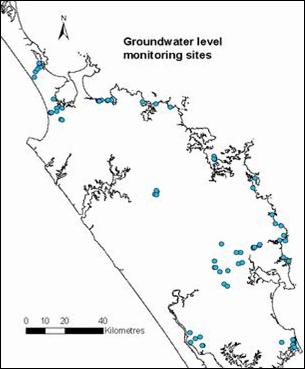
Figure 5 (right): Groundwater level monitoring sites.
Decreases in groundwater levels can occur as a result of natural climatic conditions, changes in land use, or as a result of over abstraction.
There are currently 85 groundwater level sites monitored throughout Northland, as shown in figure 5 (above).
General groundwater level trends in aquifer systems
Kaikohe and Whangarei basalts
Due to the fast infiltration of rainfall through fractured basalt, groundwater levels in basalt aquifers increase rapidly in early winter, in response to winter rains. The groundwater levels typically peak in the early summer and decline to their lowest level in late summer.
The Whangarei Basalts groundwater levels peaked in 1989 and 2000, and were at their lowest during 1992, 1994 and 2005. The seasonal variations in groundwater levels in the Whangarei Basalt are a direct result of the rainfall variations. Less than average winter rainfall occurred during the winter months in 2004 and 2005.
The groundwater levels in the Whangarei Basalts measured at Puriri Park, Maunu, varies from the lowest recorded level of 12.8 metres below ground level (mbgl) to 8.3 mbgl, as shown in figure 6 (below).
Figure 6: Groundwater level (metres below groundwater level) at Puriri Park site, Maunu.
Several groundwater level monitoring sites in the Whangarei Basalts also show the influence of pumping of neighbouring bores. This indicates that the Whangarei Basalt aquifer recovers reasonably quickly after a rainfall event, or when pumping has ceased.
Groundwater level in the Kaikohe Basalt Aquifer (with the exception of the Monument Hill site) has a seasonal trend of lower groundwater levels in the late summer to early autumn and higher groundwater levels in the winter and early spring. The seasonal fluctuation in groundwater level in the Kaikohe Basalt at State Highway 12 ranges from approximately 4.0 mbgl to 8.9 mbgl.
The groundwater level monitoring results at the Monument Hill site do not show the same seasonal pattern as other sites monitored in the Kaikohe Basalt. The groundwater level in the Kaikohe Hill generally peaks in December with the minimum level recorded around June. The groundwater level at Monument Hill has varied from 49.0 mbgl to 59.6 mbgl. This variation in groundwater level and the differing seasonal trend at Monument Hill is likely to be a direct result of groundwater abstraction from the site for the Kaikohe public water supply.
Mangawhai sand aquifer
The Mangawhai aquifer has a seasonal trend of lower groundwater levels in the late autumn (May, June and July) and higher groundwater water levels in the spring (October and November). The highest and lowest groundwater levels at Mangawhai Medical Centre are 3.5 mbgl and 6.6 mbgl, respectively.
A general decrease in the groundwater levels at the site occurred from 1990 to 1995 due to below average rainfall, particularly in the summer months. A recovery in groundwater level occurred from 1995 to 1999 due to an increase in rainfall during this period.
Aupouri sand aquifer
Groundwater levels in Hukatere forest area show fewer seasonal fluctuations than in the non-forested areas on the Aupouri Peninsula.
Groundwater levels peaked in 1989 and declined steadily until 1998, when they increased dramatically as shown in figure 7 (below). The groundwater levels are now close to the 1989 level. The period 1991 to 1994 was a period of intense El Nino weather conditions that caused dry weather conditions for much of the Northland region.
The variation in the groundwater levels in forested areas and non-forested areas, and the decline in the groundwater level until 1998 suggests the afforestation in the area has had a noticeable effect on the groundwater levels and recharge into the aquifer.
Figure 7: Groundwater level (metres below groundwater level) at Hukatere Forest site, Houhora.
Groundwater quality
The usefulness of groundwater is limited by its quality. The suitability of groundwater for drinking and other uses can be assessed through monitoring for key indicators. These indicators include:
· General parameters such as electrical conductivity, pH, alkalinity.
·  Major cations such as calcium, magnesium, sodium, potassium, iron, and manganese.
· Major anions such as chloride, sulphate, nitrate, and phosphorus.
· Microbiological indicators such as Escherichia coli.
· Biocides including pesticides, herbicides and insecticides.
Generally when a groundwater system is contaminated as a result of human activities it is more costly and complex to clean up when compared to surface water contamination. It is therefore important to prevent contaminants entering aquifers.
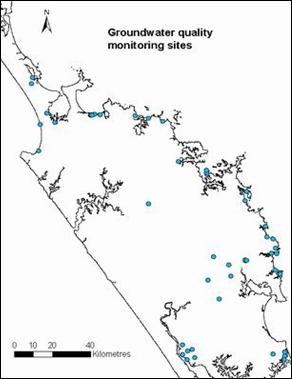
Northland Regional Council monitors 32 groundwater sites as shown in figure 8 (right) at three-monthly intervals for the key indicators identified above with the exception of biocides. These sites are all listed in table 9 in Appendix A with information about each site.
Figure 8 (above right): Groundwater quality monitoring sites
Groundwater quality at the majority of the sites monitored meets the Drinking Water Standards for New Zealand 2005 (DWSNZ) (MoH 2005) for the majority of indicators except microbiological, iron, manganese and chloride. Table 3 (below) shows the limits for biological, iron, manganese and chloride.
Table 3: Drinking water standards for New Zealand (MoH 2005).
Indicator |
Maximum Acceptable Value (MAV) of health significance |
Guideline value for aesthetic determinants |
Comment |
E. coli |
Less than 1 per 100 mL |
||
Iron |
0.2 mg/L |
Staining of laundry and sanitary ware. |
|
Manganese |
0.4 mg/L |
0.04 mg/L | Staining of Laundry |
|
0.10 mg/L |
Taste threshold |
||
Chloride |
250 mg/L | Taste threshold and corrosion |
The hydrochemistry of Northland's groundwater resources is variable and reflects the aquifer geology from which the water is drawn. The median for all data for each site monitored is shown in table 12 in Appendix B.
Microbiological indicator (E. coli)
E. coli is used as an indicator of contamination of groundwater by faecal material. The drinking water maximum acceptable value (MAV) for E. coli is less than 1, so a positive sample indicates non-compliance with the standard.
Sources of E.coli in groundwater include effluent disposal and agricultural land use activities such as dairying, livestock and piggeries. Soil can act as a barrier and reduce the risk of microbial contamination of groundwater. However, direct contamination can occur due to poorly constructed bores and inappropriate or poorly maintained effluent disposal systems.
The highest percentage of non-compliance with the drinking water standards occurs in many of the coastal areas where small communities rely on septic tanks for sewage disposal and in three of the volcanic aquifers: Maungakaramea, Maunu and Ruatangata, as shown in figure 9 (below).
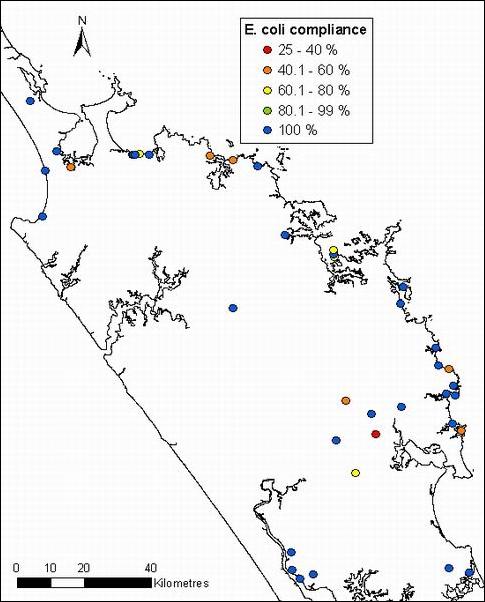
Figure 9: Percentage of samples that comply with the E. coli drinking water standard for monitoring record for all groundwater quality sites.
Iron and manganese
Iron and manganese occurs naturally in groundwater depending on the geology. The drinking water standards for New Zealand (MoH 2005) sets out the guideline values for iron and manganese for aesthetic purposes, and also the MAV for health purposes for manganese, as shown in table 3 (above).
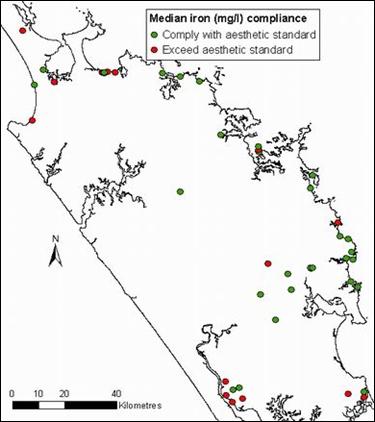 Figure 10 (right) shows whether the median iron concentration for each site is compliant with the 0.2 mg/L drinking water guideline set for aesthetic purposes. The majority of sites that exceed this guideline are fed from sand and gravel aquifers.
Figure 10: Compliance of median iron (mg/L) with standards
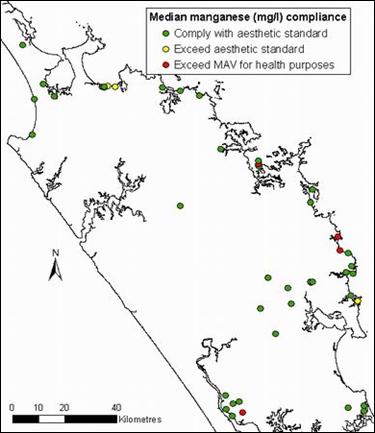
Figure 11 (right) shows whether the median manganese concentration for each site is compliant with the drinking water standards for aesthetic purposes and the MAV for health purposes. The sites that exceed both standards are fed from sand aquifers.
Excessive iron and manganese concentrations in groundwater gives water a rusty brown appearance, and can result in staining, irrigation system blockages and a general bad taste.
Elevated iron and manganese concentrations are derived from water–rock interaction, and there are few land uses that would contribute soluble iron and manganese.
Figure 11 (above right): Compliance of median manganese (mg/L) with standards
Saltwater intrusion
Monitoring of groundwater level, chloride and electrical conductivity is undertaken to check for seawater intrusion. The median chloride for each site is shown in figure 12 (right).
The majority of coastal bores monitored have higher electrical conductivity, chloride and sodium levels than inland basalt aquifers, due to leaching from marine sediments. There is potential for seawater intrusion of coastal aquifers (such as Taipa, Ngunguru and Russell) during summer when groundwater levels decline due to increased abstraction and/or decreased recharge caused by below average rainfall.
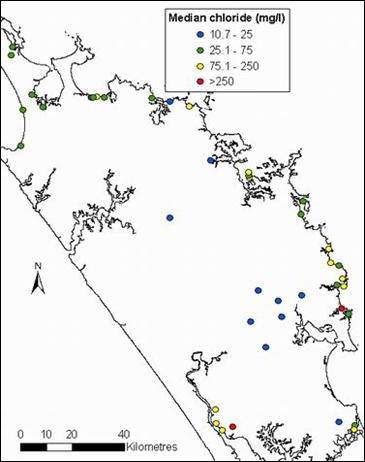 Figure 12: Median chloride (mg/L)
Nitrate
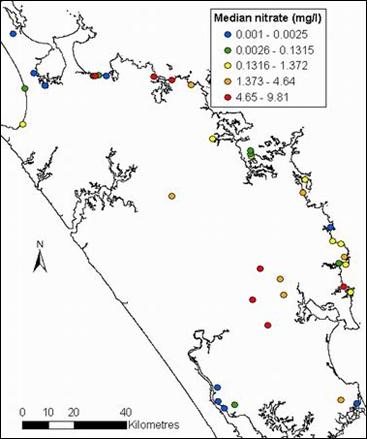 The median nitrate-nitrogen concentrations in all aquifers sampled are below the DWSNZ of 11.3 mg/L NO3-N, as shown in figure 13 (right).
Nitrate-nitrogen concentrations in several of the basalt aquifers fluctuate seasonally. Higher nitrate concentrations occur during winter when higher seasonal rainfall causes leaching of nitrogen to the water table. Although below the DWSNZ, nitrate levels are elevated in Maungakaramea, Whatitiri and Ruatangata basalt aquifers.
Figure 13: Median nitrate nitrogen (mg/L)
The primary sources of nitrogen in these aquifers are likely to be animal waste, the discharge of dairy effluent to land and fertiliser use.
The absence of organic material in these basalt aquifers means that nitrates are likely to be persistent as there is little potential for reduction through denitrification. Recent age analysis indicates that these aquifers have a mean resident age of around 45 years. This suggests that the nitrates present in the groundwater may be a result of historic land use activities that occurred around 45 years ago. Further age distribution analysis of groundwater is required to assess the risk of nitrate levels in the aquifers exceeding drinking water standards in the future.
Elevated levels of nitrate nitrogen also occur in several coastal aquifers, including Pataua North, Taipa and Tauranga Bay. The source of nitrogen in these areas is likely to be on-site effluent disposal.
General groundwater quality trends
Categorisation of sites
Daughney and Reeves (2005 and 2006) carried out multivariate analysis on selected parameters from groundwater sites throughout New Zealand. The same approach was applied to all groundwater data from Northland from 1996 to 2006 as part of a national analysis (MfE 2007). The aim of this analysis was to determine distinctive groups of groundwater quality characteristics (hierarchical facies) for aquifers throughout New Zealand. The result of this analysis is that each site is assigned two categories, one based on the medians and the other based on trend analysis.
The medians for all sites for all parameters from 1996 to 2006 are available in Appendix B and the results of the trend analysis are available in Appendix C. Note results were not calculated when there was less than three results for a parameter at a site. The seasonal Mann Kendall test was used to detect trends at a 95% confidence interval. For more information on data analysis techniques see Daughney and Reeves (2005 and 2006) and MfE (2007).
The categorisation results for Northland's 32 groundwater monitoring network sites and the following aquifer investigations, Ruawai, Russell and Taipa, are presented in Appendix D. A summary of these results is presented below.
Median category
The groundwater quality results were used to categorise sites into two main clusters, and then sub-clusters. Those sites that are within Cluster 1 can be described as surface dominated and those within Cluster 2 subsurface dominated.
Based on median values of selected water quality parameters (Daughney and Reeves 2005) of 46 Northland sites, 21 are from groundwater showing surface-dominated characteristics and suggests the groundwater is moderately to highly impacted by humans (clusters 1A-1 and 1A-2). Four sites show surface-dominated characteristics with little human impact (clusters 1B-1 and 1B-2) and 21 show subsurface-dominated characteristics (clusters 2A and 2B), as shown in table 4 (below).
It is important to note that this cluster analysis does not have a separate category for aquifers with water quality that is influenced by saltwater. Therefore Northland's coastal aquifers tend to fall into the cluster described as moderately to highly impacted by humans (clusters 1A-1 and 1A-2).
Table 4: Sites split into categories (hydrochemical facies) based on median values of selected water quality parameters (adapted from Daughney and Reeves 2005).
| Threshold 1 cluster | 1 |
2 |
||||
| Category description | Surface dominated Oxidised Unconfined aquifer Low to moderate total dissolved solids (TDS) Ca-Na-Mg-HCO3 water |
Groundwater dominated Reduced Higher TDS Ca-Na-HCO3 water |
||||
| Threshold 2 cluster | 1A |
1B |
||||
| Category description | Signs of human impact (HI) Rainfall recharge? Moderate TDS Na-Ca-Mg-HCO3–Cl water |
Little HI River recharge? Low TDS Ca-Na-HCO3 water |
||||
| Threshold 3 cluster | 1A-1 | 1A-2 | 1B-1 | 1B-2 | 2A | 2B |
| Category description | Moderate HI Carbonate/clastic aquifer Ca-Na-Mg-HCO3-Cl water |
Most HI Volcaniclastic or volcanic aquifer Ca-Na-Mg-HCO3-Cl water |
Carbonate or clastic aquifer Ca- HCO3 water |
Volcaniclastic or volcanic aquifer Ca-Na-Mg-HCO3-Cl water |
Moderately reduced Majority unconfined High TDS |
Highly reduced Majority confined Highest TDS |
| Number of sites | 7 | 14 | 0 | 4 | 17 | 4 |
Trend category
Based on Daughney and Reeves' (2006) trend analysis and clustering techniques on selected water quality parameters of 45 Northland sites, eight are improving (dilution cluster), seven are deteriorating (impact cluster) and seven sites were clustered as pristine, as shown in table 5 (below). One third (15 sites) show slow changes in groundwater quality that probably indicates natural water-rock interaction.
Table 5: Sites split into categories based on trend analysis of selected water quality parameters (adapted from Daughney and Reeves 2006).
| Cluster | Temporal pattern | Possible causes | Number of sites |
| Dilution (D) | Rapid decrease in Na, Ca, HCO3 and/or Cl over time | Change in pumping regime of hydrogeologic conditions | 8 |
| Impact (I) | Increases in Ca, Cl, K, Mg, Na, NO3-N and/or SO4 over time | Increasing proportion of recharge from rainfall relative to rivers over time, increasing human/agricultural impact in recharge area | 7 |
| Silica (Si) | Rapid increase in SiO2 without accompanying changes in other analytes at a similar rate | Unknown at this stage | 8 |
| Pristine (P) | Decreases in K, Mg and/or NO3-N over time, often with accompanying decreases in Ca, Na, Cl and/or SO4 | Increasing proportion of recharge from rivers relative to rainfall over time, decreasing human/agricultural impact in recharge area | 7 |
| Water-rock (WR) | No or only slow changes in most analytes over time | Natural water-rock interaction | 15 |
Other monitoring
Age testing
Groundwater is generally a mixture of water of different ages due to the mixing processes that occurs within an aquifer. The age of groundwater is expressed as "mean residence time" and is not a discrete age but a distribution of ages based on these mixing processes. Understanding the mean residence time and the age distribution is important for the management of groundwater resources. For example, if the mean age of groundwater in a particular aquifer is found to be approximately 50 years with limited age distribution, then water quality results would indicate the effects of use 50 years ago and will not indicate the influence of any recent land use change.
During 2005-06 five water samples were collected and analysed to determine the average age of the groundwater (mean residence time) delivered from bores in the Northland region. Samples were collected from groundwater quality monitoring bores at Maungakaramea, Mangawhai, Whatitiri, Three Mile Bush and Matapouri and analysed for tritium, CFC and SF6 isotopes.
The initial age estimates are provided in table 6 (below). However, further analysis is required to ensure accurate interpretation of the results, and also provide an understanding of the distribution of age and mixing processes within an aquifer. The bores will be resampled in approximately five years.
Table 6: Mean residence time for groundwater in five Northland bores.
| Site of bore | Initial mean residence time estimate (years) |
| Mangawhai | 3 ± 3 |
| Whatitiri | 3 or 45 (likely to be 45) |
| Maungakaramea | 45 ± 3 |
| Three Mile Bush | 50 ± 3 |
| Matapouri | 40 ± 3 |
The relatively old age recorded in the Matapouri bore may indicate the sand aquifer is recharged by old water upwelling from the surrounding greywacke. The analysis for the Whatitiri sample indicated two possible ages (3 or 45). However due to the depth and geology of the Whatitiri bore, the mean residence time is likely to be around 45 years. Additional sampling and analysis is required to confirm this.
Pesticides surveys of groundwater
The Institute of Environmental Science and Research (ESR) carried out national surveys of pesticides in groundwater in 1994, 1998, 2002 and 2006. In 1994 samples were collected from groundwater bores in five areas with horticultural land use, as shown in table 7 (below). No pesticides were detected.
Table 7: Pesticide results for Northland sites surveyed in 1994, 1998, 2002 and 2006.
| Year | 1994 | 1998 | 2002 | 2006 |
| Sites sampled | Houhora Kaitaia Kaikohe Whangarei Tara |
Ahipara Taipa Kaikohe Whangarei Tara |
Ahipara Taipa Kaikohe Glenbervie Tara |
Aupouri Taipa Glenbervie Maunu Maungakaramea Tara |
| Pesticides detected at | No sites | Only at Tara (well below MAV) | No sites | No sites |
In 1998 samples were taken from five groundwater bores and analysed for 42 pesticides at a significantly lower detection limit than the 1994 survey. Tara was the only site at which pesticides were detected. Terbuthylazine was present at a concentration of 0.28 mg/m3, well below the maximum acceptable value for drinking water of 8.0 mg/m3 (Ministry of Health, 2000).
In 2002 no pesticides were detected in the five bores sampled. In October 2006 samples from six bores were analysed for acidic herbicides and a suite of organochlorine, organophosphorus and organonitrogen pesticides. No pesticides were detected in any of the samples.
Pesticide movement through soils
Landcare Research, ESR and GNS collaborated on a study examining contaminant movement through soils (Close et al. 2004). The aim of the study was to assess the contamination risk to groundwater from the application of pesticides to different soil types around New Zealand.
A study site on basalt soils at Maungatapere near Whangarei was set up in November 1999. Selected pesticides were applied to the site, and both soil and soil water samples were taken.
 The study found evidence of preferential flow at the Northland site, which is consistent with the highly structured soil profile and intense rainfall that occurred at the site following pesticide application. The results indicated that pesticides are much more mobile in Northland Kiripaka soils than would be expected from literature values. This needs to be considered before pesticide application in areas with Kiripaka soils above aquifer systems.
Groundwater and surface water interaction
In many cases throughout Northland, groundwater emerges as springs and contributes to the flows of many streams and rivers in the region. Low groundwater levels in these areas can result in decreased flows in the streams and rivers particularly during periods of dry weather. Similarly poor groundwater quality can result in adverse effects on surface waters.
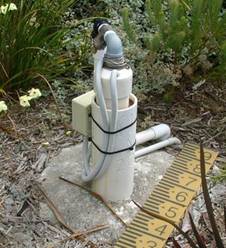
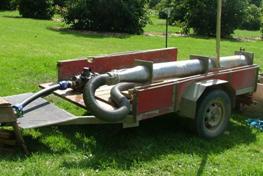
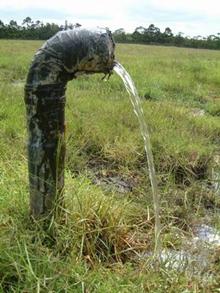
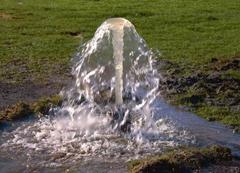
Orifice weir used for pump testing.
Surface water catchments surrounding basalt areas, such as Whangarei, Kaikohe and Kerikeri, are predominantly spring fed. Seepage from lakes and rivers can also recharge groundwater; however, surface water recharge in Northland is relatively minor compared to rainfall recharge.
Specific groundwater investigations
A number of investigations have been carried out as a result of specific issues arising in aquifers. These investigations include hydrogeology assessments of the Three Mile Bush, Glenbervie, Maungakaramea, Kaikohe, Aupouri, Coopers Beach and Mangawhai aquifers and additional groundwater quality investigations in the Ruawai, Russell and Taipa aquifers. The groundwater quality results from these investigations are presented in Appendices A to D.
Three Mile Bush aquifer investigation
The Three Mile Bush basalt aquifer is located directly west of Kamo, Whangarei. The study area comprises a 13.2 square kilometre basalt plateau at an elevation of approximately 230 metres above mean sea level. Groundwater from this aquifer is predominately used for horticultural irrigation, stock water and domestic water supplies.
The main issues potentially affecting groundwater quality and quantity in the Three Mile Bush area are:
· Groundwater abstraction.
· Bore construction and location.
· Land use change.
The study provided an assessment of the groundwater resources in the area, with the following recommendations:
· Further refinement of sustainable yield in the event of an increase in groundwater demand.
· Groundwater level survey to increase knowledge of groundwater flow.
· Increase in ongoing groundwater level monitoring in the northern part of the aquifer.
· Concurrent monitoring of spring and stream flow at a number of locations within the study area.
· Soil infiltration tests carried out to improve understanding of the groundwater recharge dynamics.
· Groundwater quality monitoring in other bores across the aquifer to identify potential groundwater quality issues.
Additional water level monitoring will commence in the northern part of the aquifer and the existing monitoring of groundwater level and quality, including anions, cations and bacteria, in the Three Mile Bush basalt aquifer will continue in the future.
For more information refer to the full report available on the Regional Council website at the following link:
http://www.nrc.govt.nz/Resource-Library-Summary/Research-and-reports/Groundwater/Three-Mile-Bush/
Glenbervie aquifer investigation
The main findings of the preliminary hydrogeological investigation for the Glenbervie groundwater resource (SKM 2005) completed in February 2005 are summarised below.
The Glenbervie basalt aquifer is located approximately three kilometres east of Kamo and was formed as a result of volcanic activity from two eruptive vents, Pukepoto and Puketotara scoria cones. The total study area is 8.7 km2. Groundwater from this aquifer is predominately used for horticultural irrigation and as a supplementary domestic supply.
The base of the aquifer varies from 31 to 107 m below ground level. The total annual average rainfall recharge to the aquifer is estimated to be between 4,227 m3/d and 8,684 m3/d. The aquifer discharges into springs and surrounding streams. The volume of water discharging from the aquifer has been estimated to be approximately 5,400 m3/d. However this estimate is based on limited information. Groundwater generally flows from the higher elevation ground near the Puketotara and Pukepoto scoria cones towards the basalt boundary.
Groundwater yields in bores throughout the aquifer are highly variable depending on the extent of fractures and weathered basalts intercepted by bores. Consented allocation is 704 m3/d and it is estimated that the total allocation (including permitted abstraction) could be up to 789 m3/d.
Bores screened close to or through the overlying soil and weathered rock may experience poor water quality.
Based on the information available the sustainable yield for the aquifer is estimated to be in the range of 1,680 m3/d to 3,480 m3/d. This suggests that further groundwater can be allocated from the aquifer. However, it is important to note that any new applications to take groundwater will be assessed on a case-by-case basis, as abstraction in close proximity to springs and streams can also potentially affect surface water users.
The report makes a number of recommendations including:
· Undertake concurrent monitoring of spring and stream flow at a number of locations within the study area.
· Soil infiltration tests are carried out to improve understanding of the groundwater recharge dynamics.
For more information refer to the full report available on the Regional Council website at the following link:
http://www.nrc.govt.nz/Resource-Library-Summary/Research-and-reports/Groundwater/Glenbervie/
Maungakaramea groundwater resources
The Maungakaramea basalt aquifer is located approximately 14 km southwest of Whangarei. The total study area is approximately 10.4 km2. Most of the study area is relatively flat, at an elevation of approximately 140 metres above mean sea level. The centre of the aquifer is a scoria cone, forming a "horseshoe" hill with an elevation of 225 metres above sea level.
Groundwater is generally used for horticultural irrigation, stock drinking, public and domestic water supply. The main potential groundwater issues are:
· Groundwater abstraction including effects on spring and stream flow.
· Land use change.
Based on the findings from the study, the following recommendations were made:
· Survey groundwater bores and springs to obtain information on flow direction, recharge and sustainable yield estimates.
· Increase groundwater quality monitoring to evaluate the existing water quality and long-term trends.
· Carry out soil infiltration tests to improve understanding of the groundwater recharge.
· Increase groundwater level monitoring (to daily).
Monitoring of groundwater level and quality, including anions, cations and bacteria, in the Maungakaramea area will continue in the future. In the event of an increase in groundwater demand in the future, further of the above recommendations will be implemented.
For more information refer to the full report available on the Regional Council website at the following link:
http://www.nrc.govt.nz/Resource-Library-Summary/Research-and-reports/Groundwater/Maungakaramea/
Kaikohe aquifer investigation
A water resource report for Kaikohe was prepared in 1992. Due to additional monitoring undertaken in the past 15 years, the aquifer has been reassessed in the hydrogeological investigation of the Kaikohe groundwater resource finalised in February 2007. The main findings are summarised below.
Groundwater from this aquifer is predominately used for public water supply, irrigation and stock and domestic requirements for the surrounding rural area.
 A soil moisture water balance model (SMWBM) was used to determine surface water runoff, infiltration and groundwater recharge. Based on this modelling the sustainable yield for the Kaikohe scoria cone and the surrounding basalt was estimated to be approximately 360 m3/d and 5,010 m3/d, respectively. The total consented groundwater abstraction for the aquifer is 870 m3/d. This suggests that further allocation can occur. However, abstractions from bores can affect nearby spring flows, so although the total allocation for the aquifer is less than the sustainable yield, individual consented allocation needs to be assessed on a site- specific basis.
The report makes a number of recommendations including:
· Future pump testing.
· Gaugings of springs and streams coinciding with groundwater levels.
· Bore and water survey to assess permitted takes.
Monitoring of groundwater level and quality, including anions, cations and bacterial, in the Kaikohe area will continue in the future.
For more information refer to the full report available on the Regional Council website at the following link:
http://www.nrc.govt.nz/Resource-Library-Summary/Research-and-reports/Groundwater/Kaikohe/
Aupouri aquifer investigation
A groundwater flow model was developed in 2000 for the Aupouri Aquifer following a noticeable decline in groundwater levels since 1990 at Northland Regional Council monitoring wells in this aquifer. The model was developed to assess sustainable yields from the aquifer.
Results of the model indicate that the aquifer is not over allocated. The observed decline in groundwater level was considered to be caused by periods of below average rainfall. The planting of Pinus radiata forest is also considered to have caused a reduction in groundwater recharge over some of the modelled area.
For more information refer to the full report available on the Regional Council website at the following link:
http://www.nrc.govt.nz/Resource-Library-Summary/Research-and-reports/Groundwater/Aupouri/
Coopers Beach, Cable Bay and Mangonui aquifer investigation
The main findings of the preliminary hydrogeological investigation for the Coopers Beach, Cable Bay and Mangonui groundwater resource (SKM 2005b) finalised in July 2005 are summarised below.
Cable Bay, Coopers Beach and Mangonui are small coastal townships located in Doubtless Bay, Northland. The basalt aquifer study area is approximately 17 km2, encompassing these towns and extending inland to the top of Cable Bay Block Road. The predominant land use is residential near the coast and rural for the remainder.
Groundwater from this aquifer is predominately used for reticulated water supplies and private supplementary domestic supplies.
The bores in the area range from 11.5 to 155 m below ground level. The total annual average rainfall recharge to the aquifer is estimated to be between 3,214 m3/d and 9,641 m3/d. The aquifer discharges into springs and surrounding streams and the coast. The volume of water discharging from the aquifer has been estimated to be approximately 8,750 m3/d. However this estimate is based on limited information. Groundwater generally flows in a northerly direction towards Doubtless Bay.
Groundwater yields in bores throughout the aquifer are highly variable depending on the extent of fractures and weathered basalts intercepted by bores. Consented allocation is 828 m3/d and it is estimated that the total allocation (including permitted abstraction) could be up to 939 m3/d.
Based on the information available the sustainable yield for the aquifer is estimated to be in the range of 1,280 m3/d to 3,860 m3/d. This suggests that further groundwater can be allocated from the aquifer. However, it is important to note that any new applications to take groundwater will be assessed on a case-by-case basis, as abstraction in close proximity to the foreshore has the potential to result in saltwater intrusions.
The report makes a number of recommendations including:
· Monitoring of groundwater levels and quality to assess the potential for seawater intrusions at Cable Bay, Coopers Beach and the Mangonui waterfront.
· Groundwater level monitoring further inland to assess seasonal variations and the effect of abstraction.
· Measurement of spring and stream flows to assess potential adverse effects of increased groundwater demand.
Monitoring of groundwater level and quality, including anions, cations and bacterial, in the Cable Bay/Coopers beach and Mangonui area will continue in the future.
For more information refer to the full report available on the Regional Council website at the following link:
Mangawhai aquifer investigation
The main findings of the hydrogeological Investigation for the Mangawhai groundwater resource (SKM 2005c) finalised in August 2005 are summarised below.
Mangawhai Village and Mangawhai Heads are coastal townships located approximately 50 km south of Whangarei. This area, in particular Mangawhai Heads, is currently experiencing an enormous increase in subdivision. Groundwater in the area is used mainly as a supplementary domestic supply for many of the residences, and to a lesser extent for horticultural irrigation and stock drinking water.
The predominant surface geology of the study area is Waitemata sandstones and mudstones, overlain with clays (weathered Waitemata), sands or alluvium. The sands are located on the peninsula at Mangawhai Heads and around the sand spit, while the alluvium is located in the stream valleys. The main source of groundwater is from the sand and Waitemata formation. Groundwater yields for the sand aquifer range between 12 and 409 m3/d, and 9 to 454 m3/d from the Waitemata formation.
The study indicated elevated chlorides, boron, fluoride and lithium concentrations occur in some bores located at low elevations near Mangawhai Village and along the southern end of the estuary. It is likely that these bores intercept discrete fractures within the Northland Allochthon and Waitemata rocks, through which thermal upwelling may occur. It is possible that elevated concentrations occur in other bores throughout the study area that encounter these persistent fractures or high permeability zones, in particular near the Waipu Fault or around igneous intrusions. However, there is currently no groundwater quality data to verify this.
Due to the complex geology, the recharge and discharge estimates have a large degree of uncertainty. Further investigation is required in order to estimate the sustainable yield.
Based on the preliminary findings the following recommendations were made:
· A model based on dynamic estimates of groundwater recharge is recommended for a more accurate assessment of sustainable yield.
· A monitoring round in the Riverside Motor Camp bore that includes boron, fluoride and lithium is recommended to assess the source of saltwater.
· A saltwater intrusion and groundwater level monitoring bore be established in the sand aquifer.
Monitoring of groundwater level and quality, including anions, cations and bacterial, in the Mangawhai area will continue in the future.
For more information refer to the full report available on the Regional Council website at the following link:
http://www.nrc.govt.nz/Resource-Library-Summary/Research-and-reports/Groundwater/Mangawhai/
Russell aquifer investigation
The Russell aquifer is potentially at risk of saltwater intrusion from overuse and the effects of urbanisation and land use changes. A hydrogeological update on the aquifer was prepared in 2001. The main findings of this report suggest that the aquifer system is likely to be over allocated and the reticulation of sewage greatly reduces recharge into the groundwater system.
As a result of these findings, a numeric groundwater modelling exercise was undertaken to better understand recharge and discharge dynamics, the effects of reduced recharge and refinement of the sustainable yield. Although the modelling exercise estimates a high volume of water may be sustainably taken from the aquifer (225m3/d), the exercise also suggests that the reticulation of wastewater is likely to increase the potential for saltwater intrusion during prolonged dry periods.
Several meetings were held with water users and, as a result of the investigations, telemetered monitoring equipment has been installed in bores near the Russell foreshore to provide real time data and a pre-warning of increased risk of saltwater intrusion for groundwater users in the area.
For more information refer to the full report available on the Regional Council website at the following link:
Ruawai aquifer investigations
The main findings of the Ruawai aquifer management zone bore survey and preliminary hydrogeology study finalised in December 2003 are summarised below.
The Ruawai plains are located approximately 26 kilometres south east of Dargaville. The plains consist of alternating layers of fine and coarse alluvium underlay with sedimentary rocks. The predominant land use is urban near the coast, and rural for the remainder.
Groundwater from this aquifer is predominately used for public water supply for the Ruawai township and stock and domestic requirements for the surrounding rural area.
A bore survey was carried out to obtain more accurate information on hydrogeology and water use within the study area. Thee main aquifer zones were identified:
- A recharge zone to a depth of 10-20 m (shallow aquifer).
- A lateral flow zone at depths of 20-40 m (intermediate aquifer).
- A zone of high groundwater pressure (artesian) at depths greater than 40 m (deeper aquifer).
The shallow aquifer is influenced by mixing of tidal water and is vulnerable to contamination from land use activities. The shallow groundwater is also linked to the surface water in drains and therefore may include surface water quality.
The deeper aquifer is relatively old water (>50 years). Water quality from this aquifer is generally good, and the potential for contamination from land use activities is considered to be low under the current demand. However, in the event the artesian pressure declines due to poorly maintained bores allowing water to run to waste, the risk of contamination increases.
The sustainable yield for the shallow and deeper aquifer were estimated to be in the order of 10,000 m3/d and 27,000 m3/d, respectively. The current groundwater abstraction from the Ruawai aquifer is estimated to be 1,200 m3/d, which is significantly less than what is potentially available.
The report makes a number of recommendations including:
· Real time groundwater pressure monitoring.
· Investigate groundwater contamination on shallow groundwater and surface water interaction.
· Consider options to address issue of flowing artesian and uncapped bores.
Monitoring of groundwater level and quality, including anions, cations and bacterial, in the Ruawai area will continue in the future.
For more information refer to the full report available on the Regional Council website at the following link:
 http://www.nrc.govt.nz/Resource-Library-Summary/Research-and-reports/Groundwater/Ruawai/
Awanui aquifer investigation
Awanui is located in the southern end of the Aupouri aquifer, just north of Kaitaia. The area has a large number of abandoned flowing artesian bores which discharge into the Awanui drainage network. Due to the potential cost of bore closure a modelling investigation has been undertaken to assess the effects of bore closure on the Aupouri aquifer.
The conclusions of this investigation are that bore closure will result in a quick increase in groundwater levels in the shell bed and sand aquifers in the Awanui area and sand dunes to the north west, minimum effects on surface flows and more water being available for efficient users. If groundwater allocation increases in the Awanui and Sweetwater area it is highly recommended that closure of flowing artesian bores be considered.
For more information refer to the full report available on the Regional Council website at the following link:
http://www.nrc.govt.nz/Resource-Library-Summary/Research-and-reports/Groundwater/Awanui/
Taipa aquifer investigation
Taipa is a small coastal settlement located on a sand spit in Doubtless Bay. A small aquifer exists in the sand spit. The aquifer has saltwater bodies on the northern and western boundaries. It has a small recharge area and is highly at risk from saline intrusion.
Dewatering to enable the installation of sewer pipelines occurred in the early 1990s. This dewatering resulted in saline contamination of several bores along the western boundary of the estuary. A further incident occurred in 1999 as a result of a leaking underground petrol tank. Specific groundwater monitoring has been undertaken in the area. Although the monitoring indicates the groundwater quality at the sampling sites meets the New Zealand drinking water standards, long term water quality and quantity monitoring will continue due to the sensitivity of the system.