10.7 Case study 1: Flood event 29 March 2007
 On Tuesday 27 March at 11.10 am the MetService issued a Severe Weather Watch for Northland. This indicated the development of a low pressure system in the northern Tasman blocked by a high further to the east. Together these would bring a strengthening, humid north-east flow on to the North Island with rain spreading south. This watch was upgraded to a full warning at 8.40am on Wednesday 28 March with an expectation that 100 – 150mm of rain may fall and that heavy falls in the order of 50mm over 2 – 5 hours may occur through Thursday and into Friday.
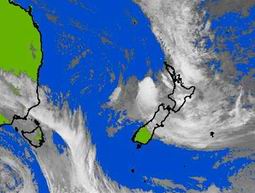
MetService satellite image of the weather system over Northland on the 29 March 2007 (right).
As a result, a north to north-easterly flow spread on to Northland bringing with it widespread rain. Areas first affected were the Far North and particularly Kaeo and the Bay of Islands. Rivers were starting to rise on Wednesday evening. By midnight Wednesday NIWA's Maungaparerua rain gauge, in the western hills of Kerikeri, had received 175mm and NRC's gauges at Kaeo, Ohaeawai and Ngunguru had all recorded falls exceeding 100mm. Many other NRC gauges exceeded 50mm.
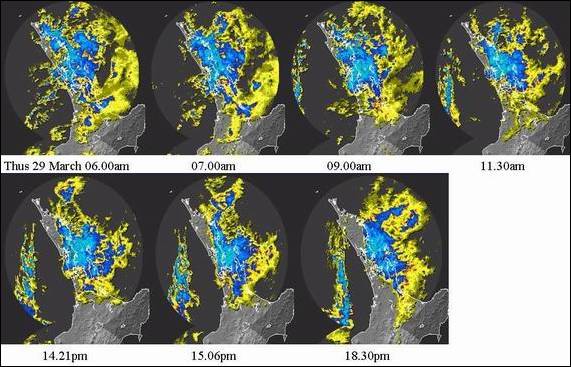
MetService Auckland radar images from 0600 to 1830 hours on the 29 March 2007 (above).
NRC released a media report on Thursday morning indicating the potential for widespread flooding, particularly in the Kerikeri area. The Kaeo River was severely swollen and other rivers in the Bay of Islands and further south were rising rapidly. Also, the Mangakahia, Opouteke and Hikurangi Rivers showed rapid rising water levels and together with a predicted four-metre flood peak from the Wairua River, extensive 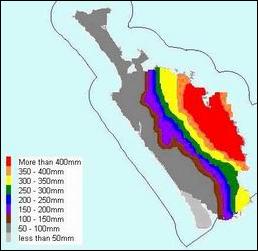 flooding was expected on the lower flats of the Mangakahia, Wairua and Northern Wairoa Rivers (Tangiteroria). Flood warnings were issued for these areas.
By Thursday morning the MetService expected another 30 – 50mm in the Bay of Islands and up to 90mm further south. The event was larger than anticipated with rains falling over a longer duration as the moist north-easterly continued funnelling into the eastern coast and with only a slow movement southwards.
Figure 12: Rainfall over the period 28 to 29 March 2007.
Rain had cleared in the Far North early on Thursday but eastern areas from Kaeo south continued to receive significant falls. By midnight on Thursday Ngunguru and Puhipuhi gauges had received over 330mm each on top of Wednesday's falls with two day totals exceeding 430mm. Along with these two gauges four other gauges exceeded 300mm (Maungaparerua, Oakura Bay, Kaeo and Tara near Mangawhai). Heavy rains finally cleared the Bay of Islands by late afternoon on Thursday and from our southern parts in the early hours of Friday.
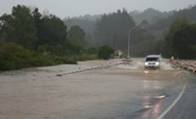
As a consequence rivers rose to very high levels in parts of the region. Rivers around the Kaeo/Bay of Islands area were some of the first to rise late on Wednesday 28 March and continued to rise through most of Thursday. Many rivers flowed out of their channels, including Kaeo, Waipapa, Waitangi, Waiharakeke, Whakapara, Hatea, Ruakaka and Waipu, all resulting in road closures and large areas of farmland inundated with floodwater. There was also significant surface flooding and subsidence affecting many residential areas.
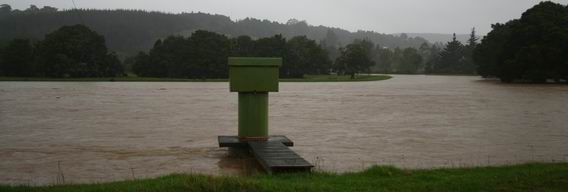
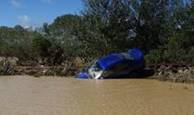 High water levels in the Whakapara River (above) resulted in severe flooding on SH1 by Puhipuhi Road intersection (top right) and a vehicle being swept off the road (bottom right).
Based on 24-hour rainfall totals as shown in table 4 (below) and the tables of return period assessments for selected sites, this storm was equivalent to a 1:150-year rain event.
Table 4: Daily rainfall (mm) from midnight to midnight for 28 and 29 March 2007 and from midnight until 0630 hours on 30 March, total rainfall for this period and maximum hourly rainfall.
| Location | Wed 28 March (24 hours) |
Thu 29 March (24 hours) |
Fri 30 March To 0630 hrs |
Total (mm) | Max mm/hr |
| East Whangarei (Glenbervie Hills) | 104 | 332 | 2.5 | 438.5 | 36 |
| Puhipuhi Hills | 99 | 335.5 | 1.5 | 436 | 46 |
| Western Hills Kerikeri (Maungaparerua) | 175 | 229 | 0.5 | 404.5 | 46 |
| Oakura Bay | 85.5 | 285 | 0.5 | 371 | 33.5 |
| Tara (Mangawhai) | 43.5 | 280.5 | 16.5 | 340.5 | 40 |
| Kaeo | 131 | 190.5 | 0.5 | 322 | 36.5 |
| Marsden Point (Port) | 42 | 251 | 2 | 295 | 37.5 |
| Whangarei City | 45.5 | 222 | 3 | 270.5 | 42.5 |
| Ohaeawai | 110.5 | 153 | 0 | 263.5 | 19 |
| North Brynderwyn Hills | 34 | 195.5 | 4.5 | 234 | 30 |
| East Mangamuka (Mangakawakawa) | 99 | 65.5 | 0 | 164.5 | 21.5 |
| Tutamoe | 78.5 | 76.5 | 0.5 | 155.5 | 17.5 |
| Maungaturoto | 20.5 | 130.5 | 1 | 152 | 23.5 |
| Opouteke (Eastern Tutamoe) | 63 | 79 | 0 | 142 | 16 |
| Twin Bridges | 51 | 68.5 | 0.5 | 120 | 15 |
| Paparoa | 17.5 | 97.5 | 0 | 115 | 20.5 |
| West Mangamuka (Te Rore) | 54 | 37.5 | 0 | 91.5 | 12 |
| Opononi | 36.5 | 43.5 | 0.5 | 80.5 | 10.5 |
| Kaitaia | 53.5 | 25.5 | 0.5 | 79.5 | 13.5 |
| North Hokianga (Rotokakahi) | 43.5 | 27 | 1 | 71.5 | 11 |
| Dargaville | 15 | 46.5 | 0.5 | 62 | 10.5 |
| Pouto Point | 7.5 | 32 | 0.5 | 40 | 8 |
Rainfall return periods
The following tables show the estimated return period for the rainfall amounts recorded at various rainfall sites calculated using NIWA's software program High Intensity Design Rainfall System (HIRDS).
The following areas all had at least one estimated return period of 1:150 years: Kaeo, Maungaparerua, Oakura Bay, Puhipuhi, Ngunguru and Mangawhai (tables 5 to 10 respectively). There are three areas that do not have 1:150-year estimated return period: Ohaeawai (table 11), Whangarei City (table 12) and Marsden Point (table 13). However, the latter did have estimated return periods of 1:140 years and 1:120 years respectively.
Table 5: Rainfall return period for Kaeo
| Period (hours) | Rainfall (mm) | Estimated return period (yrs) |
| 6 | 135.5 | 1:75 |
| 12 | 179.5 | 1:65 |
| 24 | 291.5 | 1:150 |
| 48 | 306.0 | 1:80 |
Table 6: Rainfall return period for Maungaparerua (Western Hills Kerikeri)
| Period (hours) | Rainfall (mm) | Estimated return period (yrs) |
| 6 | 144.5 | 1:140 |
| 12 | 201.0 | 1:150+ |
| 24 | 359.5 | 1:150+ |
| 48 | 386.5 | 1:150+ |
Table 7: Rainfall return period for Oakura Bay
| Period (hours) | Rainfall (mm) | Estimated return period (yrs) |
| 6 | 120.5 | 1:50 |
| 12 | 228.5 | 1:150+ |
| 24 | 310.5 | 1:150+ |
| 48 | 360.0 | 1:150+ |
Table 8: Rainfall return period for Puhipuhi
| Period (hours) | Rainfall (mm) | Estimated return period (yrs) |
| 6 | 192.0 | 1:150 |
| 12 | 281.5 | 1:150+ |
| 24 | 383.5 | 1:150+ |
| 48 | 428.5 | 1:150+ |
Table 9: Rainfall return period for Ngunguru (Glenbervie hills)
| Period (hours) | Rainfall (mm) | Estimated return period (yrs) |
| 6 | 143.0 | 1:60 |
| 12 | 242.0 | 1:150+ |
| 24 | 382.0 | 1:150+ |
| 48 | 438.0 | 1:150+ |
Table 10: Rainfall return period for Tara (Mangawhai)
| Period (hours) | Rainfall (mm) | Estimated return period (yrs) |
| 6 | 144.5 | 1:130 |
| 12 | 215.5 | 1:150+ |
| 24 | 293.5 | 1:150+ |
| 48 | 340.5 | 1:150+ |
Table11: Rainfall return period for Ohaeawai
| Period (hours) | Rainfall (mm) | Estimated return period (yrs) |
| 6 | 89.0 | 1:10 |
| 12 | 135.5 | 1:18 |
| 24 | 238.5 | 1:60 |
| 48 | 251.0 | 1:30 |
Table 12: Rainfall return period for Whangarei City
| Period (hours) | Rainfall (mm) | Estimated return period (yrs) |
| 6 | 153.5 | 1:140 |
| 12 | 197.0 | 1:110 |
| 24 | 246.0 | 1:80 |
| 48 | 268.0 | 1:55 |
Table 13: Rainfall return period for Marsden Point
| Period (hours) | Rainfall (mm) | Estimated return period (yrs) |
| 6 | 143.0 | 1:110 |
| 12 | 198.0 | 1:110 |
| 24 | 268.5 | 1:120 |
| 48 | 293.0 | 1:100 |
Hourly rainfall plots
The following plots show one-hourly rainfall data (mm/hr) from 25 March to 30 March 2007 for various rainfall sites throughout Northland.
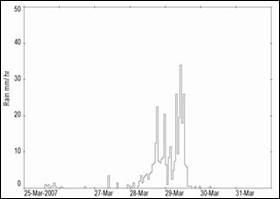
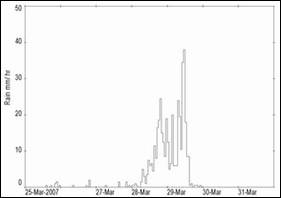
Figures 13 and 14: Hourly rainfall (mm/hr) for Kaeo (left) and Maungaparerua (right).
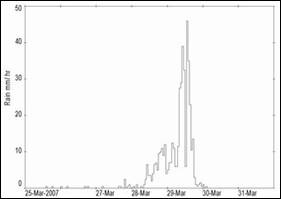
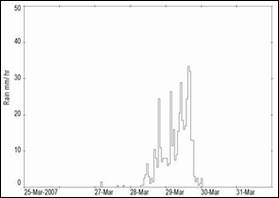
Figures 15 and 16: Hourly rainfall (mm/hr) for Puhipuhi (left) and Ngunguru (right).
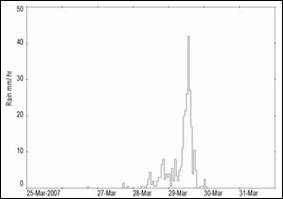

Figures 17 and 18: Hourly rainfall (mm/hr) for Whangarei (left) and Mangawhai (right).
River height in relation to historic records
For many rivers around Northland the height recorded in March 2007 is the highest on record, as shown in table 14 (below).
Table 14: Peak water level recorded in March storm for several Northland Rivers and where this water level peak height is ranked in site record.
| Water level station | Years of record | Recorded peak height | Rank |
| Waitangi at Haruru Falls (NIWA) | 28 | 6.939m | 1st |
| Waipapa at Puketi Forest (NIWA) | 29 | 5.524m | 1st |
| Rangitane at Waipapa | 30 | 5.137m | 1st |
| Maungaparerua at Puketotara Rd (NIWA) | 40 | 3.102m | 2nd* |
| Waiharakeke at Moerewa | 40 | 4.563m | 8th |
| Waiotu at SH1 | 20 | 8.690m | 1st |
| Whakapara at SH1 | 48 | 9.444m | 1st |
| Mangahahuru at Kauri | 39 | 4.185m | 1st |
| Wairua at Pipiwai Rd | 47 | 7.548m | 15th |
| Wairua at Wairua Bridge | 46 | 4.788m | 4th |
| Hikurangi at Moengawahine | 32 | 9.054m | 8th |
| Mangakahia at Gorge (NIWA) | 47 | 4.219m | 29th |
| Mangakahia at Titoki | 24 | 11.293m | 13th |
| Ngunguru at Kaikatia rd | 38 | 2.914m | 7th |
| Ruakaka at Flyger Rd (SH1) | 23 | 4.699m | 1st |
| Ahuroa at Braigh Flats (SH1) | 24 | 5.826m | 2nd |
* The Kerikeri flood in 1981 is ranked first for Maungaparerua at Puketotara Rd.
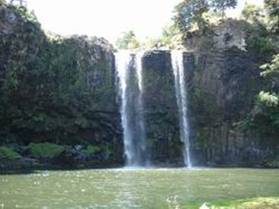
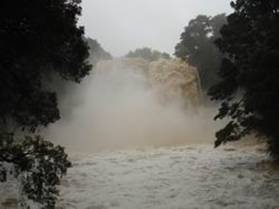
Whangarei Falls during normal summer flows (left) compared to the flood on 29 March (right).
The water level recorded on the 29 March at the NIWA station Waitangi at Wakelins station above Haruru Falls is the now the highest on record as shown in figure 19 (below). The red line indicates the previous maximum water level recorded at this station during the Kerikeri flood in March 1981.
|
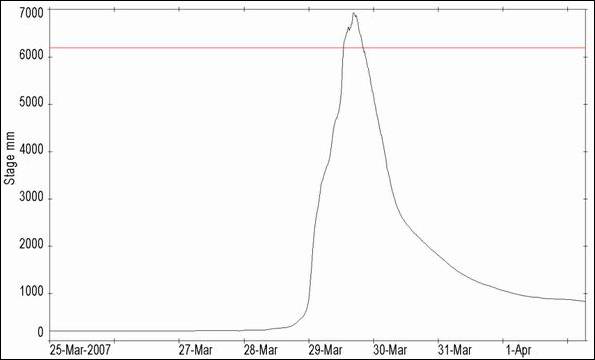
Figure 19: Water level in Waitangi River at Wakelins (NIWA site) above Haruru Falls.
The Northland Regional Council acknowledges the MetService for the images presented and NIWA for the information supplied from their water level and rainfall stations during this event.
For more detailed information on the March 2007 floods refer to the detailed reports available at the following link:
http://www.nrc.govt.nz/Resource-Library-Summary/Research-and-reports/Natural-hazards/