April 2025 climate report
6 May 2025, 3:00 PM
Key take away from this report
What a difference a month makes, heavy rainfall across the region has lifted drought conditions and all soils around the region are now at field capacity.
Summary
- Drought conditions have ended with the region receiving an average of 400% of the expected rainfall for April.
- All key river catchments are recording above average flows.
- Groundwater levels are varied for key aquifers across the region with majority currently recording “low” water levels.
- Soil moisture levels are at capacity throughout Northland
- Between May – July, temperatures and rainfall are expected to be “above average” while flows and soil moisture levels are expected to be “near average".
- There is a higher risk than normal for heavy rainfall events from the northeast to continue into winter.
Rainfall
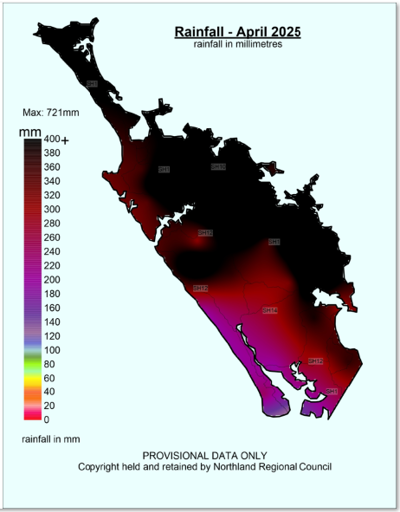
The Northland region has gone from one extreme to the other during April, after months of low rainfall, particularly in the southwest, April was significantly wetter than average with four heavy rainfall events moving across the region. Most of the rainfall fell in the north and east of the region. Northland Region averaged 400 mm of rain, which is 400% of the long-term median, or normal expected rainfall.
The highest rainfall total for the month were recorded at Wiroa Road (Kerikeri) with 721 mm, 613% of normal expected. The lowest rainfall recorded for the month was at with Poutō Point, which recorded 121.6 mm, 223% of normal expected.
Figures 1 and 2: April rainfall distribution for Northland in mm, and in percentage of median. Showing an average of 20 mm (22% of expected) rainfall for the region.
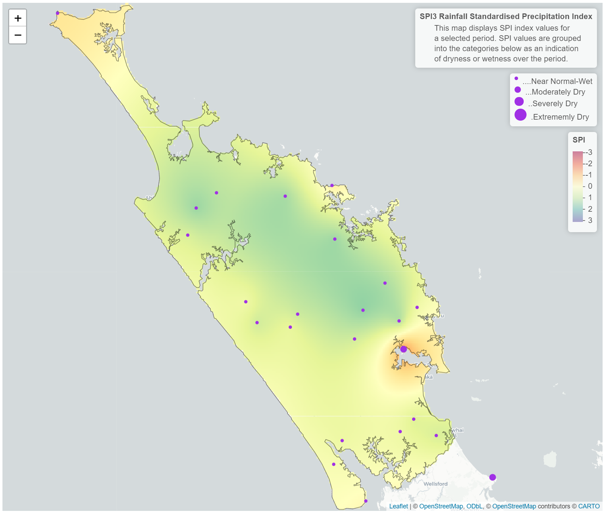
The standardised rainfall index (SPI) is useful to compare the rainfall in Northland as a whole, as the site-specific patterns are removed from the data. Looking back three months (February – April) the region is near normal, with the east and northern areas of the region wetter than average. Over a six-month period (November – April) the pattern is slightly drier. Around the Whangārei area on both a three- and six-month period the area is moderately dry, which is a result of the drought conditions throughout summer and early autumn.
Figures 3, and 4: Standardised rainfall for Northland on a 3-month scale (February – April), a 6-month scale (November– April).
River Flows
River flows in all monitored catchments in Northland are “Above Average” following a month of heavy rainfall.
Figure 5: River flows in Northland for April 2025.
Groundwater
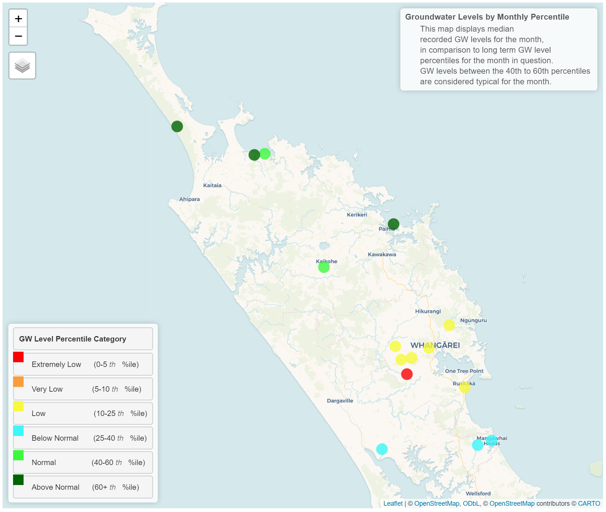
Groundwater levels in Northland's key monitored aquifers in April range from “Extremely Low” to “Above Normal”. This regional variation is primarily due to differences in aquifer geology, and recharge rates.
Figure 6: Groundwater levels in Northland’s primary monitored aquifers for April 2025.
Soil moisture
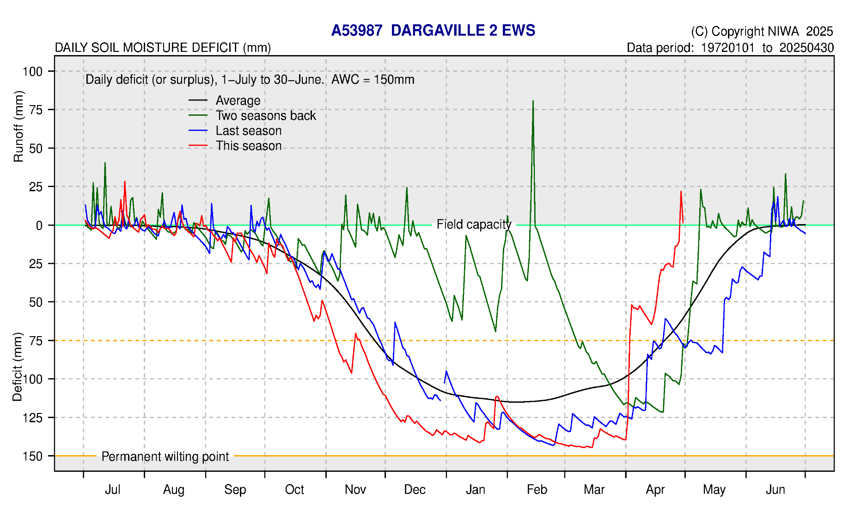
Soil Moisture has recovered across the region, due to four heavy rainfall events, and soil moisture plots indicate that soil moisture is now at capacity throughout Northland.
The soil moisture deficit is calculated based on incoming daily rainfall (mm), outgoing daily potential evapotranspiration (mm), and a fixed available water capacity (the amount of water in the soil 'reservoir' that plants can use) of 150 mm”.
Figure 7: Calculated daily soil moisture values at key areas around Northland, courtesy of NIWA, ending in April 2025.
Note: Some graphs above do not have all March and April data available, due to a sensor malfunction and no data collected.
 Figure 7: Kaikohe calculated daily soil moisture values - April 2025
 Figure 7: Kaitaia calculated daily soil moisture values - April 2025
 Figure 7: Kerikeri calculated daily soil moisture values - April 2025
 Figure 7: Warkworth calculated daily soil moisture values - April 2025
 Figure 7: Whangārei calculated daily soil moisture values - April 2025

Climate Outlook for May – July 2025
Summary of climate forecasts from NIWA and MetService
The ENSO, as the main climate driver for New Zealand is in the neutral range and these conditions are expected to remain between May and July. However, La Nina like weather events expected to continue as the region settles. Higher atmospheric pressure is expected to the east of NZ, which will lead to more northeasterly and northerly flows and with low pressure systems still forming in the islands, there is a higher risk for heavy rainfall events to continue heading into winter. In Northland temperatures and rainfall are likely to be “above average” while soil moisture and river flows are likely to be “near average"
For more information visit the following links:
Table 1: Forecasted likelihood of above, near or below average climate conditions for Northland from May – July 2025
(Expressed as % likelihood).
| Temperature | Rainfall | Soil moisture | River flows | |
| Above average | 80• | 45• | 25 | 35 |
| Near average | 15 | 35 | 50• | 45• |
| Below average | 5 | 20 | 25 | 20 |


