June 2025 climate report
16 Jul 2025, 11:59 AM
Key take away from this report
June Rainfall was below average for the region, but following a wet autumn, river flows, ground water levels, and soil moisture are close to capacity.
Summary
- Northland region averaged 85% of the expected rainfall for June, however there was a large variation between different parts of the region with ranges from 50% to 155%.
- River flows and groundwater levels are almost all “above average” for June.
- Soil moisture levels are at or just below field capacity moving into July across Northland.
- Between July and September temperatures and rainfall are expected to be higher than normal, while river flows are likely to be near normal
Rainfall
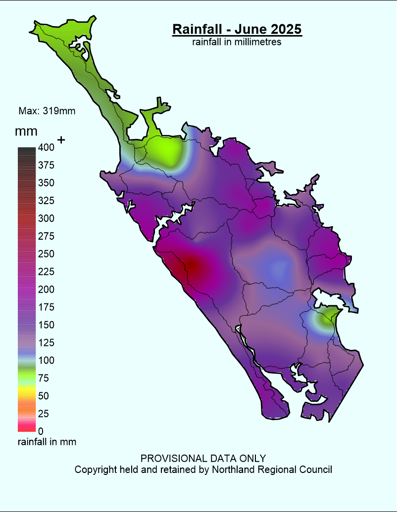
Scattered rain events, and thunderstorm activity dominated through June, with only a brief period in the middle of the month with no rainfall. Most rainfall came through from the west, and the majority of the region received greater than 100mm for the month (figure 1). The maximum rainfall was recorded at Waimamaku on the West Coast with 319.5 mm, followed by Tutamoe with 252 mm.
On the other end of the scale the lowest rainfalls recorded were split between Bream Bay, south of Whangārei (83 mm) and the Peria area inland of Doubtless Bay (82.5 mm). The region on average recorded 133.5 mm which is 85% of the expected rainfall in June (figure 2).
The lowest percentage of rainfall was south of Kaitaia in Te Puhi which recorded 50% of expected and then Bream Bay at Wilsons Dam which recorded 60%. The Maximum percentage was recorded in the Waitangi catchment with 155% then on the west coast with the Pouto Peninsula and Kaiiwi Lakes receiving 132% and 134% of the expected June totals.
Figure 1 and 2: June rainfall distribution for Northland in mm, and in percentage of median. Showing an average of 133.5mm (85% of expected) rainfall for the region.
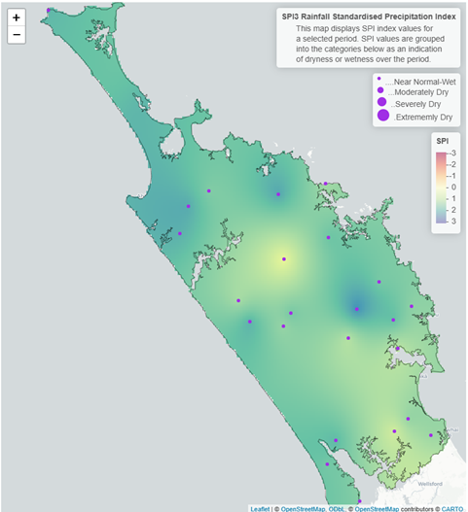
On a longer time scale the standardised precipitation index, over three months (Figure 3) shows that the region has been wetter than “Normal” between April - June, while over six months the region has been “near normal” for most of Northland, with the dry conditions between January – March being counteracted by the wet end of Autumn and start of Winter.
Figure 3 and 4: Standardised rainfall for Northland on a 3-month scale (April – June), and a 6-month scale (January– June).
River Flows
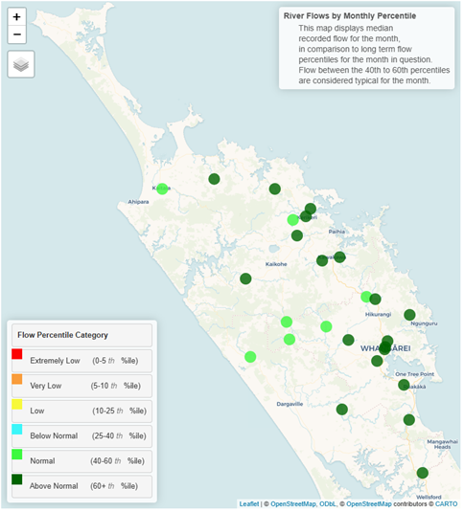
River flows in June were either “Above Normal” or “Normal” across the region (Figure 5), with no distinct pattern between catchments. There is still some capacity in the rivers, however along with saturated soils, significant rainfall is likely to result in flooding in low lying areas.
Figure 5: River flows in Northland’s key monitored catchments for June 2025.
Groundwater
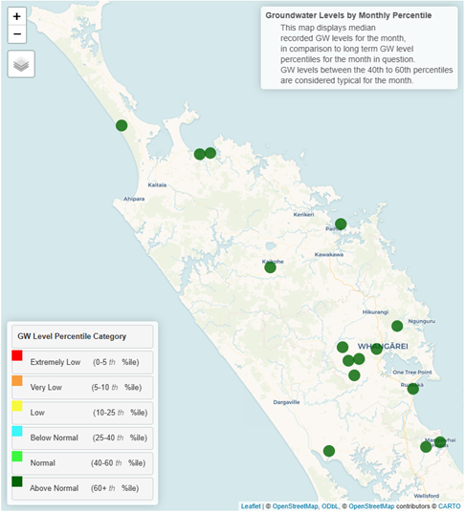
Groundwater levels in all key aquifers rose significantly in autumn and have remained elevated across all key aquifers in June (figure 6).
Figure 6: Groundwater levels in Northland’s key monitored aquifers for June 2025.
Soil moisture
Soil Moisture has remained at close to field capacity throughout June. Significant rainfall in July will result in runoff (figure 7). The soil moisture deficit is calculated based on incoming daily rainfall (mm), outgoing daily potential evapotranspiration (mm), and a fixed available water capacity (the amount of water in the soil 'reservoir' that plants can use) of 150 mm”.
Figure 7: Calculated daily soil moisture values at key areas around Northland, courtesy of NIWA.
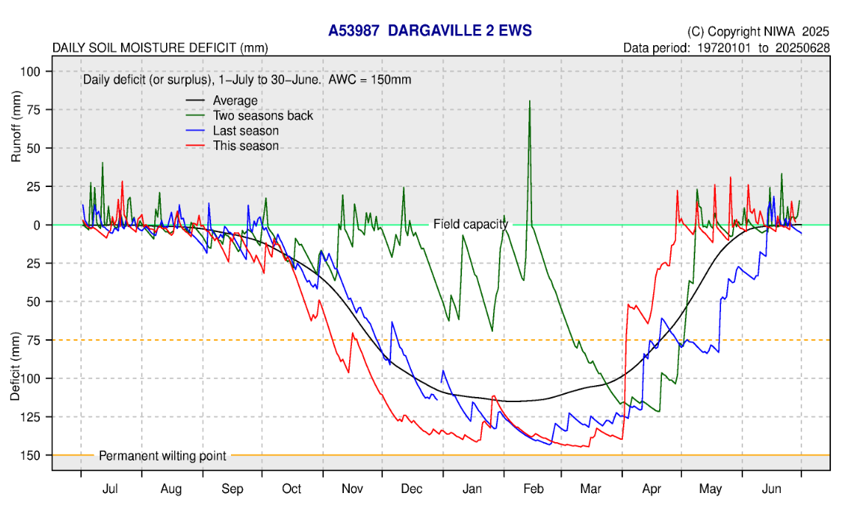 Figure 7: Kaitaia calculated daily soil moisture values - June 2025
 Figure 7: Kaikohe calculated daily soil moisture values - June 2025
 Figure 7: Kerikeri calculated daily soil moisture values - June 2025
 Figure 7: Whangārei calculated daily soil moisture values - June 2025
 Figure 7: Warkworth calculated daily soil moisture values - June 2025

Climate Outlook for July – September 2025
Summary of climate forecasts from NIWA and MetService
Neutral El Niño conditions are set to continue between July – September, with the weather in Northland likely to be influenced by tropical, sub-tropical, and low-pressure events. In Northland temperatures and rainfall is likely to be higher than average, while soil moisture levels and river flows are likely to be near average. Cold snaps will occur as southerly systems come though periodically, but these will be less common than normal.
NIWA’s full outlook can be found at: Seasonal Climate Outlook (NIWA)
Table 1: Forecasted likelihood of above, near or below average climate conditions for Northland from July – September 2025, courtesy of NIWA.
(Expressed as % likelihood).
| Temperature | Rainfall | Soil moisture | River flows | |
| Above average | 60• | 45• | 40• | 35 |
| Near average | 30 | 35 | 40• | 45• |
| Below average | 10 | 20 | 20 | 20 |

