Economic quarterly | October 2025
8 Oct 2025, 9:45 AM
What's trending
Northland’s essentials: Price pressures and a rental reprieve
Northland households are navigating a mixed economic landscape, with sharp increases in essential costs offset slightly by a recent dip in rental prices. Over the year to June 2025, electricity and food prices have climbed faster than incomes, putting pressure on household budgets, especially for those on fixed incomes.
Check out the stats:
Electricity and food
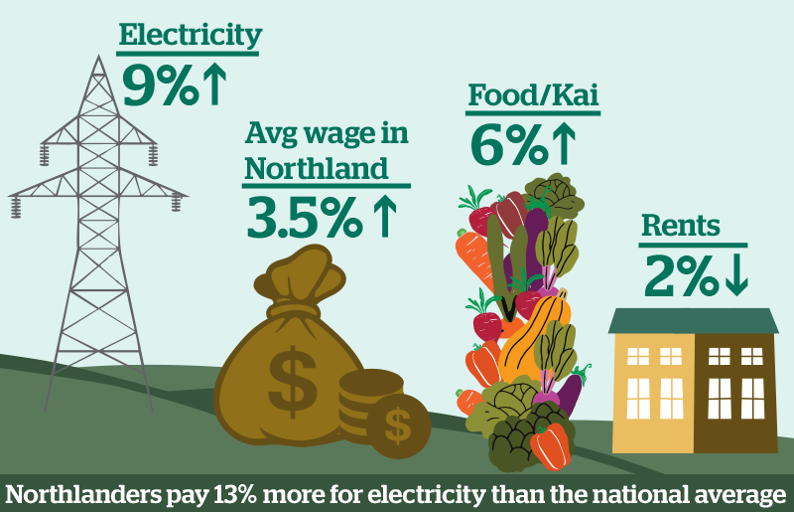
- Electricity prices rose 9 percent over the past year
- Food prices increased 6 percent
- Northland households pay 13 percent more for electricity than the national average
- For a household using 7000 kilowatt-hours per year, that’s an extra 7 dollars per week
Incomes
- Average wage and salary earnings in Northland and NZ Superannuation payments rose 3.5%, slower than the recent rise in essential costs
Rental relief
On the positive side, the average cost of a new rental has declined by 2% over the past year, falling from $536 in June 2024 to $525 in June 2005.
The price and incomes shift since 2020
Since the start of 2020, most notably the beginning of the COVID-19 pandemic, prices for essentials has climbed by around 30 percent. The recent dip in rental prices offers some relief, although it follows a steep rise in earlier years (2020-2022). Meanwhile, the recent sharp increase in electricity costs comes after several years of relatively low increases.
Average earnings and NZ superannuation payments have also risen by around 30% over the past five years. The gap between household income and cost remains a challenge. This is especially true for people on fixed incomes or those who have lost employment. There can also be lags between income and price increases.
Together, these trends show that while some pressures may ease, the overall cost of living remains a concern for many Northland households.
What's changed
Northland’s tourism: Adapting, attracting, evolving
Post-covid rebound and regional shifts
Northland’s tourism sector has had a quiet transformation in recent years, marked by resilience, shifting visitor patterns, and a recalibration of regional flows. While international tourism in Northland remains subdued following Covid-19, the region’s domestic tourism economy has shown notable signs of recovery and adaptation.
Check out the stats:
Domestic Tourism: Recovery with a twist
- Domestic tourists spent $536 million in Northland (year to June 2025).
- Down just 0.5% from last year, but 9.4% lower since 2020.
- Northland’s share of national domestic tourism spend has slipped:
- 5.2% in 2020/21
- 4.8% in 2024/25 (suggests intensified competition among regions or changing travel preferences.)
- Seasonality is strong:
- 25% of all spending happens in December and January.
- How people spend:
- Retail (fuel, alcohol, food, beverages): 68%
- Food & beverage services: 16%
- Accommodation: 7%
Seasonality remains a defining feature of Northland’s tourism sector, with a quarter of all spending concentrated in December and January. This pattern, combined with the dominance of retail, food, and accommodation spending, highlights Northland’s ongoing appeal as a short-stay, drive-in destination for both locals and visitors from nearby regions.
Auckland–Northland tourism exchange
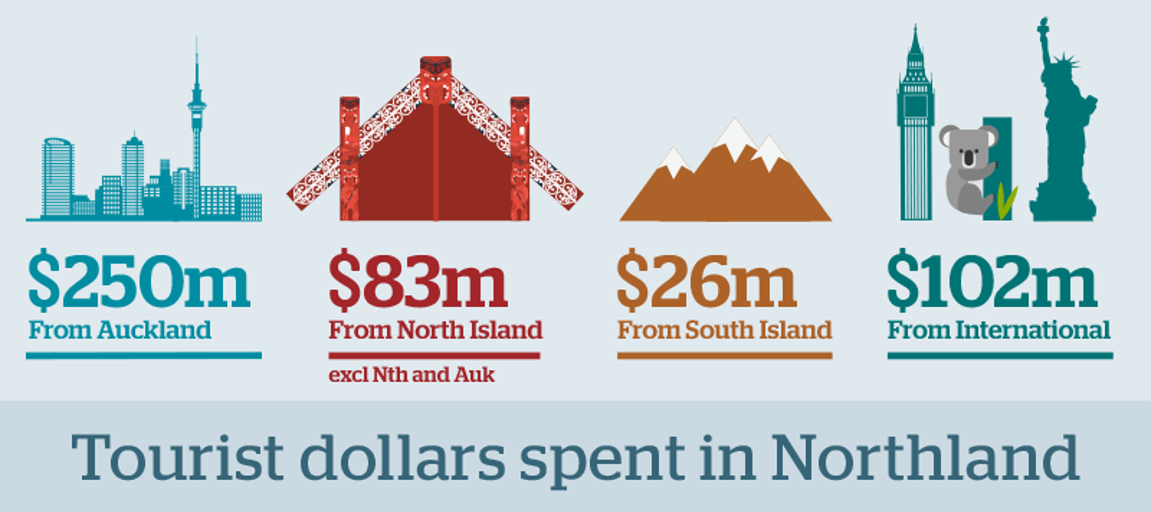
Tourism flows between Northland and Auckland reveal a fascinating exchange. This dynamic points to a growing appetite for local experiences and signals new opportunities for intra-regional tourism development.
- Aucklanders spent $245 million in Northland (47% of total domestic tourism spend).
- Northlanders spent $396 million outside the region, with $251 million going to Auckland.
Local tourism:
- Northland residents spent $176 million within their own region (31% of their total domestic tourism spend).
This near balance (87%) between outbound and inbound tourism spending highlights the interdependence of Northland and Auckland and shows the importance of maintaining strong transport and visitor infrastructure links.
Accommodation: Budget-friendly and seasonal
- 1.4 million guest nights in commercial accommodation (year to June 2025).
- 6% of NZ’s total.
- Accommodation types:
- Hotels/motels: 3.5% of NZ’s total in this category.
- Backpackers/holiday parks: 10.1% of NZ’s total.
- Peak season:
- January: 303,000 guest nights (22% of annual total).
- Occupancy rates: Peaked at 67% (Jan 2024), low of 13% (Sept 2022).
International visitors: A slow return
- International visitors = 13% of guest nights in Northland (vs 28% nationally).
- Pre-pandemic: About one-third of guest nights were international.
This slower recovery suggests that while domestic tourism has largely rebounded, international visitation remains subdued, potentially due to flight connectivity, marketing reach, or broader global travel trends.
District-level insights: Far North leads the way
The Far North district emerged as the regional accommodation leader, with 1.02 million guest nights and the highest average occupancy rate. Whangārei followed with 508,000 guest nights and a 35% occupancy rate, while Kaipara recorded 228,700 guest nights and a 28% rate.
What's new
Child poverty in Northland: Progress and persistent gaps
Child poverty is one of the most telling indicators of wellbeing, and one of the most complex. In New Zealand, it’s tracked using three key measures:
- Material hardship (children missing six or more essentials)
- Income after housing costs (below half the 2017/18 median)
- Income before housing costs (below half the current median)
These indicators blend lived experience with income data, helping guide government targets and track progress. In Northland, the latest figures show meaningful improvements, but also highlight where gaps remain.
Before Housing Costs (BHC)
In 2024, around 5,900 children in Northland lived in households earning less than half the median income before housing costs. This represents 13 percent of children in the region and marks a significant drop from 19 percent in 2020–21. Northland now sits close to the national average.
However, the region still ranks fourth highest out of 12 regions, with Southland recording the highest rate at 22 percent. The improvement is encouraging, but Northland remains among the areas with the greatest need.
After Housing Costs (AHC)
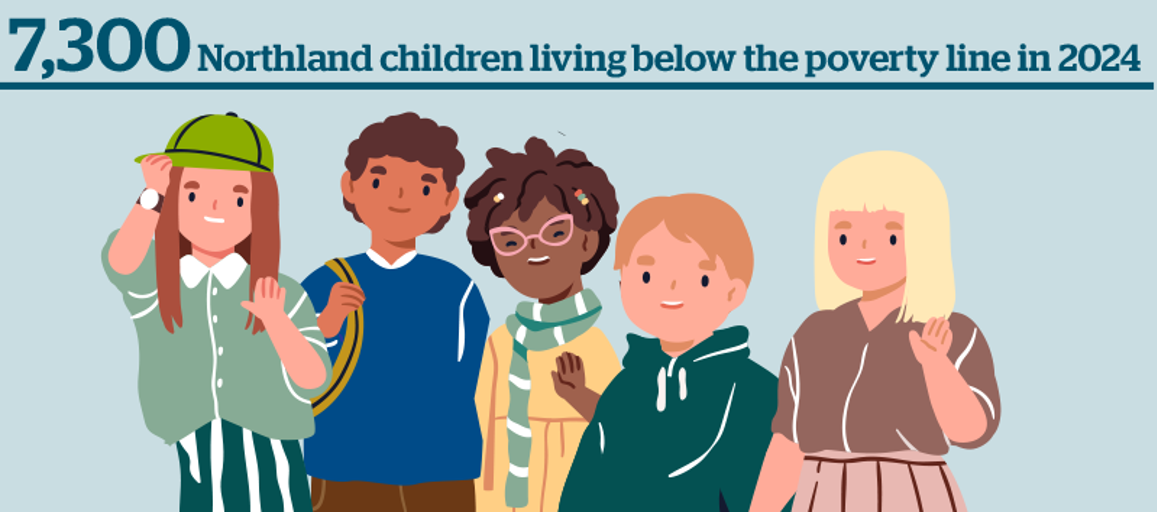
When housing costs are considered, the picture shifts. Around 7,300 children, or 16 percent, lived below the poverty line in 2024. This rate is slowly declining but remains above the national average of 13 percent.
Northland ranks sixth overall, with Waikato showing the highest rate at 17 percent. Housing affordability continues to be a major pressure point for families in the region.
Material hardship
Material hardship affected nearly 5,800 children in Northland in 2024, or 13 percent of the child population. This means their households lacked basics such as fresh food, heating, or the ability to pay bills.
While this measure has improved since 2019, it has risen slightly from its lowest point in 2021, when it sat at 9 percent. Northland is now at the national average, but still behind regions like Otago and Nelson/Tasman/Marlborough, which reported the lowest rates.
Why it matters
Despite the progress, many tamariki in Northland continue to face daily challenges that affect their health, education, and future opportunities. These figures show that poverty is not just about income, but also about access to the essentials that support a good life.
The data highlights the importance of targeted support and investment to ensure every child in Northland has what they need to thrive. The gains made so far are promising, but they need to be sustained and strengthened to close the gap with other regions.
What's coming up
Bream Bay: Investment interest builds, opportunities emerge
In recent months, a series of announcements have highlighted growing interest in the Bream Bay area, with both public and private sector organisations exploring significant investments.
Some projects are confirmed and moving ahead, while others are still in the feasibility stage. Many of these investments are interlinked, with infrastructure developments supporting future business expansion and regional logistics.
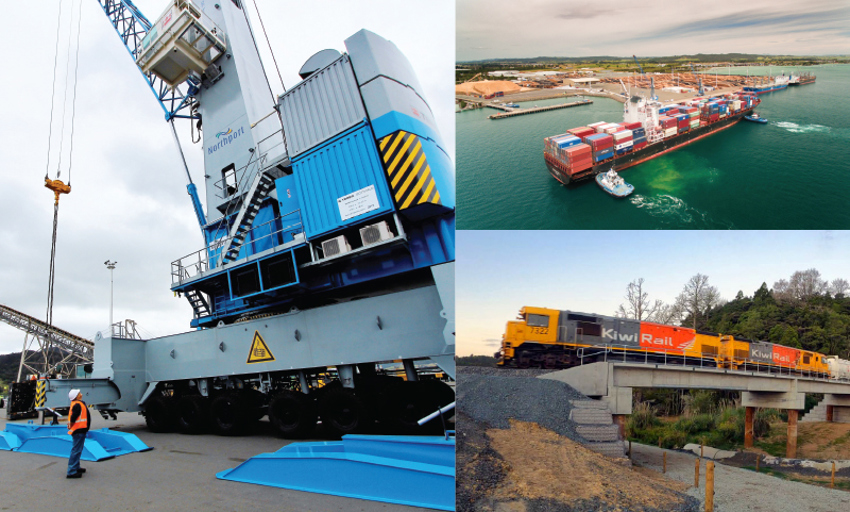
One example is the proposed container expansion at Northport, which depends heavily on land transport infrastructure, including the Marsden Point Rail Link.
Prior to the closure of refining operations at Marsden Point in 2022, Bream Bay (including One Tree Point and Ruakaka) contributed around 1.2 billion dollars in GDP, accounting for approximately 12 percent of Northland’s total economic activity. By 2024, GDP generated in the area had fallen to an estimated 440 million dollars, or about 4 percent of the region’s GDP. This shift does not include the value of goods and services purchased from contractors outside the area, but it does reflect the significant economic impact of the refinery’s closure.
Restoring economic momentum
The closure of refining operations at Marsden Point marked a turning point for Bream Bay’s economy. Once a major contributor to Northland’s GDP, the area has seen a significant decline in output. However, the recent wave of investment interest suggests a potential shift. If even a portion of the proposed projects go ahead, they could help restore economic momentum and create new opportunities for businesses and communities across the region.
The following table summarises the publicly available information on several of these projects.
| Project | Main proponent | Description | Indicative value of investment | Status | Potential impact |
| Marsden Point Rail Link | KiwiRail | A 19km rail link corridor linking the North Auckland line at Oakleigh to Northport. | Not available but likely to > $1 billion | Land purchased, reference design and detailed business case completed. Seeking commercial, technical and financial options to build from the market. | Transport benefits from reduced road congestion and improved safety; strategic benefits from supporting Northport as an improved logistic hub. |
| Container Terminal Expansion | Northport | 250 metre wharf extension and container terminal requiring reclamation of approximately 11.7 hectares of coastal marine area and 1.72 million cubic metres of capital dredging. | Not available but likely to be >$500 million | Resource consent granted by Environment Court on 2 October. Construction will begin once the business case stacks up. | Estimated to create an extra $160 million GDP per annum and approximately 1,500 new jobs by 2060, assuming efficient transport links to Auckland. |
| Northland Dry Dock | MBIE through Kānoa - Regional Economic Development & Investment Unit | Development of a dry dock and surrounding marine maintenance facilities capable of servicing the larger Royal New Zealand Navy ships and commercial vessels such as the Cook Strait ferries which currently have to travel off shore. | Not available but likely to be >$500 million | Indicative business case completed and MBIE actively seeking an infrastructure delivery partner. | Estimated to bring an additional $290 million GDP per annum and approximately 1,135 new jobs by 2060 as a mid-case estimate. |
| Marsden Point Energy Precinct | Channel Infrastructure | A variety of additional fuel storage opportunities, future fuels manufacturing, potential electricity firming and storage located on the CI site, utilising existing assets such as land zoning, 220kV electricity and gas connections, deep water harbour, and pipeline access to Auckland. | Not available but likely to be >$500 million | Certain aspects such as new jet fuel storage and bitumen import terminal are being built. Development of bio-refinery options still progressing. | Once fully operational the total project could generate around $290 million annually in GDP and contribute around 1,150 FTE jobs. |
| Ruakākā Solar Farm | Meridian | Meridian’s first grid-scale solar development on 201 ha, comprising 250,000 solar panels capable of producing up to 230GWh of electricity per year. Located next to the 100MW Ruakākā Battery Energy Storage System (BESS), New Zealand’s largest battery facility, which was commissioned in May 2025. | $227 million | Construction about to commence and be completed late 2026. | Produce enough to power around half the homes in Northland. |
| Kingfish Recirculating Aquaculture System (RAS) | NIWA | Development of a RAS facility capable of producing 3000 tonnes of kingfish per annum . | $120 - $150 million | A 600-tonne facility is operating to prove the production and commercial viability. | Estimated to create 75 additional jobs |
Disclaimer: This e-newsletter provides general information on the Northland economy and the views expressed are those of the authors. It is not intended for any course of action nor as a substitute for financial advice.


