Formal trend analysis
All trends are based on flow adjusted data except for two sites; Waiarohia Stream at Whau Valley and Waipoua River at SH12. Currently there is only three years of flow data for the Waipoua River which is not enough for trend analysis and there is no data yet for the Waiarohia Stream at Whau Valley.
It should be noted that the number of samples for each site and parameter varies because sampling was started in different years for each site and there are some missing results. The trend analysis was done on data from October 1996 to June 2010 for all sites where this data was available (including the national network sites). However, for sites that were added to the network later that October 1996, the trend analysis included data from when sampling began at these sites.
Table 2: Trend results for the 21 RWQMN sites (red arrows indicate deteriorating trend, green arrow indicates improving trend, ID = insufficient data, BD = more than 10% of the samples are below detection limit).
|
Site |
Cond |
DO% |
DO |
Ecoli |
pH |
Clarity |
Turb |
Temp |
TKN |
NH4 |
NNN |
TN |
DRP |
TP |
|
Awanui Waihue channel (Oct 1996) |
↑ |
↓ |
↓ |
|
|
|
|
↓ |
|
BD ↓ |
|
|
↓ |
↓ |
|
Awanui FNDC take (Oct 1996) |
↑ |
↓ |
|
|
|
|
|
|
|
|
|
|
|
|
|
Kaihu (Jul 2002) |
|
↓ |
↓ |
|
|
|
|
|
|
BD ↓ |
|
|
|
|
|
Mangahahuru Apotu Rd (Oct 1996) |
↑ |
↑ |
|
|
↑ |
↑ |
|
|
|
↓ |
|
|
↓ |
↓ |
|
Mangahahuru Main Rd (Jun 2005) |
|
|
|
|
|
|
↑ |
|
|
|
|
|
|
|
|
Mangakahia Titoki bridge (Oct 1996) |
|
↓ |
|
|
|
|
|
|
|
↓ |
↓ |
↓ |
↑ |
|
|
Mangakahia Twin Bridges (Oct 1996) |
↑ |
|
ID |
|
↑ |
|
|
|
|
BD ↓ |
|
|
↓ |
↓ |
|
Manganui (Aug 2001) |
|
|
|
|
↑ |
|
|
|
|
|
|
↓ |
|
↓ |
|
Mangere (Oct 1996) |
|
↑ |
↑ |
|
↑ |
↑ |
↓ |
↓ |
|
↓ |
↓ |
↓ |
↓ |
↓ |
|
Opouteke (Oct 1996) |
↑ |
|
ID |
↑ |
↑ |
|
|
|
|
BD ↓ |
BD ↓ |
|
BD ↓ |
↓ |
|
Punakitere (Aug 2001) |
|
|
|
|
↑ |
↑ |
|
|
↓ |
BD ↓ |
|
↓ |
↓ |
↓ |
|
(Oct 1996) |
|
|
|
|
↑ |
↓ |
BD ↑ |
↓ |
|
BD ↓ |
|
|
↓ |
↓ |
|
Waiarohia Second Ave (Jul 2005) |
|
|
|
|
↑ |
↑ |
↓ |
|
↓ |
|
|
|
↓ |
↓ |
|
Waiarohia Whau Valley (Jul 2005) |
|
|
|
|
↑ |
↑ |
↓ |
|
↓ |
|
↑ |
|
|
↓ |
|
Waiotu (March 2000) |
|
|
|
|
|
|
|
|
↓ |
|
|
|
|
|
|
Waipapa (Oct 1996) |
↑ |
|
|
|
↑ |
↑ |
↓ |
|
|
↓ |
↓ |
↓ |
↓ |
↓ |
|
Waipoua (Jul 2002) |
|
↓ |
↓ |
|
↓ |
|
|
|
|
BD - |
|
|
|
|
|
Wairua (Oct 1996) |
↑ |
↑ |
↑ |
|
↑ |
↑ |
|
|
|
↓ |
↓ |
|
↓ |
|
|
Waitangi Waimate North (Aug 1999) |
|
|
|
|
|
|
|
|
|
BD ↓ |
|
|
|
|
|
Waitangi Watea (Oct 1996) |
|
↑ |
↑ |
|
↑ |
|
|
|
↑ |
|
|
|
↓ |
↓ |
|
Whakapara (Oct 1996) |
|
↑ |
|
|
↑ |
|
|
|
|
|
↓ |
|
↓ |
↓ |
Maps showing trends
The results from the formal trend analysis have been summarised into the maps below in the following way:
· Insufficient data for this particular parameter at this site
· No significant change (P >0.05)
· Significant increase or decrease (P £0.05)
· Meaningful increase or decrease (P £0.05) and the magnitude of the trend is greater than 1% per annum of the raw data median
Temperature
Three sites had significant trends for temperature, all of which were a meaningful and decreasing trend. At this stage, these trends for all sites (Awanui River at Waihue channel, Mangere River and Victoria River) are seen as improvements. These trends are consistent with trends reported by Larned et al (2004) which found that there were positive decreasing trends in temperature at a national scale.
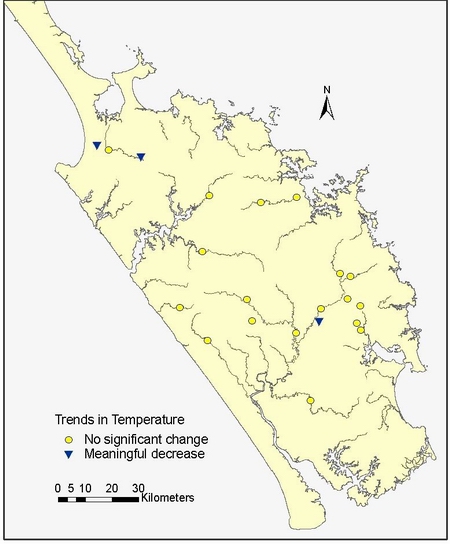
Figure 12: Trends in temperature (°C) at 21 RWQMN sites
Dissolved oxygen
There were ten sites with significant trends for dissolved oxygen, nine of which were meaningful. Decreasing trends were observed in the Awanui, Kaihu, Mangakahia (Titoki Bridge) and Waipoua Rivers, all of which are deteriorating trends as dissolved oxygen levels are often below the recommended guideline range. Ballantine and Davies-Colley (2009) also recorded a significant decreasing trend at Mangakahia at Titoki Bridge.
Five sites had increasing trends in dissolved oxygen. Two of these sites (Mangere River and Waitangi River at Watea) had an improving trend as levels are often below the guideline range. Ballantine and Davies-Colley (2009) did not find any significant increasing trends in dissolved oxygen (%) at any other the four Northland National River Water Quality Network (NRWQN) sites. The time period used for the analysis of the data may explain the different results
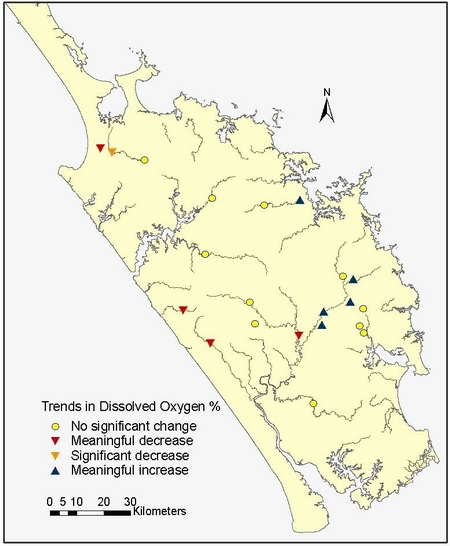
Figure 13: Trends in dissolved oxygen (% saturation) at 21 RWQMN sites
Conductivity
Seven sites had significant increasing trends in conductivity, all of which were meaningful as well. Ballantine et al (2010) also reported an overall increasing trend in conductivity in the Northland regions and at a national scale.
These trends are all likely to be deterioration in water quality at these sites as conductivity is generally used as an indicator of water pollution. However, as conductivity is increasing in both pastoral (Awanui, Mangahahuru (Apotu Rd) and Wairua Rivers) and native/plantation forest classes (Mangakahia (Twin Bridges), Opouteke and Waipapa Rivers) it indicates that intensification may not be the major cause of this trend. Temporal changes in air temperature and precipitation may have influenced these trends (Larned et al, 2004).
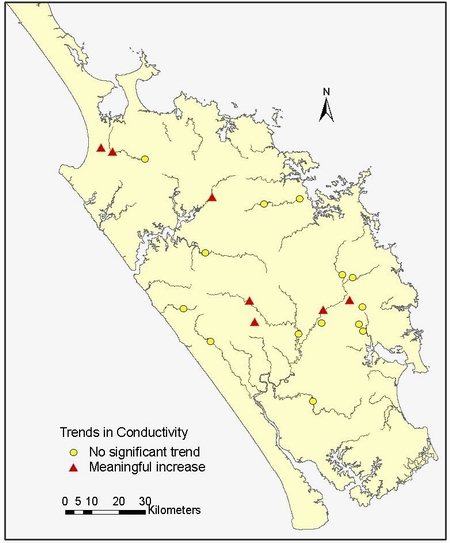
Figure 14: Trends in conductivity (mSm) at 21 RWQMN sites
PH
Fourteen sites showed significant changes in pH, of which all were meaningful trends. The Waipoua River was the only site to have a decreasing trend which is seen as a positive trend as the median pH is 7.35 for the 2009/2010 year which is slightly alkaline. Five of the 13 increasing trends are regarded as a negative trend as the pH is often falling above the guideline range (becoming more alkaline). Other New Zealand studies have typically found decreasing trends in pH (Vant and Smith, 2004. Scarsbrook, 2006).
Improvements were seen in the Mangahahuru, Mangere, Victoria, Waiarohia, Waipapa and Whakapara catchments (all increasing pH trends). Factors such as geology, climatic conditions and changes in nutrient levels can all affect the pH of water. It is likely that improvements seen in the highly modified catchments (Mangahahuru, Mangere and Whakapara Rivers) are linked to decreases in nutrient concentrations (see trends table on pg 16).
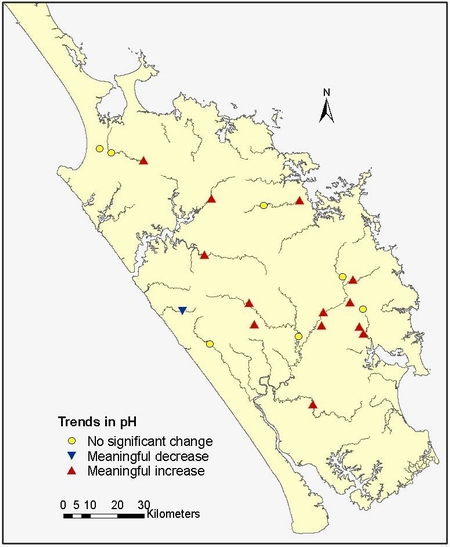
Figure 15: Trends in pH at 21 RWQMN sites
Turbidity
Significant turbidity trends were observed in six of the 21 sites. The only negative trend was seen in the Mangahahuru Stream at Main Rd which has increase in turbidity at a rate of 0.43 NTU per year. The Victoria River also had an increasing turbidity trend however more than 15% of the samples were below the detection limit therefore the trend is not valid. Positive decreasing trends were seen in the Mangere, Waiarohia and Waipapa catchments. Corresponding increases in water clarity were also observed at these sites which indicates that there has been a reduction in suspended sediments entering the streams.
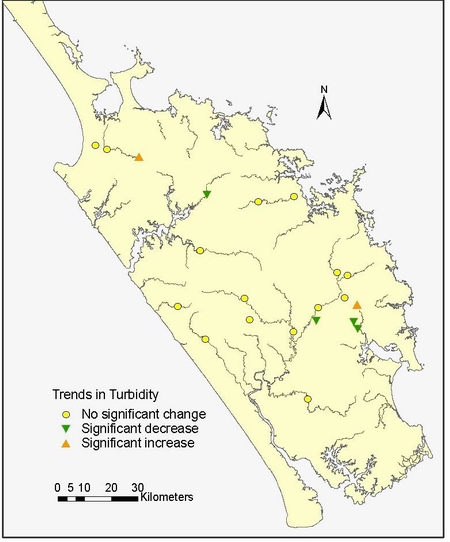
Figure 16: Trends in turbidity (NTU) at 21 RWQMN sites
Water clarity
Eight of the 21 sites had significant changes in water clarity, of which only one site, Victoria River, had a decreasing trend. The rest had positive increasing trends in water clarity. There are correlating trends in turbidity at four of these sites (Mangahahuru at Apotu Rd, Mangere and both Waiarohia sites). Ballantine and Davies-Colley (2009) and Larned et al (2004) found a positive trend in clarity at a national scale. However, Ballantine and Davies-Colley (2009) also found a decreasing trend at three of the four Northland NRWQN sites which is inconsistent with our findings. A difference in the time period used for data analysis explains the different results in water clarity trends.
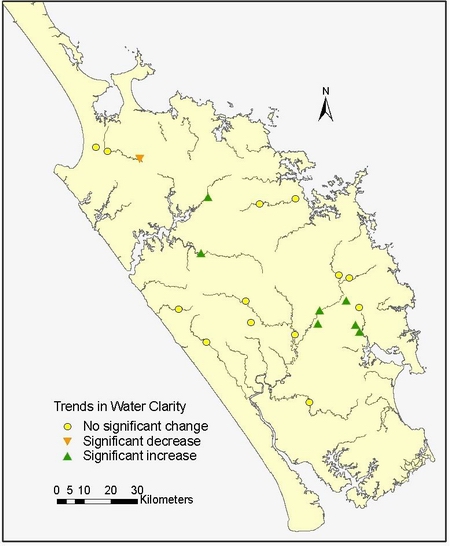
Figure 17: Trends in water clarity (m) at 21 RWQMN sites
Escherichia coli
Only one site, Opouteke River, had a significant trend in E. coli. It is only a small increase of 12 MPN/100ml/year and the median of 160 is well below the recreational guideline of 550 E. coli/100ml. The cause of this increase is unknown at this stage. Faecal source tracking investigations are being carried out to look at the potential source of bacteria in this catchment.
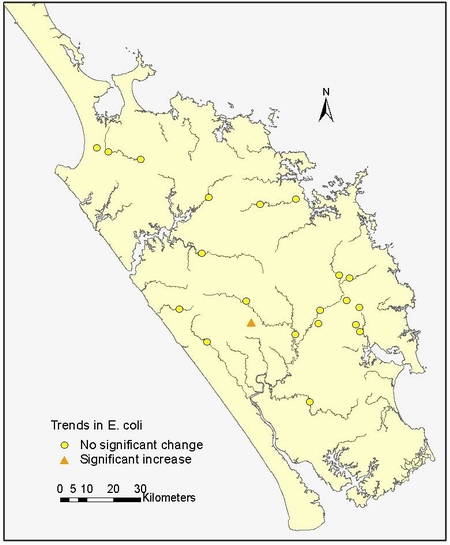
Figure 18: Trends in E. coli at 21 RWQMN sites
Ammoniacal nitrogen
Thirteen sites showed significant decreases in ammoniacal nitrogen. However, eight of these sites had more than 15% of samples below the detection limit therefore the decreasing trend is likely to be a result of changes in the detection limit rather than an actual change in ammoniacal nitrogen levels. The other five sites (Mangahahuru Stream at Apotu Rd, Mangakahia River at Titoki, Mangere River, Waipapa River and Wairua River) had less than 15% of the samples below the detection limit so therefore the trend is valid. These results are consistent with a report compiled by Ballantine et al (2010) who found an overall decreasing trend in ammoniacal nitrogen for Northland.
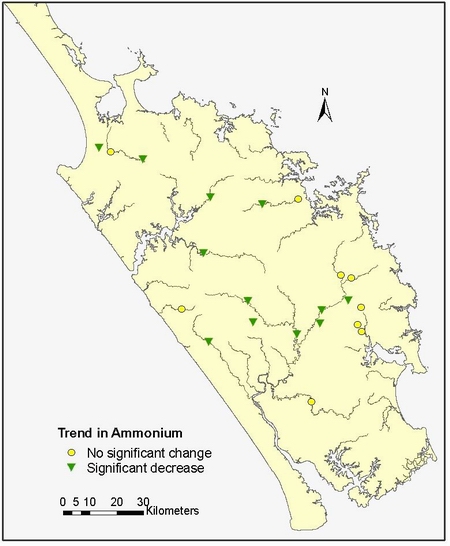
Map 19: Trends in Ammoniacal nitrogen at 21 RWQMN sites
Nitrate/nitrite nitrogen
Seven sites had significant trends in nitrate/nitrite nitrogen. Only one site, Waiarohia Stream at Whau Valley, had a significant but not meaningful increasing trend. The trend for Opouteke River is deemed invalid as more than 15% of samples were below the detection limit. Decreasing trends were observed in the Mangakahia (Titoki site), Mangere, Waipapa, Wairua and Whakapara catchments. An overall decreasing trend for oxidised nitrogen for the Northland region was also reported by Ballantine et al (2010). As the majority of these sites are situated in pastoral catchments, improvements such as riparian fencing and reducing point source discharges are the likely reason for these decreases in nitrogen concentrations.
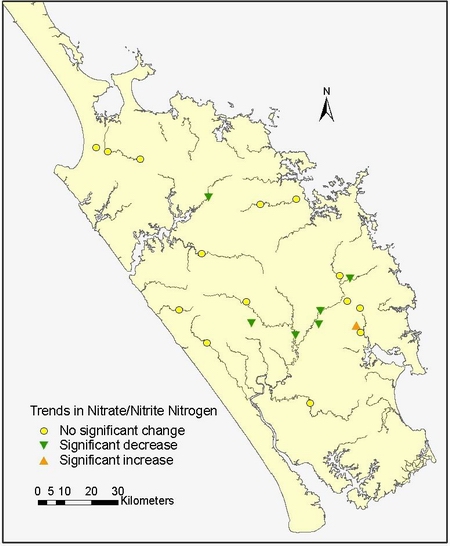
Figure 20: Trends nitrate/nitrite nitrogen (g/m³) at 21 RWQMN sites
Total Kjeldahl nitrogen
Significant decreasing trends in total kjeldahl nitrogen were observed in the Punakitere River, Waiotu River and Waiarohia Stream (both sites). Only one site, Waitangi River at Watea, had an increasing trend. As this is a NRWQN site, total kjeldahl nitrogen has been calculated by subtracting the concentration of nitrate from the concentration of total nitrogen (i.e. TN - NO³ = TKN).
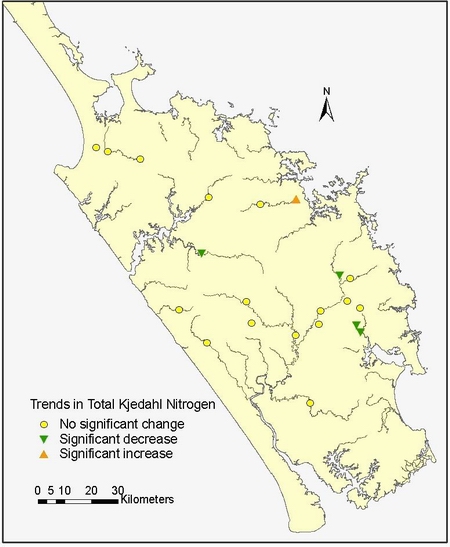
Figure 21: Trends in total kjedahl nitrogen (g/m³) at 21 RWQMN sites
Total nitrogen
Five sites showed significant decreasing trends in total nitrogen. These were Mangakahia (Titoki site), Manganui, Mangere, Punakitere and Waipapa Rivers. All of these sites, except the Manganui River, have corresponding decreasing trends in other nitrogen species. The Northland region has an overall decreasing trend in total nitrogen according to Ballantine et al, 2010, however, at a national scale a significant increasing trend for total nitrogen was found at the NRWQN sites (Ballantine & Davies-Colley, 2009).
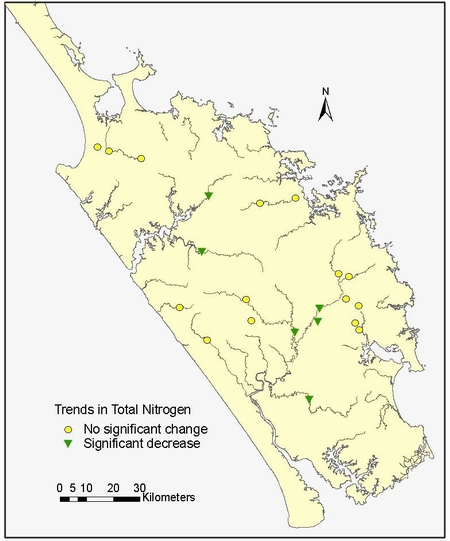
Figure 22: Trends in total nitrogen (g/m³) at 21 RWQMN sites
Dissolved reactive phosphorus
Thirteen of the 21 sites had changes in dissolved reactive phosphorus concentrations. Mangakahia River at Titoki was the only site observed with an increasing trend. The trend result for the Opouteke River is ignored as more than 15% of the samples are below the detection limit.
Ballantine and Davies-Colley (2009) found that there were meaningful increases in dissolved reactive phosphorus at 22 national river water quality sites, three of those sites were Northland sites (Mangakahia River at Titoki, Waitangi River at Watea and Wairua River). Difference in results may be due to the different time periods used when calculating the trends.
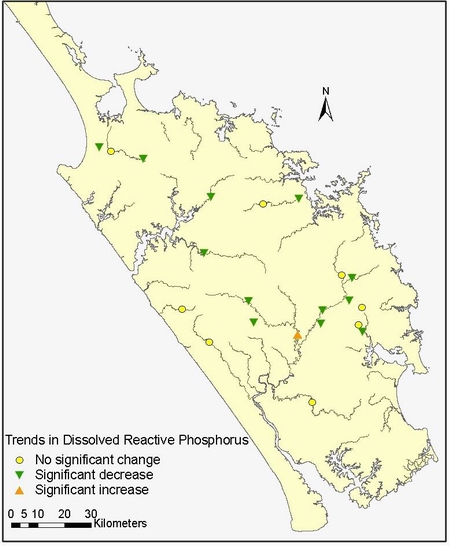
Figure 23: Trends in dissolved reactive phosphorus at 21 RWQMN sites
Total phosphorus
Thirteen river network sites had significant decreases in total phosphorus levels. None of these trends were observed to be meaningful. All but three sites, Manganui, Wairua and Waiarohia at Whau Valley, have corresponding decreases in dissolved reactive phosphorus. Two of ten sites are part of the NRWQN; Waipapa River and Waitangi River at Watea. Ballantine and Davies-Colley (2009) found that there was an increasing trend in total phosphorus at three of the four NRWQN sites in Northland. Differences in results are due to the difference in time period used for the data analysis.
Previous trend results showed an increasing trend in dissolved reactive phosphorus and total phosphorus in the Waipoua River (NRC, 2007). Current results show that there is no significant trend for either parameter indicating that there have been changes in the Waipoua catchment. As this catchment is predominately native; increased concentrations of phosphorus in the past is likely to have come from erosion in the catchment during rainfall events.
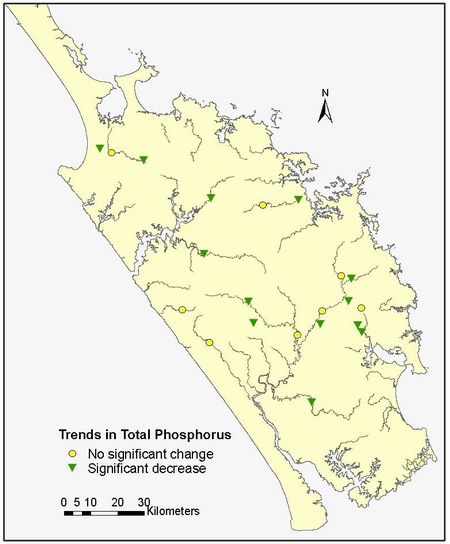
Figure 24: Trends in total phosphorus (g/m³) at 21 RQWMN sites