Introduction
Northland's River Water Quality Monitoring Network was established in September 1996 and initially included nine river sites throughout Northland. Since 1996 a further 11 sites have been added to the network. The four Northland sites in the National River Water Quality Network monitored by National Institute of Water and Atmospheric Research Limited (NIWA) are also incorporated into our regional network. So there are currently 24 sites throughout Northland monitored monthly for water quality. These sites are shown in figure 1 (below) and table 4 in appendix A.
This report looks at the current state of water quality in 2006 at 21 of these sites (excludes three sites added in August 2006) and compares water quality to the ANZECC guidelines (ANZECC 2000) for aquatic ecosystems and the recreational bathing guidelines (MFE 2002). This report also looks at trends in medians for all 21 sites and presents the results of a formal trend analysis for 18 sites.
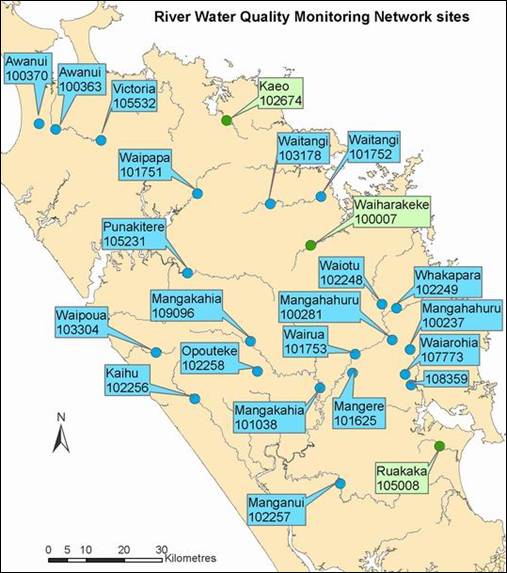
Figure 1: Map showing 24 RWQMN sites. Note: the three sites shown in green were only added to the network in August 2006 and therefore do not have results presented in this report.