Infrastructure
Infrastructure is an integral part of modern life. We use roads or trains to get to work and visit friends; we use electricity to run our factories, light our homes and power our appliances; we use telecommunications to talk to people near and far away, and to inform and entertain us.
Infrastructure is important for the services it provides rather than for its own sake. At its best, it attracts businesses, improves productivity and makes our lives more pleasant. Well-chosen and operated infrastructure can bring benefits that extend for many generations.
Infrastructure is also expensive to build and maintain, and can have significant environmental and social impacts. If we don't choose wisely, it may reduce our quality of life and add to the burdens faced by our children.
Social infrastructure is also included and typically covers schools, universities, hospitals, prisons and community housing. However, social infrastructure does not include the provision of social services, such as the provision of teachers at a school or custodial services at a prison.
Historical growth in Northland, in terms of both population and economy, has resulted in substantially increased demands on Northland's infrastructure in recent years. This demand will continue because the population of the region is expected to continue to grow (albeit at a slower pace than historically experienced).
Historically, the Northland economy has been largely based in primary agricultural and forestry production. However, from an infrastructure perspective the focus is moving towards high-volume energy, communications and transport networks and an expectation of modern, quality municipal utilities (such as water and wastewater).
The Whāngārei urban centre is a key commercial and population hub for the region, as well as a critical ‘gateway' node in regional transport, power and telecommunications networks. While maintenance and upgrading of Whāngārei's existing infrastructure will be a critical element in the region's future growth, other urban and commercial centres are emerging throughout the region which will also require strategic investments.
A geographically balanced approach to infrastructure spending is therefore essential to ensure that economic development throughout the region is evenly distributed, equitable and of maximum benefit to the people of Northland.
What are the issues affecting infrastructure in Northland?
The quality of infrastructure has traditionally been a contributing factor to Northland's less favourable position in comparison to other regions in New Zealand, particularly in terms of economic performance and social and community well-being. Nevertheless, there have been a number of improvements in recent years, which are helping to reverse previous poor performance.
Continued investment in infrastructure will help lift the region by encouraging business growth and employment opportunities, enhancing health and safety, improving communication and helping to relieve pressure on the environment.
The Regional Policy Statement for Northland details council and community objectives for each natural and physical resource in the region. These are listed as ‘Environmental Results Anticipated' and for infrastructure the policy statement splits them into three subject areas: transport; energy; and waste.
Although not included in the operative Regional Policy Statement, other infrastructure of importance to the region includes telecommunications (particularly mobile and broadband), municipal wastewater and water reticulation.
Telecommunications infrastructure
What do we want for telecommunications (including broadband) infrastructure in Northland?
Most Northland homes have a landline phone. Cellular coverage is patchy in the region with some areas, mainly in the west, requiring additional infrastructure. In 2006, more than 20 percent of households had access to broadband. In 2009, this figure rose to more than 61% (Statistics NZ). However, this rate is relatively low compared to other regions in New Zealand.
In terms of accessing and using this technology, the most important factor to consider is the speed of access. Unfortunately no data is available relating to speed, other than a general distinction between internet access and broadband access. There is no information to compare what speed of service is provided as there can be large variances between the capability of broadband and ultra-fast broadband.
Central government is seeking to improve internet access speeds in New Zealand, through two initiatives. The first is the ultra-fast broadband initiative, which is a $1.5 billion investment in broadband infrastructure for urban areas. Whāngārei was the first city to receive funding and begin laying fibre in 2011.
The second initiative is the rural broadband initiative which seeks to facilitate the necessary investment in technology to improve the broadband capability of the fixed and wireless networks in rural New Zealand. The contract is being undertaken by a joint partnership between Telecom (Chorus) and Vodafone.
Information communications technology is thought to bring about fundamental changes in our economic and social lives. It can also provide environmental benefits such as reducing the need to travel (European Union: 2009).
Water and wastewater infrastructure
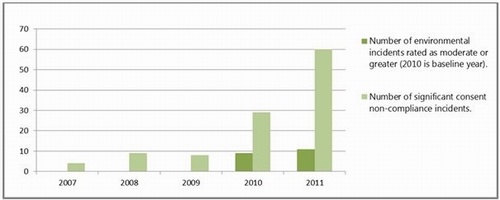
Figure 30: Public wastewater environmental incidents rated as moderate or greater (from 2010) and significant consent non-compliance incidents (Note: due to changes in reporting categories in 2009, the baseline year is 2010)
What do we want for water and wastewater infrastructure in Northland?
Wastewater
Historically there has been a lack of suitable sewage reticulation and treatment infrastructure in high growth areas of the region. However, since 2007, wastewater upgrades have come online in both Mangawhai and Whāngārei, and consents have been granted for new wastewater reticulation in Ruakaka and Kerikeri.
There are also known problems with some existing wastewater infrastructure as demonstrated by incidents of (untreated) sewage flowing into watercourses after storm events. Figure 30 shows the number of incidents that were rated moderate or significant – as determined by council staff – arising from public wastewater reticulation since 2010 (unfortunately due to a change in methodology from 2009, it is not possible to compare results earlier than this). The table also records incidents of significant non-compliance from consented wastewater schemes. (Note: the spike since 2009 can be attributed to a reclassification of non-compliance to ‘significant' of instances where a management plan has not been provided.)
There have been significant improvements in the technology and standards being used for sewage treatment. An initiative called the Northland Sewage Accord has also been established with the goal of achieving an acceptable level of water quality in Northland's streams, rivers, and beaches by improving sewage management. While the initiative was only confirmed in June 2008, it has already improved staff communication and understanding between local authorities around sewage management issues in Northland.
Water
Northland's climate means that drought conditions are experienced on average, once every three years at east coast and inland locations and once every four years at west coast and high altitude locations (Northland Regional Council: 2002). Northland's aging water supply network infrastructure sometimes can exacerbate these drought and drought-like conditions.
In the Far North district, around 28% of water was lost to leakage in 2007/08 (Far North District Council: 2011) and in Whāngārei district, 27.6% of water was lost in 2009/10. There is a need for more water storage in the region to ensure greater resilience in ‘dry' years.
Going forward, effectively funding the maintenance of existing and the development of new water, stormwater, and wastewater infrastructure to service growth, fix known issues, and accommodate climate variability, will be crucial.
Transport infrastructure
What do we want for transport infrastructure in Northland?
The operative Regional Policy Statement for Northland details council and community objectives for each natural and physical resource in our region. The objectives relating to transport are:
• Maintain and enhance the safety and efficiency of the region's transport network, while minimising adverse environmental effects.
The following are the anticipated environmental results after implementing the transport policies in the policy statement:
• Safe and efficient use of the transport network.
• Reduction in noise and other adverse environmental effects associated with the transport network.
The ability to provide a reliable, cost effective, well maintained and fit for purpose transport network is a challenge every region in the country faces. For Northland, the focus is on reducing the cost to do business – particularly focussing on the priority of getting goods and products to markets, both domestic and international, alongside providing a safe and reliable network for tourists and residents.
Coupled with this is the desire to see improvements:
• In access to public transport, including developing alternative modes;
• Reducing the effects on public health by ensuring alternatives that promote physical activity are supported (such as walking and cycling);
• Road safety;
• Air quality (including reducing dust from gravel roads);
• Noise levels; and
• Access to health services and other community facilities.
These improvements must all sit alongside environmental sustainability, when any transport network improvements are carried out.
Road network
A key feature of Northland's road network is the ratio of road length kilometres per square kilometre of land area and the ratio of road length per head of population, which is higher than the national average.
This is partly due to the region's challenging topography, which has numerous inlets, harbours, peninsulas and winding hill sections. It also emphasises the relatively high burden of road maintenance on the Northland population and particularly for a sparsely populated district like Kaipara.
Figure 31: Seasonality of traffic flows in Northland
Northland has a large road network for a relatively small population, which means we spent a large proportion of our rates budget on roads. Northland's road network density (metre/head of population) is 42.01m/p compared with the national average of 21.53m/p. Similarly, Northland has 0.47km of road per square kilometre of land area, compared to the national average of 0.34km/km2.
The percentage of unsealed roads in Northland is quite high. Sealed road length is 47.2% of the total (2010/11) compared with 66% for the rest of New Zealand. There has been a very small increase in the sealed network over time but it is not currently a high priority activity. Northland's state highway network is however now entirely sealed following the sealing of the final stretch of State Highway 1 in 2011 (Waitiki Landing – Cape Rēinga).
Unsealed roads can have health, safety and environmental implications, particularly relating to dust and particulate matter that is thrown up by vehicles. This is the most common impact arising from road activities and can be caused by vehicles (including heavy trucks) using unsealed roads and general road maintenance activities. The environmental effects of incidents concerning dust nuisance have tended to be rated as minor. However, dust from unsealed roads can contain high concentrations of fine (<10µm in diameter) particles that have the potential to cause health effects. This is something that will need to be kept under close watch particularly as there has been a steady rise in the number of logging trucks on the road network in Northland. Northland also experiences a significant influx of seasonal visitors which results in many hired vehicles and drivers unfamiliar with our roads. The seasonal visitor influx coincides with seasonal peak in heavy traffic flows. These factors have significant implications for safety as well as increased demands on local services and infrastructure.
Road safety
Figure 32: Fatalities from road accidents in Northland
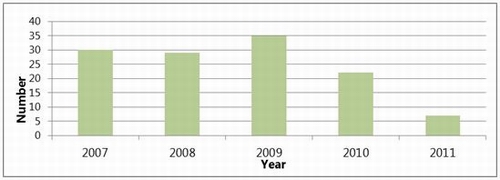
Road safety continues to be a priority for Northland. Northland has seen a lowering of the road death toll from 22 in 2010 to seven in 2011. Whether this represents a long-term consistent trend is unknown at this stage, however, historically the number of fatalities has been trending downwards (Figure 32).
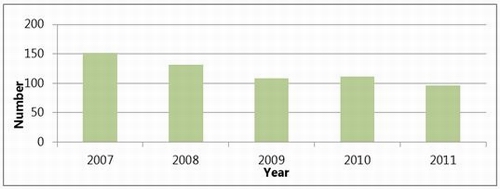
Accidents resulting in serious injury have also dropped significantly in the region (serious injury is defined as an injury resulting in fractures, concussion, severe cuts or other injury that requires hospitalisation). The number of such accidents has fallen from 152 in 2007 to 96 in 2011 (Figure 33).
Improvements can be attributed to increased enforcement, improved driver awareness and road engineering improvements.
Figure 33: Total road accidents resulting in serious injuries
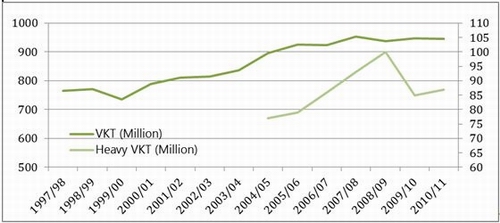
The most recent comprehensive report on heavy traffic volumes in Northland was completed in 2007 to identify trends and routes for heavy traffic. Refer to Figure 34 for a summary of the heavy traffic volumes within Northland, shown as total trips per day. The NZ Transport Agency also regularly collects data about traffic and heavy traffic volumes on the state highway network within Northland.
Figure 34: Traffic volumes on state highway (Source: NZTA)
Public transport and total mobility
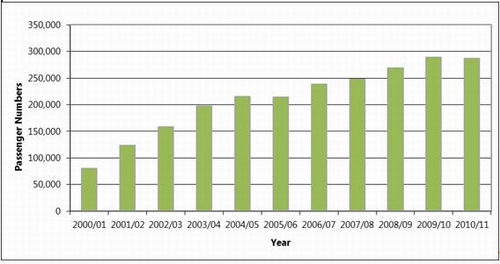
Public transport patronage in Whāngārei continues to grow. Passenger numbers have more than trebled from 80,000 carried during the service's first year in 2000/2001 to 290,000 passengers in 2010/2011 (financial year – June to July) (Figure 35).
Factors influencing this growth include rising motoring costs, the quality of facilities and buses, positive user feedback and effective marketing. The possibility of other subsidised services in the region is under investigation and may be developed where they are economically viable.
Figure 35: CityLink Whāngārei passengers carried per year data
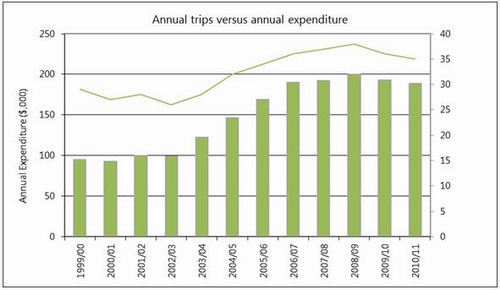
The total mobility scheme is a nationwide scheme designed to increase the mobility of people with disabilities. Assistance is provided in the form of a 50% discount on taxi fares. In Northland, this service is only offered in the Whāngārei urban area to those aged 14 and over who meet the eligibility criteria. The scheme is administered by the regional council and funded by the Whāngārei District Council (60%) and the NZ Transport Agency (40%). The funding allocation for the scheme is provided at a capped amount each year. Although usage has remained stable, costs for the scheme have risen from $3.20 per trip in 1999/00 to $5.39 in 2010/11 (Figure 35), which can be directly attributed to increases in vehicle operating costs and compliance costs.
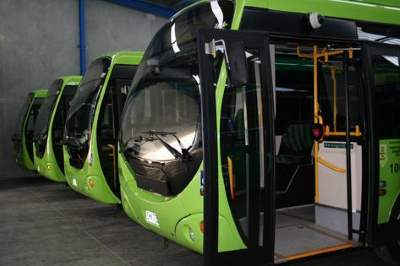 Whāngārei's CityLink buses.
Figure 35: Total mobility trip and cost data
Rail network
The rail network handles only a small volume of Northland's freight (approximately 350,000 tonnes or 2-3% of the total volume of freight moved). The potential of Northland's rail network is limited by both weight and speed restrictions as well as the size of existing tunnels, some of which are too small for the new larger containers being introduced. This situation is the result of a historical lack of investment in the North Auckland line.
Seaports and coastal shipping
Northland currently has significant port facilities at Marsden Point along with significant industrial and commercial land surrounding the port. In 2011, Marsden Point was responsible for handling 31% of the total volume of merchandise imports into New Zealand sea ports and 8% of exports. While the share of imports has remained relatively static, being predominantly of crude oil for the refinery, the port's share of exports has doubled since 2006. Coastal shipping accounts for approximately 20% of the freight moved in the region.
The facility at Marsden Point has excellent potential to not only increase its volume of bulk cargo but to also become a commercial container port. It is the deepest natural harbour in Australasia and has plenty of land available for holding cargo/containers. However, significant development of further facilities would be required including access to the port area for rail freight and land-based loading facilities (cranes) for containers.
While Marsden Point is recognised as the primary coastal shipping hub in Northland, there are several other coastal shipping operations around the north. The number and size of cruise ships visiting the Bay of Islands has increased dramatically over recent years. During the 2011/12 season, 52 ships carrying almost 79,000 passengers arrived. This compares with just 19 ships and 12,000 passengers in 2006/07. A challenge for this operation is that cruise ships cannot dock but must anchor in the bay, with the tendering distance from the ship to land being the longest in the southern hemisphere.
The Bay of Islands and Whāngārei are both ports of entry for international yachts. Northland is a very popular destination for recreational boating and the region has a number of marina facilities as well as a significant marine manufacturing, service and repair industry.
Whāngārei and Portland are identified as large-scale wharf and jetty facilities, and Northland has a number of smaller commercial wharves within its harbours. Specialised bulk cement carriers operate out of Portland servicing the Golden Bay Cement operation.
Airports
Northland has three airports where commercial operators offer domestic flight services, located at Whāngārei, Kerikeri (Bay of Islands Airport) and Kaitāia. There are also airports operating at Kaikohe and Dargaville, but these do not currently involve commercial domestic flights. The Kaipara district is currently the only district in Northland not operating commercial domestic flights.
There is no scheduled international airport in Northland, although the Bay of Islands and Kaitāia airports have the facilities to clear passengers through customs for private international flights. All three airports currently have the ability to accommodate 50-seat aircraft such as Air New Zealand's Bombardier Q300.
Whāngārei's airport, located at Onerahi, is used both privately and for domestic commercial flights. It is unlikely that the airport can be extended due to physical constraints and a new location for the airport is not considered feasible. Therefore the approach is to concentrate on increased frequency of flight times and choice of destinations per day.
The Bay of Islands airport has plans for improvements to the airport facilities, including runway strengthening, improvements to taxiways, the apron and airport lighting.
The long-term strategic intention is that Northland has an airport in the Bay of Islands / Far North area that is developed into an international airport with a strong road transport link within the Bay of Islands.
Energy infrastructure
What do we want for energy infrastructure in Northland?
The operative Regional Policy Statement for Northland contains the following objectives relating to energy infrastructure:
• Recognition of the energy production potential of Northland's natural resources.
• Prohibition of the use of nuclear energy sources for energy production purposes.
• Promotion of the efficient and environmentally acceptable use of energy.
The following are the anticipated environmental results after implementing the energy policies in the policy statement:
• Increased use of environmentally acceptable, sustainable energy resources.
• Enhanced extent to which the adverse effects on the environment of Northland of energy generation, distribution and use are avoided, remedied or mitigated.
What does our energy infrastructure look like?
Very little electricity is produced in Northland. The only generation schemes of significance are the Wairua hydro schemes, which produce 11megawatts (MW) output per year, and the Ngāwhā geothermal power station near Kaikohe, which has recently increased its output from 10MW to 25MW. These schemes combined produce approximately three percent of the peak load for Northland.
There is significant potential for the development of further renewable electricity sources, for example, biofuels, wind, wave and solar generation (Energy Efficiency and Conservation Authority and Sinclair Knight Merz: 2006) and there are current proposals for wind generation (Poutō) and a consented scheme for tidal generation (Kaipara Harbour) within the region.
In contrast to the low level of electricity produced, Northland is responsible for 40% of New Zealand's energy production. This is largely attributed to the presence of Marsden Point Oil Refinery, New Zealand's sole oil refinery. This facility and the oil pipeline running south to Auckland are nationally important infrastructure assets. Over the longer term, this pipeline will need to be upgraded to cope with increased demand in Auckland and the upper North Island.
Northland is linked to the reticulated natural gas network from the Taranaki gas fields via Auckland, which supplies key industries in Northland.
Waste management infrastructure
What do we want for waste management infrastructure in Northland?
The operative Regional Policy Statement for Northland contains the following objectives relating to waste management:
• A reduction in the amount of waste produced and associated disposal needs.
• Efficient and environmentally sound collection, treatment and disposal of waste.
The following are the anticipated environmental results after implementing the waste management policies in the policy statement:
• A reduction in the volume of waste requiring disposal.
• A reduction in the frequency and magnitude of unauthorised disposal of waste.
• A reduction in the effects of the authorised waste disposal activities on the environment.
What does our waste infrastructure look like?
A new regional landfill site at Puwera, 10km south of Whāngārei was completed in 2010/11. This has a 35-year capacity of 4 million cubic metres – with the possibility of extending this by a further 10 years. This facility relieves the growing need to transport waste to Auckland for most of Northland (Whāngārei District Council: 2001). Approximately 5000 tonnes of solid waste is disposed of each month at the Puwera landfill.
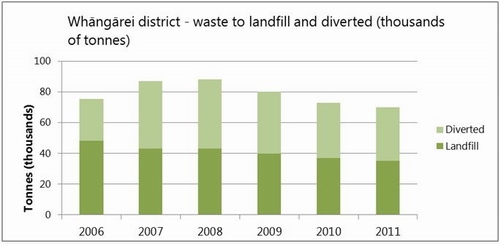
Each year, around 70,000 tonnes of waste is generated in the Whāngārei district. In 2011, approximately half of this waste, some 35,000 tonnes, was disposed of in landfills. This is a decrease of more than 25% from around 48,000 tonnes disposed in 2006.
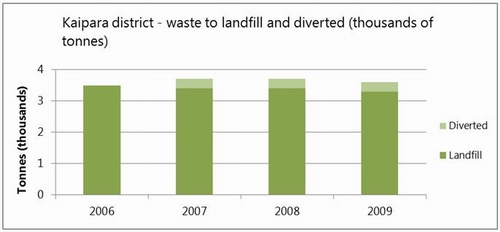
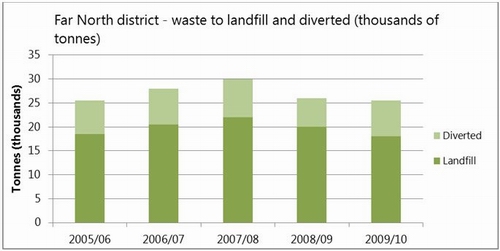
Far North district sent 18,360 tonnes of waste to landfill in 2009/10, down from 18,500 tonnes in 2005/06. The Kaipara district sent approximately 3550 tonnes of waste to landfill in 2006 and 3332 tonnes in 2011.
Initiatives, such as charging for waste disposal, have assisted in reducing the volume of waste created. Another significant factor has been the economic down-turn and reduction in resources consumed. A short-term increase in backyard burning of green waste was experienced in the Whāngārei urban area, which was partially attributed to the increased charges for green waste disposal being experienced at the same time. Changes to the Regional Air Quality Plan and monitoring and education by the council have been undertaken to attempt to address this issue. Benefits have been seen from involvement in education programmes such as Enviroschools and the Clean Streams Accord.
The kerbside collection of recyclable materials is working well in the Whāngārei and Far North districts. In Whāngārei, the amount of diverted waste from landfills has increased to the extent that equal amounts of waste are diverted away from landfills as are sent there (35,000 tonnes each in 2011). In Far North, rates of diversion have varied from 23% to 28% over the last five years.
Figure 36: Waste sent to landfill and diverted in Northland (as collected by district councils)
What is being done?
On-going monitoring
Monitoring of infrastructure in the region is conducted by a number of private and public infrastructure providers and statutory bodies. Public infrastructure is monitored through:
• Regional Land Transport Strategy (full report – 2013), Regional Land Transport Programme.
• District council asset management plans and state of environment reports.
• Regional council state of environment reporting (2007 report – transport and waste management only. From 2013 transport, waste management and other infrastructure).
Policy development
Northland Regional Council is developing a new Regional Policy Statement because the current one has been operative since 1999. The new policy statement must have regard to Section 30 (gb) of the Resource Management Act – to achieve the strategic integration of infrastructure with land use. This will require a new and more direct approach to managing infrastructure in the region.
In developing the policy statement, the regional council must also implement the National Policy Statement on Electricity Transmission and the National Policy Statement on Renewable Electricity Generation. These statements require specific objectives, policies and methods enabling the development and management of the electricity grid and renewable electricity generation.
Other projects/partnerships/funding initiatives
Aside from the above, the regional council is involved in a number of other initiatives:
• Regional Energy Strategy – the regional council has worked with industry to develop a Regional Energy Strategy to coordinate and promote energy generation projects.
• Transport decision-making bodies – the Regional Transport Committee, managed by the regional council, which is responsible for the preparation of the Regional Land Transport Strategy and Regional Land Transport Programme along with other key transport-related strategies and plans.
• Transport working groups – the regional council is involved in a number of working groups to promote initiatives including the Road Safety Forum, Stock Effluent Disposal Group, and Northland Transport Executive Group (NORTEG).
• The Upper North Island Strategic Alliance was formed in October 2011 to collaborate for responding to and managing a range of inter-regional and inter-metropolitan issues between local authorities in the upper North Island. A work programme was developed for 2012 with the focus including transport (including rail, roads and freight), and ports (including inland ports). The ‘Upper North Island Freight Story' is a collaborative piece of work between the alliance, KiwiRail, and the NZ Transport Authority. The focus is on ‘Reducing the cost to do business in New Zealand – through an upper North Island lens'.
How are we measuring up against our objectives?
The following are the environmental results anticipated, listed in the Regional Policy Statement for transport:
Safe and efficient use of the transport network
• The number of fatalities from road accidents reduced substantially in 2011 from previous years (overall there has been a long-term declining trend). The total number of serious injuries has reduced significantly since 2007.
• Continued promotion of road safety initiatives such as ‘Share the Road' and ‘Coffee Brake'. The Coffee Brake road safety initiative has been a success with the number of outlets involved in the scheme growing to 23 as of 2011/2012.
• There has been a steady increase in the use of the Whāngārei bus service since it was introduced in 2000. Promotion of the development of the bus service is supported through implementation of the Regional Public Transport Plan.
• Land was designated for a future rail corridor between Oakleigh and Marsden Port in 2008.
Reduction in noise and other adverse environmental effects associated with the transport network
• New stock effluent facilities have opened at Pakaraka in the Far North and Dargaville in the Kaipara. This has reduced the risk of contamination entering water bodies.
• On-going trials of dust suppression products to minimise road dust.
The following are the environmental results anticipated, listed in the Regional Policy Statement for energy:
Increased use of environmentally acceptable, sustainable energy resources
• There has been a small increase in renewable electricity generation in Northland. The increase of generation primarily arose from the upgrade of Ngāwhā Geothermal Power Station from 10 to 25MW.
• Since 2007, the only approved (subject to conditions) consent application for renewable electricity generation in the region is for Crest Energy – tidal generation within the Kaipara Harbour. The consent is contingent on an adaptive management approach involving a full monitoring plan, developed in consultation with stakeholders.
• The council is aware of other proposals for renewable electricity development in the pipeline at various stages. Regional and district planning documents will need to give effect to the National Policy Statement on Renewable Electricity Generation and the National Policy Statement on Electricity Transmission.
Enhanced extent to which the adverse effects on the environment of Northland of energy generation, distribution and use are avoided, remedied or mitigated
• New transmission lines have been constructed along with activities associated with routine operation, maintenance and upgrading. The potential adverse effects of these activities have been controlled through consent conditions.
• There are 26 active resource consents for activities concerning electricity transmission. Most of these are for occupying space in the coastal marine area. There have been no breaches recorded for these consented activities.
The following are the environmental results anticipated, listed in the Regional Policy Statement for waste management:
A reduction in the volume of waste requiring disposal
• There has been an overall decrease in the amount of waste sent to landfill in the region and an overall increase in waste diversion from landfills.
• Waste diversion programmes run by district councils have led to increased awareness of alternative waste disposal methods.
A reduction in the frequency and magnitude of unauthorised disposal of waste
• Incidents of illegal dumping of rubbish (including confirmed dead stock and offal dumping instances) have varied considerably from year to year with no overall trend downwards.
A reduction in the effects of the authorised waste disposal activities on the environment
• The number of consent breaches for landfills has trended upwards in recent years. The breaches tend to be administrative and minor operational issues.
References
Statistics NZ. Quick stats about Northland.
European Union. Visby Agenda: creating impact for an eUnion 2015. A Green Knowledge Society. 2009. Retrieved from: www.se2009.eu/visbyagenda
Northland Regional Council. State of the Environment Report 2002.
Far North District Council. Annual Plan 2010/2011.
Energy Efficiency and Conservation Authority and Sinclair Knight Merz (2006). Northland Renewable Energy Assessment.
Whāngārei District Council (September, 2001). Resource consent – Puwera Landfill.