Economy
Northland's economic base
What is our economy like?
The Northland economy, when measured in terms of Gross Domestic Product (GDP), was valued at just under $4.8 billion in 2011, equivalent to 2.3% of New Zealand's GDP (Table 2 and Figure 10).2
The 2007 flood event and the recession brought on by the global financial crisis saw Northland's GDP growth rate fall from 4.4% in 2006 to -0.8% in 2008. It took Northland longer to move out of negative growth during 2010 compared to the national economy. One reason for this was the 2009/10 summer drought experienced in Northland, which affected agricultural productivity.
Over the five years 2007-2011, the Northland economy grew at an annual rate of just 0.5%. This is significantly lower than the annual growth rate of 3.5% achieved during 2002-2006. It is also lower than the growth rate for New Zealand as a whole, and was the twelfth fastest annual rate among the 16 regions for the period 2007-2011. Only Manawatu/Wanganui, Canterbury, Gisborne and Hawke's Bay grew slower than Northland during the last five years.
In comparison to the two other regions of similar economic size and location, the Northland economy grew faster than Southland during the 10 years 2002-2011 but slower than the combined Tasman/Nelson/Marlborough region.
Figure 10: Northland GDP, 2002-11
Source: Infometrics Regional Database
In 2011, Northland's GDP per capita was about $30,000, equivalent to 65% of the national average GDP per capita (Table 2 and Figure 11). Northland has the second to lowest GDP per capita among the 16 regions, about 8% higher than the average for Tasman. After growing by 2.3% per annum during 2002-2006, Northland's GDP per capita has since fallen slightly.
However, the national GDP per capita average has followed a similar pattern of growth. Consequently, the gap between it and Northland has remained relatively constant and is closer than 10 years ago.
Moreover, three regions experienced a faster rate of negative growth in GDP per capita than Northland during 2007-2011; Hawke's Bay, Otago and Canterbury.
At current population levels, it would take a one-off $2.5 billion (55%) increase in Northland's GDP in order for the region's GDP per capita to equal the New Zealand average.
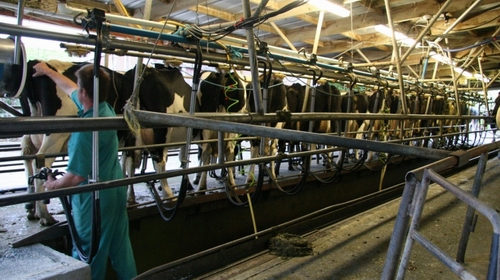
Figure 11: Northland GDP per capita, 2002-11
Source: Infometrics Regional Database
Almost 60% of Northland's GDP is produced in the Whāngārei district (Table 3). The Far North and Kaipara districts are much smaller, accounting for 32% and 10% of Northland's GDP respectively. There is also a large variation in GDP per capita between the three districts. Whāngārei's GDP per capita is $34,500 (15% above the Northland average) while it is $25,000 in Kaipara and $25,600 in the Far North (17% and 15% below the Northland average respectively).
Economic activity in Whāngārei district was the main contributor to economic growth in Northland during 2007-2011 (Table 3 and Figure 12).
While all three territories experienced much lower growth rates in 2007-2011, economic activity in Whāngārei still grew by 1.1% per annum over the five years, whereas it shrank in both the Far North and Kaipara.
This contrasts markedly with the 2002-2006 period in which all three territories grew at a very similar pace of between 3.2 to 4.1% each year. The recession is therefore likely to have had a larger impact on communities located in the north and west of the region than those in the centre.
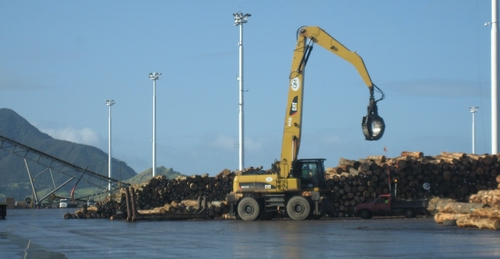
Figure 12: Contribution of districts to Northland economic growth, 2002-2011
Source: Infometrics Regional Database
Table 2: Selected economic indicators for Northland
Year ended December 20111 |
Annual growth rate2 |
|||
| Economic Indicator | Region | 5 years 2007-11 | 5 years 2002-06 | |
GDP ($ million, current) |
Northland | $4,757 | 0.5% | 3.5% |
| New Zealand | $204,823 | 1.1% | 3.7% | |
| Position among 16 regions3 | 10th | 12th | 8th | |
GDP per capita ($, current) |
Northland | $30,072 | -0.2% | 2.3% |
| New Zealand | $46,496 | 0.0% | 2.1% | |
| Position among 16 regions3 | 15th | 13th | 7th | |
Employment (persons)4 |
Northland | 63,131 | -0.3% | 2.9% |
| New Zealand | 2,154,478 | 0.5% | 2.9% | |
| Position among 16 regions3 | 9th | 14th | 6th | |
Unemployment rate (%)4 |
Northland | 8.5 | 10.3% | -8.7% |
| New Zealand | 6.5 | 11.3% | -6.8% | |
| Position among 12 regions5 | 12th | 7th | 5th | |
GDP per person employed ($, current) |
Northland | $75,357 | 0.8% | 0.6% |
| New Zealand | $95,069 | 0.6% | 0.8% | |
| Position among 16 regions3 | 13th | 8th | 8th | |
Business units (number) |
Northland | 20,224 | -0.2% | 3.1% |
| New Zealand | 508,300 | 0.6% | 3.9% | |
| Position among 16 regions3 | 8th | 15th | 10th | |
Median weekly household income $6 |
Northland | $1,044 | -1.2% | 5.8% |
| New Zealand | $1,289 | -0.1% | 2.3% | |
| Position among 12 regions5 | 12th | 10th | 1st | |
Low-income households (% households)7 |
Northland | 37% | 2.2% | -4.9% |
| New Zealand | 27% | -0.7% | -1.2% | |
| Position among 12 regions5 | 12th | 11th | 1st | |
Low-income depth (50:60 ratio %)8 |
Northland | 78% | -1.1% | 2.9% |
| New Zealand | 76% | -0.5% | 2.0% | |
| Position among 12 regions5 | 10th | 4th | 11th | |
Home affordability index9 |
Northland | 19.9 | -7.8% | 20.5% |
| New Zealand | 22.3 | -6.3% | 12.8% | |
| Position among 12 regions10 | 6th | 5th | 10th | |
Consumer confidence index11 |
Northland | 96 | -4.0% | 1.1% |
| New Zealand | 101 | -3.0% | 0.0% | |
| Position among 11 regions12 | 8th | 8th | 1st | |
- Except Population (June), Business units (February), Tress index (March), and Median weekly household income, low income households and poverty depth (June).
- Growth for money related indicators is calculated on a real (inflation adjusted) basis.
- The 16 regions are Northland, Auckland, Waikato, Bay of Plenty, Gisborne, Hawke's Bay, Taranaki, Manawatu-Wanganui, Wellington, Tasman, Nelson, Marlborough, West Coast, Canterbury, Otago and Southland.
- Annual average of the four quarters ended December.
- The 12 regions are Northland, Auckland, Waikato, Bay of Plenty, Gisborne/Hawke's Bay, Taranaki, Manawatu-Wanganui, Wellington, Tasman/Nelson/Marlborough/West Coast, Canterbury, Otago and Southland.
- Includes wages and salaries, self-employment, investment income, government transfers, and other transfers, before tax. Growth measured for the four year period 2002-06 because the definition of income changed in 2002. Median income for households with at least one person aged 15-64.
- Measured by the proportion of all households with household income below a constant value threshold equivalent to 60% of the 2002 national median household income adjusted each year with the Consumers Price Index (CPI). A negative change indicates an improvement, i.e. a reduction in low income households.
- The 50:60 ratio % is the number of households with income below 50% of the national median household income as a proportion of the number of households with income below 60% of the national median. The lower the proportion the less depth there is, and a negative change indicates an improvement.
- The lower the index the more affordable the housing. Northland was sixth lowest in December 2011. Similarly, the larger the decrease the better. Northland had the fifth largest decrease in the index during 2007-11.
- The 12 regions are Northland, Auckland, Waikato/BOP, Hawke's Bay, Taranaki, Manawatu-Wanganui, Wellington, Nelson/Marlborough, Canterbury/Westland, Otago, Central Otago Lakes and Southland.
- Summarises responses to questions about households' own financial position, their expectations for the NZ economy as a whole and their current willingness to spend. A value over 100 indicates positive confidence.
- The 11 regions are Northland, Auckland, Waikato, Bay of Plenty, Gisborne/Hawke's Bay, Taranaki/ Manawatu-Wanganui, Wellington, Tasman/Nelson/Marlborough/West Coast, Canterbury, Otago and Southland.
Sources: GDP, Employment and Tress index: Infometrics Regional Database; Population, Unemployment rate, Business units and Median weekly household income: Statistics New Zealand; Economic activity index: National Bank; Home affordability index: Massey University; and Consumer confidence index: Westpac McDermott Miller.
Table 3: Contribution of districts and industries to economic growth in Northland, 2002-2011
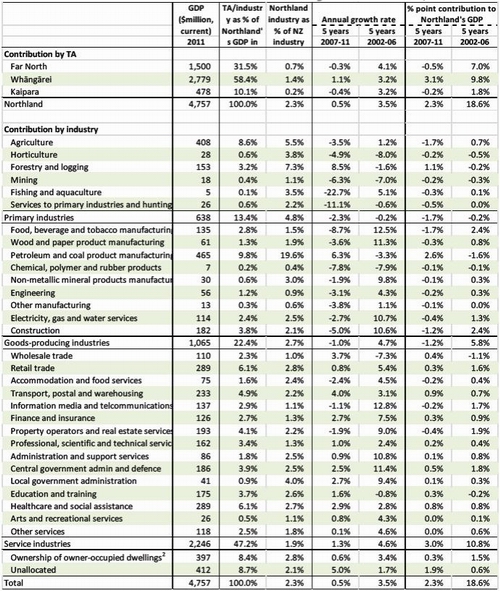
- Measured by the percentage point change in Northland's total GDP between the two years. For example, in the five years 2007-11, growth in the forestry and logging industry contributed to a 1.1% increase in Northland's GDP, which in total increased by 2.3%.
- Represents the service that dwellings provide to their owner-occupiers.
Source: Infometrics Regional Database
Northland's major industries
What industries have contributed to economic growth?
The structure of the Northland economy is different to that of the national economy (Table 3). Primary industries – agriculture, horticulture, fishing, forestry and logging, and mining – account for 13% of Northland's GDP compared to only 6.5% nationally. Alternatively, service industries account for just 47% of Northland's GDP but contribute 58% nationally.
At the broad sector level, growth in the Northland economy during 2007-2011 was mainly due to the expansion of activity in the service industries. Economic activity in both the primary industries and goods-producing industries sectors declined. The service industries sector was also responsible for most of the growth during 2002-2006, although the goods-producing sector also performed strongly. However, these broad groupings hide important industry developments within each sector.
Within the primary industries sector, the contribution of agriculture, horticulture, fishing and mining to GDP fell during 2007-2011. By comparison, economic activity in forestry and logging grew by almost 8.5% per annum, contributing to a 1.1 percentage point rise in Northland's GDP.
Between the season ended May 2007 and May 2010, the volume of milksolids produced in Northland fell by nearly 10% from 77,400 to 70,100 tonnes (Figure 13). While production rebounded in 2011, it remains below levels achieved in the early 2000s. Northland supplied just 5% of New Zealand milksolids production in 2011 compared to 7% in 2002. Similarly, the number of beef cattle in Northland, which had been rising during the 2000s, has fallen by 20% from a high of 500,000 animals in 2008 to 400,000 in June 2011. Extreme weather conditions, such as floods and droughts, have contributed to this decrease in agricultural production.
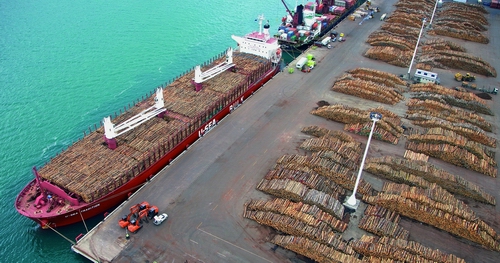
Output from the forestry sector has however been steadily rising. In 2011, over 2.5 million cubic metres of exotic timber was harvested in Northland. This is equivalent to almost 11% of the national harvest and around double the annual quantity harvested in 2006.
The two goods-producing industries that have contributed most to growth over the past ten years are the wood processing and petroleum products industries (Table 3). In line with the increase in the quantity of wood harvested, there has been an increase in the quantity of wood processed. For example, the quantity of sawn timber produced in the Northland wood supply region has risen from an annual average of 228,000m3 in 2002-2006 to 327,000m3 in 2007-2011 (Figure 14).
The refinery at Marsden Point makes a valuable contribution to the Northland economy. It is directly responsible for almost 10% of Northland's GDP, without including the wider economic impacts from the industries servicing the refinery and the spending of wages and salaries earned at the refinery.
One of the main goods-producing industries that has shrunk over the past five years is construction, due to a large drop in building activity. The total floor area of new dwelling consents in Northland was just over 100,000m2 in 2011, down from over 250,000m2 consented on an annual basis in the mid-2000s.
A major change among the service industries has been the contribution of property services to growth. After contributing a 1.9 percentage point increase in GDP during 2002-2006 due to a large increase in the number and value of real estate sales, property services contracted in 2007-2011. The number of dwelling sales in Northland has fallen from a peak of almost 3500 per year in 2004-2005 to just 1333 in 2011, the lowest level in a decade (Figure 15).
The recession has also resulted in a 6% fall in the number of guest nights in Northland from its peak in 2007. However, annual averages for the two five-year periods are almost identical at 1.66 million guest nights and the drop in visitors to Northland mirrors other regions in New Zealand.
Figure 13: Indicators for selected primary industries in Northland, 2002-2011
- For timber harvested, 2002 and 2003 are year ended December. Statistics New Zealand then changed the year to match the Ministry of Agriculture and Forestry's exotic forest description series.
Sources: Dairy NZ/LIC, Dairy Statistics; Statistics New Zealand, Agriculture Statistics; Statistics New Zealand, Forestry Statistics.
Figure 14: Indicators for selected goods-producing industries in Northland, 2002-2011
- For rough sawn timber, Northland includes Rodney district.
- Refinery output as a percentage of New Zealand oil and gas consumption measured on a gross petajoules basis.
Sources: Ministry of Primary Industries; Ministry of Economic Development; Statistics New Zealand.
Figure 15: Indicators for selected service industries in Northland, 2002-2011
Sources: Statistics New Zealand, Accommodation Survey; Real Estate Institute of New Zealand, Market Facts Graphs.
What has happened to the number of businesses?
In February 2011, there were just over 20,200 geographic units located in Northland. (Note: a geographic unit is defined as a separate operating unit engaged in New Zealand in one (or predominately one) kind of economic activity from a single physical location or base. This is the preferred measure for counting the number of businesses in a particular area. The coverage of business demography statistics is limited to economically significant enterprises that are engaged in the production of goods and services in New Zealand. In particular it does not include self-employed operators with annual expenses or sales of less than $30,000 per annum.) This is 200 less than in 2006, a reduction of 1%. By comparison, the number of businesses in New Zealand grew by 3.1% over the five years. Only the Manawatu-Wanganui region had a larger percentage reduction in the number of businesses than Northland. The decrease represents a turnaround from 2002-2006 when the number of businesses in Northland rose by 17% as the economy expanded.
There has also been a steady fall in the number of business start-ups (Figure 16). During the mid-2000s, some 2500 new businesses were started each year in Northland. In 2011, only 60% of that number of businesses began operation.
In 2010 and 2011 the business birth to death ratio fell below one for the first time in 10 years, indicating that the number of businesses that ceased operation was greater than the number of new businesses that started. This indicator of entrepreneurial activity peaked in 2004 and has been steadily tracking down since. In general, the ratio of business births to deaths in Northland is less than in New Zealand as a whole. This suggests Northland has a relatively lower level of entrepreneurial activity than New Zealand in general.
Figure 16: Business growth in Northland, 2002-2011
Source: Statistics New Zealand, Business Demographics Statistics
- A ratio of greater than one means that the number of new businesses (births) is larger than the number that closed (deaths).
- A ratio of less than one means that the ratio of births to deaths in Northland is lower than the national ratio.
Employment in Northland
What has happened to employment?
The number of people employed in Northland, both self-employed and employees, has fallen over the five years 2007-2011. Just over 1000 fewer persons were employed in 2011 as compared to 2006, with annual growth rates varying between 2% and -3% (Table 2 and Figure 17). This contrasts markedly with the preceding five years. During 2002-2006 there was a steady rise in employment of almost 3% per annum, with a total of 8,500 additional persons working.
Employment growth in Northland during 2007-2011 has also been much slower than in the national economy as a whole. This is shown by the fall in Northland's share of national employment from 3% in 2002 to 2.9% in 2011. In particular, the drop in employment in 2009 was larger and the recovery in 2010 and 2011 was much slower in Northland. Of the 16 regions, only Gisborne and Manawatu/Wanganui experienced slower employment growth than Northland during 2007-2011. The greatest reduction in employment since 2008, both in absolute and percentage terms has occurred in the construction and primary production (agriculture, forestry and fishing) industries.
Figure 17: Employment in Northland, 2002-2011
Source: Infometrics Regional Database
A consequence of negative employment growth has been a rise in the unemployment rate (Table 2 and Figure 18), which has more than doubled from its historical low of 4.3% in 2007 to around 9% in 2009 and 2010, before falling to 8.5% in 2011.
Northland's unemployment rate has returned to levels that existed in the early 2000s and is the highest among the 12 regions for which unemployment rates are calculated. The unemployment rate in Northland has always been above the national level. However, the gap between the Northland and national unemployment rate is less than during the early 1990s, with the gap in 2011 the third lowest over the past 10 years.
This suggests that unemployment is more widely spread throughout New Zealand than in the early 2000s, and is not just a Northland problem.
The large number of people unemployed in Northland, especially those aged 18-24 years whose number on the unemployment benefit has risen by more than 300%, is of great concern. Slow employment growth is also seen by a fall in the labour force participation rate from 66% in 2006 to 63% in 2011. This indicates that a larger proportion of the working age population in Northland is choosing not to participate in the labour force because of fewer job opportunities.
A simple measure of labour productivity is to divide GDP by the number of persons employed. Northland's GDP per person employed was just over $75,000 in 2011, around 80% of the national average and placing Northland at thirteenth among the 16 regions (Table 2 and Figure 19). The significantly higher level of GDP per person employed as compared to GDP per capita in Northland is a consequence of two factors: the relatively high proportion of the population outside the working-age (15-64 years); and the relatively low participation rate of the working-age population. With employment growing at a slower rate than GDP over 2007-2011, this productivity measure has increased by 0.8% per annum over the period. This was higher than the rate of increase for New Zealand as a whole and was the eighth fastest increase among the 16 regions.
Figure 18: Unemployment rate in Northland, 2002-2011
Source: Statistics New Zealand, Household Labour Force Survey
Figure 19: Northland GDP per worker, 2002-2011
Source: Infometrics Regional Database
Households in Northland
How have households faired?
The median weekly income for households in Northland was $1,044 in June 2011 (Table 2 and Figure 20). This is equivalent to 81% of the national median household weekly income and is the lowest among the 12 regions for which data is available.
Figure 20: Real household income in Northland, 2002-2011
- Median household income adjusted for inflation using the Consumers Price Index (CPI).
- Household income includes wages and salaries, self-employment, investment income, government transfers and other transfers, before tax.
Source: Statistics New Zealand, New Zealand Income Survey
Over the period 2007-2011, the median weekly household income in Northland fell by 11% from its high of $1,177 in 2007 when measured in real terms (adjusted by the CPI). Only two regions, Waikato and Gisborne/Hawkes Bay, had larger decreases. This indicates that Northland households have considerably less purchasing power in 2011 compared to 2007, having around the same level as they had in 2005.
This contrasts markedly with developments during 2002-2006. In this period, the median household income in Northland increased by almost 6% per annum, the highest rate of increase among the 12 regions and considerably faster than the 2.3% per annum rise in the national median. Consequently, the Northland median household income rose from 75% to 87% of the national median.
One reason for this rapid rise was the strong employment growth in the region which saw a switch in income from government transfers, such as unemployment benefits, to wages and salaries. Similarly, the decrease in median household income during 2007-2011 reflects the growing number of households that are dependent on benefits or outside the paid workforce altogether, as well as lower investment returns. The progressive introduction of the central government's Working for Families package from 2004-2007 may also have contributed to the rise in median income levels.
During 2007-2011, the proportion of low-income households in Northland rose from 30% to 37% of all households, an annual increase of 2.2% (Table 2 and Figure 21). Households are considered to be low-income if their income is below a constant value threshold equivalent to 60% of the 2002 national median household income adjusted each year with the Consumers Price Index (CPI) (Perry: 2011.) In the short to medium term using a constant value threshold is considered the best measure as it reveals whether the incomes of low-income households are rising or falling in real terms.
Northland has the highest proportion of low-income households according to this measure, being 1.37 times higher than the national proportion in 2011. Other regions with a high proportion of low-income households are Gisborne/Hawkes Bay and Manawatu/Wanganui, at 1.28 and 1.23 times the national proportion respectively.
The recent rise in low-income households reverses the downward trend observed during 2002-2006. During this former five-year period, Northland experienced the greatest reduction in the proportion of low-income households among the 12 regions for which data is available, with the proportion of low-income households in Northland falling from 1.4 times to just 1.15 times the national proportion.
Although Northland has a greater proportion of low-income households than other regions, they are not necessarily poorer than elsewhere (Table 2 and Figure 22). The 50:60 ratio percentage measures the number of households with income below 50% of the national median household income as a proportion of the number of households with income below 60% of the national median. The higher the ratio, the deeper is the incidence of low-income households. According to this measure, around 70-80% of households in Northland whose incomes are below 60% of the national median household income have income less than 50% of the median. This is very similar to the New Zealand average. In fact the 50:60 ratio falls within the 70-80% range for all 12 regions.
During 2002-2007, the Northland home affordability index increased by 20% per annum, the largest rise in any region except Taranaki (the twelfth region, Central Otago Lakes was not separately identified in this period).
While household incomes were improving in Northland, house prices were increasing at a much faster rate so the gap between Northland and the national index closed rapidly. The index has subsequently decreased during 2007-2011, driven by falling house prices and interest rates. However, the index suggests that it is still more expensive for Northlanders to purchase a home in the region than it was in the early 2000s.
Figure 21: Low-income households in Northland, 2002-2011
- Measured by the proportion of all households with household income below a constant value threshold equivalent to 60% of the 2002 national median household income adjusted each year with the Consumers Price Index (CPI).
- A household's situation is considered to have improved if its income rises in real terms, irrespective of whether its rising income makes it any closer or further away from the middle household. In the short to medium term the CV measure is considered the more fundamental measure of poverty as it reveals whether the incomes of low-income households are rising or falling in real terms.
Source: Statistics New Zealand, New Zealand Income Survey
Figure 22: Low-income depth in Northland, 2002-2011
- The 50:60 ratio percentage is the number of households with income below 50% of the national median household income as a proportion of the number of households with income below 60% of the national median. The lower the proportion the less depth there is, and a negative change indicates an improvement.
Source: Statistics New Zealand, New Zealand Income Survey
The home affordability index uses the median weekly household income data, together with interest rates and house prices, to calculate the expense of purchasing a house in comparison to income availability. According to this index, Northland was the sixth most affordable region in which to purchase a home at the end of 2011, behind Southland, Otago, Taranaki, Manawatu/Wanganui and Hawkes Bay/Gisborne (Table 2 and Figure 23).
Figure 23: Home affordability index in Northland, 2002-2011
- Home affordability is assessed by comparing the average weekly earnings with the median dwelling price and the mortgage interest rate. The earnings figure represents the money available to the family, or household unit, and the median dwelling price combined with the mortgage interest rates provide an indicator of the expense involved. The lower the index the more affordable is the housing.
Source: Massey University, Home Affordability Report
References
For a detailed discussion of various low-income indicators and an overview of poverty in New Zealand see Perry, B., 2011. Household incomes in New Zealand: Trends in indicators of inequality and hardship 1982 to 2010. www.msd.govt.nz
2 GDP is the standard indicator of economic growth. It measures the total market value of goods and services produced, after deducting the cost of goods and services purchased as inputs in the production process (intermediate consumption). It indicates the “value added” of production and the income available to reward the factors of production involved.