Soil quality
What is our soil quality?
Soil monitoring programme results
The term soil quality can be defined as "the capacity of a specific soil to function, within natural or managed ecosystem boundaries, to sustain plant and animal productivity, maintain or enhance water and air quality, and support human health and habitation" (Soil Science Society of America: 1995).
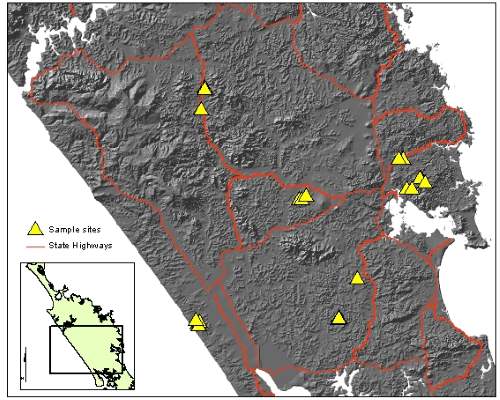
In order to measure soil quality, the council undertakes five-yearly soil monitoring. The programme has 24 individual sites chosen to represent the major soil types and land uses within the region (Figure 42). The soil types range from fine clays to bouldery clay loams with land uses including dry stock, dairy, plantation forestry, indigenous forest and horticulture. Sites were selected where intensification of land use was expected to occur and where there are a wide range of land uses. They were first sampled in 2001 as part of the national 500 Soils project. These same sites were re-sampled in 2006, and again in 2010-11. The following section analyses and interprets changes in soil quality that have occurred between 2001, 2006 and 2010-11 (for detailed information see the technical report: Soil Quality in Northland 2010-11, available online at www.nrc.govt.nz/landandsoils).
Figure 42: Sample sites in soil monitoring programme
Seven primary soil indicators were measured to assess soil quality (Table 7). The indicators selected to assess soil quality reflect the idea that soil quality is not a single concept, but encompasses aspects of the soil physical structure, chemical fertility, nutrient storage, organic matter resources, and the biology in the soil. There are potentially many indicators that can be used, but for any extensive national or regional monitoring scheme it is not practical to have more than a small core number.
Table 7: Indicators used for soil quality assessment (Landcare Research: 2011)
| Group | Indicator | Soil quality information |
| Group 1 - Fertility | Olsen phosphorus | Plant available phosphorus |
| Group 2 - Acidity | pH | Acidity or alkalinity of soil |
Group 3 - Organic resources |
Anaerobically mineralisable nitrogen | Availability of nitrogen reserve, surrogate measure for soil microbial biomass |
| Total carbon | Organic matter reserves, soil structure, ability to retain water | |
| Total nitrogen | Organic nitrogen reserves | |
Group 4 - Physical properties |
Bulk density | Soil compaction, physical environment for roots and soil organisms |
| Macroporosity | Availability of water and air, retention of water, drainage properties |
The indicators themselves do not measure soil quality. Soil quality is a value judgement about how suitable a soil is for a particular use. The indicators measure attributes of a soil (for example, pH, and bulk density). Consequently, different target values for indicators are needed for different land uses. For example, soils with pH<5 may be of suitable quality to grow radiata pine, but not for a good crop of white clover. The pH level also affects the availability of plant nutrients so soil must be managed within a pH band to ensure, for example, phosphate is available to plants.
Soils that are stony and excessively free-draining may be of poor quality for pasture production, but of excellent quality for vineyards.
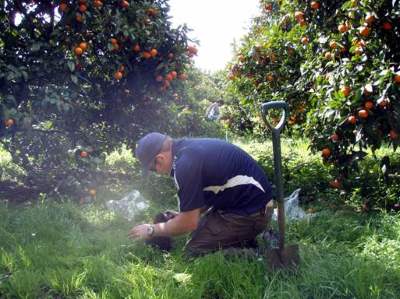 A regional council staff member soil sampling in a citrus orchard in Glenbervie.
What are the issues affecting soil quality?
The soil quality characteristics of sites sampled in 2010-11 followed some of the same trends as those seen in other regions of New Zealand. Land use was the major driver of soil quality. Pugging and compaction on more heavily stocked dairy and dry stock sites remains a particular concern (both in Northland and nationally), as comparison of soil quality parameters between 2001, 2006, and 2010-11 suggests an overall significant decline in macroporosity (the large pore spaces in soil).
Pugged soils are a problem because the hard surface on the soil prevents penetration of the water, which reduces the rate of water infiltration into the soil. Compaction affects more of the soil profile, reduces pore space affecting aeration and the rate water drains through the soil profile, and can lead to anaerobic conditions. This can stunt plant growth in addition to increasing erosion and runoff, which affects water quality and farm productivity.
Like many other regions in New Zealand, high total nitrogen and mineralisable nitrogen (N) levels are of concern, particularly on some dairy and dry stock sites. This is because N can get into waterways through groundwater and overland flow from land which can lead to nutrient enrichment problems. In contrast, low Olsen P levels observed on some dry stock sites indicate pasture production is likely to be sub-optimal and could eventually lead to overgrazed conditions. There was an instance of high pH (alkaline) on one dry stock site, which may have been an anomaly, but which can be remedied by adding acidifying minerals or organic material to the soil.
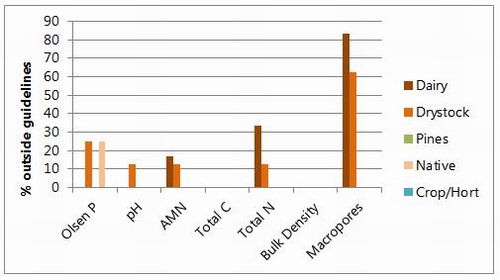
It is noted that due to the small number of sites the standard deviation (variation) is high for many of the indicators, which makes it difficult to make generalisations about the 2010-11 results. The climate variability between sampling years may also have contributed to several sites/indicators changing greatly from 2001 to 2006, and then returning to 2001 levels by 2010-11. Adding more sites to the programme and sampling at the same time of year will help to minimise this variation. Figure 43 shows the number of soil quality indicators that did not meet the quality targets by land use.
Figure 43: Proportion of all sites not meeting targets for specific indicators
How are we measuring up against our objectives?
The following are the anticipated environmental results relevant to soil conservation and land management in the Regional Policy Statement for Northland:
Continued availability of highly versatile soils for primary production
• Areas of highly productive soils have been identified using the New Zealand Land Resources Inventory.
• Only approximately 10% of Northland's land area is considered to have "highly productive and versatile soil" (LUC classes 1, 2 and 3).
• In recent years, large areas of land with prime soils for agricultural and horticultural production have been subdivided for lifestyle blocks and urban development.
• Whāngārei District Council introduced Plan Change No.93 in 2011 which aims to cluster the siting of dwellings within lifestyle block subdivisions rather than have houses scattered throughout the areas of highly productive soils on the outskirts of Whāngārei.
More widespread adoption of soil conservation practices within land use and subdivision proposals
• Runoff from earthworks and changes in land use is continuing to cause erosion and contamination of waterways.
• Since 2010, the Northland Regional Council has been running annual sediment reduction seminars for contractors and consultants involved with earthworks.
Reduction of erosion in high-risk areas; and the reduction in the volumes of soil and other contaminants entering surface water bodies
• Increased resources in terms of regional council land management staff time and resources have gone into soil conservation and water quality improvement initiatives. A recent project has aligned areas of erosion-prone land identified on the land resource inventory with areas of land in pasture from the land cover database. This aids in identifying areas that will benefit the most from soil conservation efforts and assists with targeting resources.
• Poplars and willows have been provided to landowners to assist with soil conservation projects which have been funded through the council's Environment Fund. For example, in the 2011/12 financial year 2170 poplar poles and 5074 willow wands were provided to landowners. The council has contracted landowners to supply poplar poles locally and is also in the process of developing a poplar nursery on council-owned land to secure future supply.
• Water Quality Improvement Plans are now developed for any applicants applying to the Environment Fund. In the 2011/2012 financial year the Environment Fund provided assistance to 44 fencing projects that had a focus on protecting erosion-prone land or protecting rivers and streams which helped fund a total of 72km of fencing. The fund also assisted with 11km of fencing around wetlands.
• Based on a comparison between current erosion severity and type recorded in the NZ Land Resources Inventory Worksheets, soil loss in 2011 is significantly less than in 1975. This is due to improved pasture cover on much of the land that is farmed, reversion of some steeper, scrubby farmland to bush and widespread afforestation of large areas of marginal hill country in the 1980s.
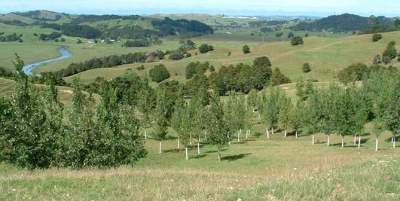 Poplar planting used to stabilise a hillside.
What is being done?
The council will continue with the programme of re-sampling existing sites to determine the extent and direction of any changes since original sampling. The next re-sampling of these sites will be in 2015-16, but additional sites will be added to encompass different soil types, providing a wider representation of soil types and giving a better geographic spread across the region. More samples across a greater range of soil types and locations will also increase the ability to detect change between land uses.
The findings of this sampling programme have been discussed with field staff of Ballance Agrinutrients who confirm the findings of dropping Olsen P levels on sheep and beef properties. These field staff will assist the council to find additional sampling sites and will provide both historic data on the sites and trends in nutrient levels between the five-yearly sampling.
The council also informs land managers of the soil quality on their properties, and if remedial action is justified, they are advised on possible management strategies to protect the environment while still achieving an economic return from the land. Farmers are encouraged to use the Visual Soil Assessment Tool to monitor the ‘health' of their soils. More detailed soil mapping data held by the council is made available to landowners and to their advisors to, for example, increase the levels of confidence in nutrient modelling using OVERSEER or other nutrient management tools.
References
Landcare Research (2011). SINDI online soil quality indicators. Accessed 27 October 2011.
Northland Regional Council (2001). Soil Quality in Northland 2007-11.
Soil Science Society of America (1995). SSSA statement on soil quality. Agronomy News 1.
Statistics New Zealand Agricultural Survey.
Infometrics Regional Database http://www.infometrics.co.nz/
Teal, W. (2011). Northland Regional Council staff report.
Northland Regional Council (2012). Forestry Earthworks and Harvesting Guidelines for Northland. Available from: https://www.nrc.govt.nz/forestry