Coastal water quality
Northland is known for its coastal environment, which includes 14 major harbours, many smaller estuaries and long stretches of open, sandy coastline.
The ‘wild' west coast of the region is buffeted by the Tasman Sea and is dominated by several long, straight, sandy beaches, the most famous being Te Oneroa a Tohe (Ninety Mile Beach) in the Far North. Two significant harbours are also found along this coastline, the Kaipara Harbour, which is shared with the Auckland region, and the Hokianga Harbour, north of the great Waipoua Forest.
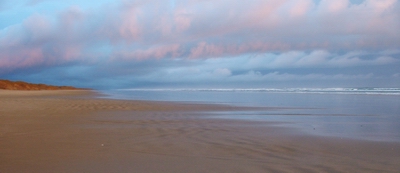 Sunset along Te Oneroa a Tohe (Ninety Mile Beach).
The east coast is bounded by the Pacific Ocean and although calmer than the west, is more rugged. This coastline is dotted with bays, headlands, estuaries and inlets and the majority of Northland's harbours are found along this coast including the Whangaroa Harbour, Bay of Islands and Whāngārei Harbour.
Numerous islands can also be found offshore of the east coast including the Cavalli Islands, the Hen and Chickens and the world famous Poor Knights Islands.
All of these sites are known for their diverse and plentiful marine life and their wildlife conservation value.
The council carries out monitoring of this coastal environment to record its current condition, the effects of human activity and to detect any changes, positive or negative, over time. Coastal water quality is monitored through a number of council state of the environment programmes. Maintaining coastal water quality at a good level is important to Northland's residents, economy and the many diverse forms of marine life that live in this environment.
What do we want for our coastal water quality?
The operative Regional Policy Statement for Northland includes community objectives for each natural and physical resource in the region. For coastal water quality the objectives are:
• The maintenance or enhancement of the water quality of natural water bodies and coastal waters in Northland to be suitable, in the long-term, and after reasonable mixing of any contaminant with the receiving environment and disregarding the effect of any natural events, for the purposes of aquatic ecosystem, contact recreation, aesthetic and cultural purposes and the gathering of shellfish for human consumption or cultural purposes.
• The reduction and minimisation of the quantities of contaminants which adversely affect water quality entering coastal waters in particular those that are potentially toxic, persistent or bio-accumulative.
• Avoid, remedy or mitigate the adverse effects of discharges of contaminants on the traditional, cultural and spiritual values of water held by tangata whenua.
• The efficient and effective control and minimisation of the impact of oil pollution in the Coastal Marine Area.
The policy statement also includes the following anticipated environmental results expected as a consequence of carrying out the policies and methods to achieve the coastal water quality objectives:
• Water quality suitable for desired purpose.
• Contaminants in water bodies are reduced.
• The adverse effects of contaminants in water bodies and coastal waters are avoided, remedied or mitigated.
• Improved aquatic habitat.
Note: the operative Regional Policy Statement is currently being reviewed. The proposed Regional Policy Statement (2013) is available at www.nrc.govt.nz/RPS
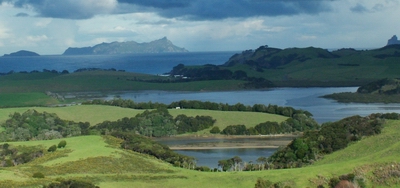 Taiharuru Estuary with a view to the Hen and Chickens Islands.
What are the issues affecting coastal water quality?
Pathogens
Water that contains high levels of pathogens (disease-causing organisms) can be harmful to human health. Swallowing water contaminated with pathogens, or being exposed to pathogenic water through cuts in the skin or inhalation of spray, can lead to skin, eye and ear infections, and stomach and respiratory illnesses.
Aquatic foods (kai moana) can also become contaminated with faecal pathogens from exposure to contaminated water. Such pathogens can stay in the flesh of shellfish long after the surrounding water quality has improved. Bacterial and viral contamination can affect both recreational and commercial shellfish gathering.
Bacteria occur naturally in the environment and elevated levels of bacteria in water can result from the re-suspension of bacteria-rich sediment during rough weather, particularly the sediment from around mangroves. Wild animals, such as seabirds, also account for bacterial contamination in some places, particularly in enclosed areas or roosting locations where their faeces can accumulate. However, bacterial contamination can also result from human activity. Livestock effluent, wastewater discharges, sewage overflows, and faulty or poorly maintained septic tank systems, can all cause bacterial contamination in the marine environment.
Nutrients
While nutrients are essential for all forms of life, nutrients that enter the environment from anthropogenic sources, such as fertiliser, stormwater from developed areas, treated wastewater, sewage overflows and failing septic systems, may exceed the needs of an ecosystem. Too much nutrient in the water can cause excessive plant growth leading to algal blooms and lowered levels of dissolved oxygen. This can reduce the life-supporting capacity of the water, and pose a significant human health risk through contact with toxic algal blooms and eating contaminated shellfish. Excessive plant growth can also look unattractive and can cause an unpleasant odour when it dies and decays.
Sediment
The erosion of soil and its transport as sediment through the freshwater system to the coastal environment is a natural process. However, deforestation for agriculture, forestry and urban development has dramatically increased sediment loads reaching the coastal environment, which can have a number of adverse environmental impacts. Increased suspended sediment concentrations in coastal waters can:
• Restrict light transmission in the water column and thus affect the amount of photosynthesis (primary production) of aquatic plants. Seaweeds and seagrass, typically require more light for photosynthesis than phytoplankton and are particularly susceptible to increased concentrations of suspended sediments as these plants are fixed to the seabed (Thrush et al.: 2004).
• Have negative impacts on suspension feeding animals, by clogging feeding structures, interfering with particle selection and requiring the use of energy to clear away unwanted particles (Thrush et al.: 2004).
• Negatively impact the abundance and diversity of fish assemblages by clogging gills and reducing feeding efficiency.
• Discolour the water and reduce water clarity making it less suitable/attractive for recreation, for example, swimming.
Sediment can also have further adverse impacts when it is deposited on the seabed, which is discussed in the ‘What is the current state of our harbours and estuaries?' section of this report.
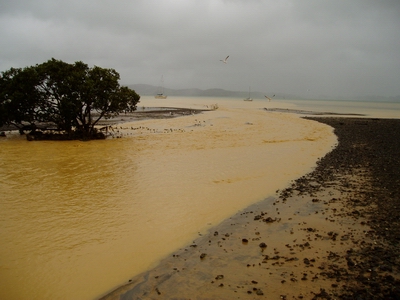 Sediment in a coastal stream after small-scale earthworks were undertaken without adequate sediment control.
What is our coastal swimming water quality like?
Coastal water quality at a selection of the region's most popular coastal swimming sites has been monitored by the council through the Recreational Swimming Water Quality Programme since the summer of 2000.
The programme is a joint project between the council, the Northland District Health Board and the three district councils (see also ‘Freshwater quality' section). Water quality is monitored for 12 to 18 weeks over the summer period (usually from the end of November until the end of March). Water samples are collected once a week from these sites and analysed for faecal indicator bacteria. In open coastal locations, levels of Enterococci bacteria are measured. In enclosed coastal locations where bacteria (enterococci) may be naturally occurring, levels of faecal coliforms are also measured.
The sample results are compared against the Ministry for the Environment Microbiological Water Quality Guidelines (Ministry for the Environment: 2003) to determine if a site has acceptable levels of bacteria for swimming (Table 37 and Table 38).
At the end of the sampling week, each site is given a grading based on its suitability for swimming – red for ‘considered unsuitable', orange for ‘potentially unsuitable' and green for ‘considered suitable' for swimming. These results are posted on the council website at www.nrc.govt.nz/swimming and forwarded to the health board and district councils, so that these agencies can issue public health warnings or erect warning signs.
At the end of the sampling season each site is given an overall grading based on the number of samples that were considered ‘suitable' or ‘unsuitable' during the season. This provides the public with an indication of how suitable a site is for swimming outside of the monitoring period.
Table 37: Single sample guidelines for open coastal sites (Ministry for the Environment: 2003)
|
Enterococci count |
Category |
Response |
|
Sample < 140 per 100 ml |
Surveillance (considered suitable for swimming) |
|
|
140 < Sample < 280 per 100 ml |
Alert (considered potentially unsuitable for swimming) |
|
|
Sample > 280 per 100 ml |
Action (considered unsuitable for swimming) |
Warning signs erected if result confirmed. Public informed through the media that a public health risk exists. If results remain above action threshold, site investigation undertaken. |
Table 38: Single sample guidelines for enclosed coastal sites (harbours and estuaries)
|
Faecal coliform count |
Category |
Enterococci count |
Category |
Grade |
|
Sample < 150 per 100 ml |
Surveillance (suitable) |
Sample < 140 per 100 ml |
Surveillance (suitable) |
Suitable + suitable = surveillance |
|
150 < Sample < 600 per 100 ml |
Alert (potentially unsuitable) |
140 < Sample < 280 per 100 ml |
Alert (potentially unsuitable) |
Any other combination = alert |
|
Sample > 600 per 100 ml |
Action (unsuitable) |
Sample > 280 per 100 ml |
Action (unsuitable) |
Unsuitable + unsuitable = action |
For more information on the programme, or a more detailed description of monitoring methods and grading, please refer to the technical report "Recreational Swimming Water Quality in Northland 2010-11". Find a copy at: www.nrc.govt.nz/swimmingWQreports
Recreational Swimming Water Quality Programme
A total of 74 coastal swimming sites were monitored over the five swimming seasons (shown on Table 40). Table 40 also shows the number of samples taken from each site and the number of samples that fell outside the recommended guidelines, or rather those that were above the ‘action' or ‘red' threshold for each site.
Table 39 shows the coastal water compliance grading system broken down into four categories.
Table 39: Grading categories for coastal water quality
|
Category |
|
95-100% samples <280/ml Enterococci |
|
90-95% samples <280/ml Enterococci |
|
75-90% samples <280/ml Enterococci |
|
<75% samples <280/ml Enterococci |
An overall median of the data for each site has also been calculated to give an indication of the site's general suitability for swimming – sites in bold are permanent monitoring sites. These sites remain in the programme each year to provide a benchmark against which to monitor change over time. Figure 80 shows compliance with guidelines over time for the 15 permanent coastal monitoring sites. In general, yearly compliance rates vary depending on annual rainfall and drought periods. Other sites are added or removed each season depending on demand and resources. The medians for all sites are within the "suitable for swimming" category.
Figure 78: Coastal water quality annual grading results 2007/08 – 2011/12
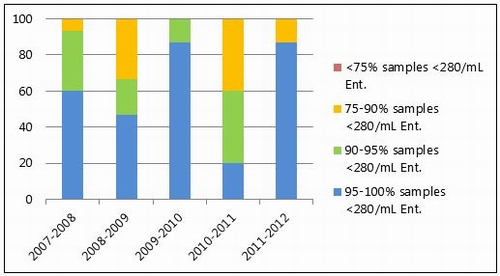
Table 40: Statistics for the coastal recreational bathing programme sites from 2007/08 to 2011/12. Sites in bold are permanent monitoring sites
|
Site name |
Total No. of sample |
Median value (Ent/100mL) compared to guidelines listed in Table 38 |
Percentage of samples within guidelines listed in Table 39 |
|
Ahipara at beach off Kaka Street (camp ground) |
23 |
10 |
95.7 |
|
Baylys Beach at Sea View Road |
33 |
10 |
100.0 |
|
Bland Bay at beach |
19 |
10 |
94.7 |
|
Cable Bay at East beach |
45 |
10 |
100.0 |
|
Church Bay at mid bay |
64 |
10 |
95.3 |
|
Cooper's Beach at Kanekane Street east |
50 |
10 |
96.0 |
|
Glinks Gully at Beach off Marine Drive |
33 |
10 |
100.0 |
|
Hōreke |
12 |
20 |
100.0 |
|
Intertidal beach off One Tree Point east cliffs |
38 |
10 |
92.1 |
|
Kerikeri opposite boat ramp |
3 |
10 |
66.7 |
|
Kerikeri Inlet at Skudders Beach |
26 |
42 |
76.9 |
|
Kowharewa Bay |
54 |
10 |
88.9 |
|
Langs Beach at midway along beach |
71 |
10 |
98.6 |
|
Langs Beach at north end of beach |
36 |
10 |
100.0 |
|
Mangawhai |
25 |
10 |
96.0 |
|
Mangawhai above camp ground |
33 |
10 |
97.0 |
|
Mangawhai opposite Norfolk pine |
33 |
10 |
97.0 |
|
Mangawhai Harbour at Picnic Bay |
24 |
10 |
95.8 |
|
Mangawhai Harbour at pontoon |
11 |
10 |
90.9 |
|
Mangawhai Heads at motor camp foreshore |
23 |
10 |
95.7 |
|
Mangawhai Heads at open coast |
48 |
10 |
97.9 |
|
Matai Bay at South end beach below toilet block |
28 |
10 |
100.0 |
|
Matapōuri Bay at beach |
17 |
5 |
100.0 |
|
Matapōuri at 1st bridge |
53 |
42 |
88.7 |
|
Matapōuri at 2nd bridge |
53 |
20 |
88.7 |
|
Matauri Bay at right of campground |
25 |
10 |
100.0 |
|
McLeod Bay by toilet |
56 |
10 |
94.6 |
|
Ngunguru at boat ramp |
13 |
10 |
100.0 |
|
Ngunguru at motor camp |
64 |
10 |
98.4 |
|
Ngunguru at Norfolk pine |
55 |
10 |
100.0 |
|
Ngunguru Estuary at school |
61 |
20 |
82.0 |
|
Oakura Bay at beach, north end of bay |
54 |
10 |
98.1 |
|
Ocean beach at centre of beach |
46 |
10 |
100.0 |
|
Ohawini Bay at Parutahi beach, Whangaruru |
48 |
10 |
89.6 |
|
Omamari Beach at beach by stream |
35 |
10 |
97.1 |
|
Ōmāpere at Pioneer Walk Road |
52 |
10 |
98.1 |
|
Onerahi opposite play boat |
64 |
10 |
96.9 |
|
Opononi at Hokianga Harbour below hotel |
53 |
10 |
96.2 |
|
Ōpua Foreshore at shop end of beach |
45 |
20 |
77.8 |
|
Pacific Bay at Beach |
63 |
10 |
90.5 |
|
Pahi 150m NW of jetty |
47 |
10 |
95.7 |
|
Pahi at broken rocky groyne |
47 |
10 |
100.0 |
|
Paihia below road junction |
13 |
10 |
84.6 |
|
Paihia in front of toilets |
52 |
10 |
94.2 |
|
Paihia at Te Haumi River |
30 |
10 |
93.3 |
|
Paihia at Waitangi Bridge (beach) |
50 |
10 |
88.0 |
|
Pataua South at east beach |
68 |
10 |
97.1 |
|
Pataua South at footbridge |
51 |
10 |
96.1 |
|
Pataua South at Frog Town |
32 |
10 |
96.9 |
|
Rarawa at Beach Road campground |
8 |
10 |
100.0 |
|
Rāwene at past ramp |
50 |
10 |
98.0 |
|
Ruakaka Beach at near surf club |
72 |
10 |
98.6 |
|
Ruakaka River below motor camp |
61 |
10 |
95.1 |
|
Russell at Mid North Moorings |
27 |
10 |
92.6 |
|
Sandy Bay at centre of beach |
41 |
10 |
97.6 |
|
Shipwreck Bay off beach at end of Wreck Bay Road |
21 |
10 |
100.0 |
|
Taipa estuary at beside motor camp |
52 |
10 |
96.2 |
|
Taupō Bay at beach off Taupō Bay Road |
8 |
10 |
100.0 |
|
Tauranga Bay at end of Tauranga Beach Road |
7 |
10 |
100.0 |
|
Taurikura Bay |
65 |
10 |
90.8 |
|
Te Haumi River |
25 |
10 |
84.0 |
|
Teal Bay at Beach |
53 |
10 |
94.3 |
|
Tinopai at foreshore below Puapua Creek |
55 |
10 |
90.9 |
|
Tinopai at below shops |
59 |
10 |
100.0 |
|
Tokerau Beach at Melissa Road |
30 |
10 |
93.3 |
|
Uretiti Beach at Tip Road |
42 |
10 |
100.0 |
|
Urquharts Bay at beach |
54 |
10 |
92.6 |
|
Waipapa Kauri at West Coast Road motor camp |
31 |
10 |
100.0 |
|
Waipu Cove at beach |
60 |
10 |
98.3 |
|
Wellington Bay at beach in front of northern car park |
39 |
10 |
94.9 |
|
Whakapirau |
25 |
10 |
100.0 |
|
Whananaki at east beach |
55 |
10 |
89.1 |
|
Whananaki at footbridge above school |
48 |
25.5 |
85.4 |
|
Woolleys Bay at centre of beach |
49 |
10 |
100.0 |
*Note: Sites in bold are permanent monitoring sites
Figure 79: Coastal bathing sites monitored between 2007/08 and 2011/12, and how their faecal indicator bacteria levels compare with the swimming/contact recreation guidelines
What is the current state of our harbours and estuaries?
Northland's estuaries are important economic, social and cultural assets, with estuarine systems such as the Whāngārei Harbour and the Bay of Islands contributing significantly to Northland's economy and the environment. Estuaries are particularly valued because they are very productive ecosystems that play important roles in the functioning of coastal environments.
However, because estuaries and harbours are located at the end of the freshwater drainage system, they are particularly vulnerable to land-based activities and processes that occur within their catchments. In addition, because of the chemical reactions that take place when freshwater mixes with saltwater, fine sediments flocculate (mix and form solid lumps or masses) and these heavier particles then settle out of the water column. Significantly, terrestrial sediments differ from marine sediments in terms of their physical (grain size) and biogeochemical (microbial composition, nitrogen and phosphorus content) properties and may have contaminants such as heavy metals and polycyclic aromatic hydrocarbons (PAHs) attached or adsorbed. Estuarine environments are therefore depositional areas and often become the ultimate sink for contaminants that start in the catchment; that is, estuaries end up as the dumping ground for any contaminants in the waterways.
In Northland, extensive clearance of natural vegetation cover for agriculture, forestry and urban development has increased the amount of sediment, nutrient and metal contaminant loads that reach our estuarine environments. Significant areas of saltmarsh and mangrove forest, which can act as natural filters for sediments and other contaminants, have also been drained and cleared for agriculture, urban development and infrastructure projects.
Estuary Monitoring Programme
The Northland Regional Council has implemented an estuarine monitoring programme in order to:
• Assess the health of our estuaries and monitor change over time.
• Identify impacts from diffuse inputs and cumulative impacts of contaminants from human activity and development.
• Assess the effectiveness of Northland's regional plans and rules and enable informed decision-making by politicians and resource managers.
• Inform the public and promote awareness of environmental issues impacting estuarine health.
A key element of the programme involves sampling the biological communities of representative intertidal habitats together with the physical (sediment particle size) and chemical properties (nutrient and metal contaminants) of the sediment, which is the habitat for the animals. This should help us to understand the environmental factors that are influencing the biological communities at different sites.
The council has established four estuary monitoring sites in the Whāngārei Harbour, three sites in the Kerikeri Inlet and two sites in each of the Ruakaka Estuary, Kaipara Harbour and Whangaroa Harbour. By December 2011 we had collected three years of baseline data at each site, which will be used to monitor the health of the biological communities over time and relate any changes to the quality of their habitat.
The latest sampling results can be viewed at www.nrc.govt.nz/amr and a full analysis of all results can be viewed in the technical report for each estuary at www.nrc.govt.nz/coastalresearch
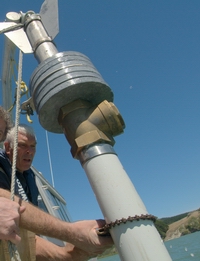
Harbour water quality monitoring
The council currently conducts routine monitoring of harbour water quality in the Whāngārei Harbour, the Bay of Islands and the Kaipara Harbour. The council has also conducted short-term monitoring of water quality in the Hokianga Harbour and the Whangaroa Harbour.
Whāngārei Harbour water quality
The council monitors water quality at 16 sites in the Whāngārei Harbour every two months (Figure 81). Twelve chemical and physical water quality parameters are measured, including dissolved oxygen, water clarity, temperature, salinity, faecal bacteria and nutrients. Of the 16 sites monitored, eight have been monitored for more than 10 years, one site for five years and seven sites for three years.
Faecal indicator bacteria results were usually within relevant guidelines for swimming/contact recreation (Table 38) between 2007 and 2011. Seventy-five percent of faecal coliforms were within the Regional Coastal Plan standards, and 89% of Enterococci were within Ministry for the Environment (MfE) guidelines. The highest concentrations were generally found in samples collected from Onerahi to the Town Basin. The results suggest that water quality in the Whāngārei Harbour downstream of Onerahi is normally of a standard that is suitable for swimming and other recreational activities. However, between Onerahi and the Town Basin levels of bacteria were not generally of a standard that is suitable for swimming and recreational activities.
Turbidity levels were also normally within the Australian and New Zealand Environment and Conservation Council (ANZECC) guidelines (Figure 81). Turbidity is a measure of the degree to which water loses its transparency, due to the presence of suspended particles. When there are lots of suspended particles in the water the murkier it appears and the higher the turbidity. Turbidity can be influenced by water discharges, algae in the water and sediments from erosion and urban runoff.
Interestingly, the highest median turbidity values were recorded in the Mangapai River. The Mangapai River has a relatively small catchment and the majority of the land use is exotic grassland for dairy and dry stock. As expected, the lowest turbidity was generally recorded towards the mouth of the harbour as these sites are furthest from the main freshwater inputs. Overall the results indicate that turbidity was usually within levels required to support healthy aquatic habitat.
Figure 80: Whāngārei Harbour water quality monitoring sites
Figure 81: Whāngārei Harbour water quality compliance results 2007-2011
Water quality data collected in the harbour between 2000 and 2010 was analysed to see if there were any trends. The analysis found that there was a decrease in faecal coliforms at Kaiwaka Point and a decrease in enterococci bacteria at Tamaterau, which are positive trends. Enterococci increased at both Marsden Point and One Tree Point, which are negative trends.
Ammonia decreased at two sites and total phosphorus decreased at one site, both positive trends. Dissolved oxygen increased at two sites and water clarity increased at three sites, which are also positive trends, but turbidity increased at two sites – a negative trend.
It should be noted that there is limited data available for trend analysis of some parameters including nutrients, because these parameters have only been monitored for three years, so the results presented here need to be treated with caution.
Table 41: Statistically significant trends in water quality data for the Whāngārei Harbour 2000 – 2010
| Site name | Parameter | Trend |
| Town Basin | Dissolved oxygen | Increasing (positive) |
| Riverside Drive | Turbidity | Increasing (negative) |
| Limeburners Creek | Dissolved oxygen | Increasing (positive) |
| Kissing Point | Water clarity | Increasing (positive) |
| Kaiwaka Point | Faecal coliforms | Decreasing (positive) |
| Onerahi | Turbidity | Increasing (negative) |
| Mangapai River | Ammonium (NH4) | Decreasing (positive) |
| Tamaterau | Enterococci | Decreasing (positive) |
| One Tree Point | Enterococci | Increasing (negative) |
| Ammonium | Decreasing (positive) | |
| Total phosphorus | Decreasing (positive) | |
| Marsden Point | Enterococci | Increasing (negative) |
| Water clarity | Increasing (positive) | |
| Mair Bank | Water clarity | Increasing (positive) |
For more information on water quality results and trends for the Whāngārei Harbour, please refer to the technical report entitled, "State of the Environment Water Quality in the Whāngārei Harbour 2000-2010", which is available online at www.nrc.govt.nz/coastalresearch
Bay of Islands water quality
The council monitors water quality at 16 sites in the Bay of Islands Harbour every two months (Figure 82). Twelve chemical and physical water quality parameters are measured. All sites have been monitored since May 2008.
Figure 82: Bay of Islands Harbour water quality monitoring sites
Between 2008 and 2011, faecal indicator bacteria results were usually within the relevant guidelines for swimming/contact recreation Figure 84). Ninety-three percent of faecal coliforms were within the Regional Coastal Plan standards, and 98% of Enterococci were within MfE guidelines. These results suggest that levels of faecal bacteria in the Bay of Islands were normally of a standard that are suitable for swimming and recreational activities. The highest median concentrations of enterococci were recorded at the Waipapa River, Kerikeri River and Kawakawa.
Turbidity levels were also mainly within ANZECC guidelines (Figure 84). The highest median levels of turbidity were recorded at the Waikare Inlet, the Kawakawa River and at Tapu Point. All these sites are located close to the outlet of the Kawakwa River, the river being a major freshwater input to the Bay. Freshwater flows often carry particles and contaminants off the land and out to sea, particularly after rainfall. Overall the results indicate that turbidity was usually within guideline levels.
Nutrient concentrations frequently exceeded the ANZECC guidelines in the Bay of Islands (Figure 84). Fifty-eight percent of samples exceeded the guidelines for nitrate-nitrite nitrogen while 41% and 38% of samples exceeded guideline values for ammonia and dissolved reactive phosphorus respectively. Overall the results indicate that nutrients were at levels that had the potential to have adverse biological effects. Not unexpectedly, the highest concentrations of nutrients were generally recorded at sites located close to freshwater inputs.
Figure 83: Bay of Islands Harbour water quality compliance results 2008-2011
There is limited data available for trend analysis, because the monitoring programme has only been carried out for three years, so the results presented here need to be treated with caution. The trend analysis found that there have been deceases in concentrations of dissolved reactive phosphorus, ammonia and faecal coliforms at several sites throughout the Bay (Table 42) which are all positive trends. An increase in turbidity at Doves Bay was also found, which is a negative trend.
Table 42: Statistically significant trends in water quality data for the Bay of Islands 2008 –2011
| Site name | Parameter | Trend |
| Paihia south-east headland | Dissolved reactive Phosphorus | Decreasing (positive) |
| Te Haumi River | Faecal coliforms | Decreasing (positive) |
| Waitangi River | Dissolved reactive Phosphorus | Decreasing (positive) |
| Waipapa River | Faecal coliforms | Decreasing (positive) |
| Kerikeri River | Ammonia | Decreasing (positive) |
| Wainui Island | Dissolved reactive Phosphorus | Decreasing (positive) |
| Paihia | Dissolved reactive Phosphorus | Decreasing (positive) |
| Tapu Point | Dissolved reactive Phosphorus | Decreasing (positive) |
| Ōpua Basin | Dissolved reactive Phosphorus | Decreasing (positive) |
| Waikare Inlet | Dissolved reactive Phosphorus | Decreasing (positive) |
| Waikare Inlet | Ammonia | Decreasing (positive) |
| Doves Bay Marina | Turbidity | Increasing (negative) |
| Te Puna Inlet | Dissolved reactive Phosphorus | Decreasing (positive) |
| Paihia north-west headland | Dissolved reactive Phosphorus | Decreasing (positive) |
Kaipara Harbour water quality
In 2009, the council implemented a monitoring programme in the Kaipara Harbour in conjunction with Auckland Council. In Northland, nine sites (Figure 84) are monitored each month for a range of parameters including faecal indicator-bacteria (enteroccoci) and nutrients (DRP, NH4, NNN and TP). A further seven sites are monitored by the Auckland Council.
Figure 84: Kaipara Harbour water quality monitoring sites 2009-2011
Between 2009 and 2011 faecal indicator bacteria results were usually within MfE guidelines for swimming/contact recreation (Figure 85). Only three samples collected from Wahiwaka Creek and one sample from Burgess Island exceeded the guideline values out of a total of 288 samples collected during the three years of monitoring. These results suggest that levels of faecal indicator bacteria in the Kaipara Harbour were normally suitable for swimming and recreational activities. The highest concentrations of enterococci were normally recorded at the site in Wahiwaka Creek. The site at Wahiwaka Creek is located near the head of the Ōtamatea Channel and receives freshwater input from the Wairau and Kaiwaka Rivers. The catchments for these rivers both have a high proportion of pasture for dairy farming and the Maungaturoto and Kaiwaka wastewater treatment plants also discharge into these rivers.
Turbidity levels were normally within ANZECC guidelines (Figure 85). The highest median turbidity values were recorded at Wahiwaka Creek, Burgess Island, Kapua Point, and Hargreaves Basin, which are all located close to freshwater inputs. In contrast, the lowest median turbidity was recorded at the Ōtamatea Channel, which had the highest salinity, indicating that there is little freshwater influence at this site. Overall the results indicate that turbidity was usually within levels that are unlikely to have biological effects.
Nutrient concentrations frequently exceeded the ANZECC guidelines in the Kaipara Harbour. Ninety-nine percent of samples exceeded the Australia and New Zealand conservation council guidelines for dissolved reactive phosphorus, 44% exceeded the guidelines for ammonia and 55% of exceeded guidelines for nitrate-nitrite nitrogen, (Figure 85). These results suggest that nutrient concentrations in the Kaipara Harbour normally exceeded levels that had the potential to have biological effects.
The highest nutrient concentrations were generally recorded at sites located in the upper reaches of the different arms of the harbour while the lowest concentrations were found at the sites in the Five Fathom Channel and the Ōtamatea Channel.
Figure 85: Kaipara Harbour water quality compliance results 2009-2011
There is limited data available for trend analysis, because the monitoring programme has only been carried out since 2009 and so the results presented here need to be treated with caution. The trend analysis found that there has been a decrease in the concentration of dissolved reactive phosphorus at Five Fathom Channel, which is a positive trend but an increase in turbidity at Wahiwaka Creek, which is a negative trend (Table 43).
Table 43: Significant trends in water quality data for the Kaipara Harbour 2009-2011
| Site name | Parameter | Trend |
| Five Fathom Channel | Dissolved reactive Phosphorus | Decreasing (positive) |
| Wahiwaka Creek | Turbidity | Increasing (negative) |
Whangaroa Harbour water quality
The council conducted an investigation into the sources of faecal contamination in the Whangaroa Harbour between 2003 and 2011. Bacterial contamination was threatening the operating classification of the harbour for commercial growing of oysters and the council, in consultation with a number of stakeholders, initiated this investigation programme. The programme involved sampling 10 sites within the harbour and nine sites from the contributing streams (Figure 86) for turbidity and faecal indicator bacteria (total coliforms, faecal coliforms, and E. coli). The overall results from the contributing streams will be reported in 2013.
Figure 86: Whangaroa Harbour water quality monitoring sites
The results from 2007-2010 showed that faecal contamination was generally low, with a high percentage of samples below the MfE guidelines values for swimming/contact recreation (Figure 87). Results for specific sampling events following rainfall were elevated due to runoff from land but this is expected and the oyster industry does not harvest following significant rainfall.
The turbidity results showed that inner harbour sites generally had higher turbidity than sites in the outer harbour, and exceeded the ANZECC guidelines on far more occasions. The sites at Waitaruke Drain Mouth and west of Cape Horn frequently exceeded the turbidity guidelines. These two sites appear to be affected by high turbidity from contributing streams, upstream of the sites.
Figure 87: Comparison of faecal indicator bacteria and turbidity levels in Whangaroa Harbour with relevant guidelines 2007-2010
Hokianga Harbour water quality
The council conducted a monitoring programme in the Hokianga Harbour between June 2009 and June 2010. Sixteen sites (Figure 89) were monitored each month for faecal indicator bacteria (E. coli, enterococci and faecal coliforms) and nutrients (total nitrogen and total phosphorus). Shellfish were also collected at four of these sites and the shellfish flesh analysed for E. coli levels.
Figure 88: Hokianga Harbour water quality monitoring sites
The water sample results showed that the levels of faecal indicator bacteria were usually within the MfE guidelines for swimming/contact recreation (Figure 90).
The water sample results showed that 73% of total nitrogen concentrations and 57% of total phosphorus were within ANZECC guidelines. The highest concentrations of nutrients were recorded in the upper harbour, upstream of Rāwene, with low concentrations found near the harbour entrance.
Figure 89: Hokianga Harbour water quality compliance results 2009-2010
Results from the shellfish flesh did not meet the relevant commercial guidelines (New Zealand Food Safety Authority Animal Products (Specifications for Bivalve Molluscan Shellfish) Notice 2006) at all four sites tested. The guidelines state that the E. coli median Most Probable Number (MPN) of the shellfish samples must not exceed 230 E. coli per 100g and that not more than 10% of the samples must exceed a MPN of 700 per 100g.
Although medians were below 230 E. coli /100ml at all four sites, approximately 23-30% of individual samples exceeded the guideline value of 700 E. coli per 100g (Table 44).
Table 44: E. coli levels in shellfish flesh collected from the Hokianga Harbour between 2009 and 2010
Site |
Median | % of individual samples exceeding NZFSA guideline | |
| 109685 | Outer Mangamuka River and island | 42.5 | 30.00 |
| 109686 | South Kohukohu | 61.5 | 23.33 |
| 109687 | Rāwene Ferry Ramp | 80.5 | 23.33 |
| 109692 | Ōmāpere | 78 | 24.44 |
NZFSA Guideline (E. Coli/100g W/W) |
230 | <10 | |
Investigating sources of contamination
In 2009, a review of the council's water quality data at the commercial oyster growing areas of Kerikeri Inlet and Whangaroa was undertaken and found that some sites were not meeting the water quality standards for the collection of shellfish. Results of water and shellfish sampling undertaken by Northland District Health Board in the Houhora Harbour also showed that concentrations of faecal coliform bacteria were occasionally above the guidelines in 2008-2009.
In response to these results, the council and the health board agreed that there were unacceptably high levels of bacteria indictors in these three estuaries and undertook microbial source tracking to determine the potential sources of E. coli in coastal waters and shellfish.
The results summarised in Table 45, indicated that the sources of contamination were generally ruminant (herbivore) and wildfowl.
The full technical report, identifying the sources of faecal contamination in coastal waters and shellfish in Northland's waters in 2010, can be viewed at: www.nrc.govt.nz/coastalresearch
Table 45: Results from faecal source tracking work undertaken in the Houhora and Whangaroa Harbours and the Kerikeri Inlet
| Site | Water | Sediment |
| Kerikeri Inlet | Ruminant | Wildfowl and herbivore |
| Houhora Harbour | No result | Wildfowl and herbivore |
| Whangaroa Harbour | Ruminant | Wildfowl |
Harbour sediment monitoring
Metals in Sediment Programme
 Sediment in Whāngārei Harbour.
The council monitors metal concentrations and the physical characteristics of sediments every two years, at 16 sub-tidal sites in Whāngārei Harbour (Figure 90). This programme was established in June 2010, although the council had previously monitored the levels of metal contamination in harbour sediments.
Sediment samples are analysed for sediment grain size and concentrations of total cadmium, total chromium, total copper, total lead, and total zinc. Concentrations of metal contaminants were compared against the ANZECC guidelines for those metals.
Figure 90: Location of sediment sampling sites in Whāngārei Harbour
Whāngārei Harbour sediment
Heavy metals in sediment
In 2010-2011, all metal concentrations in sediments measured in the Whāngārei Harbour were within guideline levels at all sites, except for the concentration of zinc in the Waiarohia Canal. Sediments collected from sites located in tidal creek environments like the Hātea River and the Otaika Creek, generally had higher proportions of mud and metal concentrations than sites in the main body of the harbour.
This pattern is consistent with these sites being located close to potential sources of contaminants in depositional mud-dominated tidal creek environments.
Sediment accumulation rates
In response to growing concern about sedimentation rates in our estuaries, the council developed a programme to investigate historical sedimentation rates and sources of sedimentation in the Whāngārei Harbour, Kaipara Harbour, and the Bay of Islands. Sediment plates have also been installed to determine current sedimentation rates at our estuary monitoring sites in Kerikeri Inlet, Kaipara Harbour, Whangaroa Harbour and Ruakaka Estuary.
 Installation of a concrete sediment plate in Kerikeri Inlet.
In 2011, the council partnered with Northport to investigate sediment accumulation rates in Whāngārei Harbour. The first stage of the project involved the use of the Whāngārei hydrodynamic model to investigate the dispersion and deposition of fine sediment in the harbour from the Hātea River, Otaika Creak and Mangapai River.
Three different flow scenarios were used to investigate the dispersion and deposition of sediment under baseline conditions, a one-year rainfall event and a 10-year rainfall event, using the council's river flow data. The modelling suggested that a large proportion of fine sediment ends up being deposited on intertidal flats in the upper harbour near to these three freshwater sources. The model output also indicates that some sediment is deposited on intertidal flats in Parua Bay and Munro Bay on the northern shore of the harbour, which are relatively remote from any freshwater inputs.
The next stage of the project involved the collection of sediment cores at twelve sites, using a gravity corer to determine sediment accumulation rates for the harbour. These cores will be dated using radioisotopes in order to calculate the accumulation rates over the last 50-150 years.
 Gravity corer being deployed to collect sediment cores.
Sediment samples have also been collected from the harbour and from different soils in the surrounding land catchment in order to determine the sources of sediment deposited in the harbour using NIWA's compound specific stable isotope method. This sediment source sampling will provide detailed information on which land uses and sub-catchments are contributing sediment to the harbour.
The council also conducted ecological sampling at 39 sites throughout the harbour and this data will be analysed, together with results from the sediment dating, to determine which ecological communities are sensitive and vulnerable to sediment deposition. A full report for this project will be available in mid-2013.
Bay of Islands sediment
In 2010, the council started monitoring the metal concentrations and the physical characteristics of sediments every two years, at 16 sub-tidal sites in the Bay of Islands (Figure 91).
Sediment samples are analysed for sediment grain size and concentrations of total cadmium, total chromium, total copper, total lead, and total zinc. Concentrations of metal contaminants are compared against the ANZECC guidelines for those metals.
Figure 91: Location of sediment sampling sites in Bay of Islands in 2010
Metals in sediment
The metal concentrations measured in sediments collected from the Bay of Islands were all within ANZECC guideline levels. Sediments collected from tidal creeks, such as Kerikeri Inlet, Kawakawa River and the Waikare Inlet generally had higher proportions of mud and metal concentrations, while lower proportions of mud and metal concentrations were recorded in more exposed locations, in the outer Bay, such as Onewhero Bay.
Sediment accumulation rates
In 2011, the council commissioned NIWA to undertake a full analysis and interpretation of sediment and ecological data sets collected as part of the Land Information New Zealand (LINZ) Oceans 20/20 Bay of Islands survey. This included analysis of 23 sediment cores collected from the Bay of Islands, to determine the sediment accumulation rates and the sources of sediment to the bay. Analysis of ecological data from 25 intertidal and 72 subtidal sites was also undertaken to determine the sensitivity and vulnerability of the ecological communities at each site, to sedimentation.
Radiocarbon dating of shells buried within the sediment cores indicated that accumulation rates have averaged 0.23 ± 0.1mm/year over the last ≤9400 years. The sediment accumulation rate data indicates that on average 23,000 tonnes of sediment per year were deposited in the Bay prior to the mid-1800s. In contrast, over the last approximately 150 years, sedimentation rates have averaged 2.4 mm/year with an average of 509,000 ± 210,000 tonnes of sediment deposited in the Bay of Islands each year. This 22-fold increase in annual sedimentation suggests that a major shift in the sedimentary regime of the Bay of Islands system has occurred as a result of increased soil erosion, following the arrival of people and large-scale catchment deforestation over the last approximately 700 years.
Within the Bay, mud is accumulating more rapidly in the Waikare Inlet, areas around the Veronica Channel and Te Rāwhiti than in the central Bay, Kerikeri Inlet and the Te Puna Inlet.
Analysis of present day sediment sources, using the compound specific stable isotope method indicated that pasture is responsible for more than 60% of the sediment entering the Bay of Islands from all the major rivers, except the Waikare, which is dominated by native forest and kanuka scrub. The main sources of sediment to the Bay therefore appear to be consistent with the current land uses in these catchments although the relationship was not one to one. For example, there was a lack of material linked to citrus orchards and mature pine forests, which suggests that there is little soil erosion from these land uses. In contrast, there was a relatively large contribution of sediment from recently clear-felled pine forestry in delta sediments from the Te Puna and Kawakawa inlets. Recently cleared pine forest leaves the soil vulnerable to erosion for up to six years until replanting and canopy closure has occurred.
Past sources of sediment deposited in the Bay over the last several thousand years was also determined at five sites using radioisotope dating and stable isotope analysis of fatty acids. At Russell, for example, pre-Polynesian sediment deposits were composed of soils derived from native forest soils and bracken but by the 1850s the soil signatures for potatoes and dry stock pasture were detected. The signature for dairying pasture was detected from the 1870s and in the late 1940s soils derived from citrus orchards appeared in the sediment deposits.
The vulnerability of ecological communities was determined by examining the sensitivity of any dominant habitat-forming species and the most abundant species to sediment deposition. The analysis revealed that all areas of the Bay of Islands had some intertidal sites with sensitive communities, while the most sensitive subtidal communities were found mainly in the outer Bay of Islands and Te Rāwhiti.
The analysis also indicated that the sediment accumulation rates were an important predictor of the ecological community structure although only a small amount of the variability in the communities was explained by this. As the sediment accumulation rates provided some predictive ability for the ecological data, the rates were used along with the site vulnerability information to determine the sensitivity of each site. This revealed that the most sensitive sites were generally found in Te Rāwhiti although a sensitive intertidal and subtidal site was found in the area around the Veronica Channel.
The technical report can be viewed at www.nrc.govt.nz/coastalresearch
Kaipara Harbour sediment
Sediment accumulation rates
In 2009, Northland Regional Council partnered with Auckland Council and NIWA to investigate historical sediment accumulation in the Kaipara Harbour. The project involved the collection and analysis of sediment cores to reconstruct the sedimentation history of the harbour and identify the sources of catchment sediment that have accumulated over the last century.
Figure 92: Location of core sites in Kaipara Harbour 2010
Sediment cores up to 1.7m long were collected at 18 sites throughout the harbour (Figure 92) using a gravity corer deployed from NIWA's research vessel the Rangitahi III.
Analysis indicated that during the last 50-100 years the average sediment accumulation rate for the Kaipara Harbour was 6.7mm per year, although if data from two outlier cores is excluded, the average is 4mm per year. In either case, the average sediment accumulation rate in the Kaipara Harbour is in the upper range of average values measured in North Island estuaries and coastal marine environments. It is likely that most sediment is delivered to the Kaipara Harbour by episodic floods, when mud laden stormwater discharges into the harbour and some cores contained excellent examples of flood deposits, composed of pure layers of mud up to 60mm thick.
Further work to determine the sources of sediment is currently being undertaken by NIWA and initial results indicate that the Wairoa River is the major source of sediment deposited in the northern Kaipara and that sediment from this river is also deposited in the southern Kaipara Harbour.
The technical report can be viewed at www.nrc.govt.nz/kaiparasediment
What is being done?
Land management
The way that land is managed can impact upon coastal water quality in a number of ways; sediment, nutrient runoff and leaching and contamination with faecal material all contribute to a decline in water quality.
The council uses a number of different approaches to assist landowners and community groups to put in place practices that improve water quality.
• The council's environment fund can help with the cost of fencing stock out of on-farm waterways and the Coastal Marine Area. The fund will cover up to 50% of the cost of qualifying projects. These projects assist in the reduction of sediment, nutrients and faecal contamination.
• The council's environment fund can also provide poplars and willows to help stabilise erosion prone sites in order to reduce the amount of sediment entering waterways.
Council staff offer advice and promote good land management practices to landowners. This is frequently done in conjunction with community groups focussed on water quality and may take the form of running farm workshops on flagship sites, provision of water quality improvement plans to landowners or providing technical support.
On-going monitoring
Long-term monitoring programmes provide valuable information about how environmental conditions at different sites change over time. The larger the data set, the more confidence we can have in any trends identified in the data.
Any trends that are identified can then be analysed in relation to weather data or changes in human activity and land-use in the surrounding catchment. This can help us to identify what is causing the change, positive or negative, and whether or not we can do anything about it. The on-going monitoring therefore helps to tell us if the methods and rules in the Regional Policy Statement and regional plans are effective.
Resource consents
As well as state of the environment monitoring, the council also monitors resource consents, such as discharges to coastal waters including municipal wastewater and stormwater discharges, or when investigating environmental incidents. By monitoring these, the council can assess the effect of specific activities on water quality of the receiving environment and take appropriate action if any undesirable effects are identified.
Faecal source tracking
Five coastal recreational swimming water sites identified as having water quality occasionally unsuitable for swimming have been investigated by the council in order to identify the source of bacterial contamination at these sites. Faecal source tracking work has been undertaken on samples collected from these sites to identify which animal/s the faecal contamination has come from.
Results from this work to date have shown that, out of five coastal sites investigated, four are contaminated with bird faecal matter, one with human and two with herbivore (for example, cows, sheep, etc.) faecal matter.
Once this information has been collected, the council can take action to reduce contamination at these sites, for example, by encouraging landowners to fence livestock out of water bodies or by working with people to fix their septic tank systems. However, in the case of wild animal contamination, little can be done other than erecting permanent warning signs to inform the public about the source of the contamination and the health risks of swimming at these sites.
How are we measuring up against our objectives?
The following are anticipated environmental results listed in the operative Regional Policy Statement:
Water quality suitable for desired purpose
• Only Whāngārei Harbour and the Bay of Islands have been designated for desired purpose. In Whāngārei Harbour, the water quality in areas classified for contact recreation was unsuitable for the desired purpose at some sites according to the council's monitoring results. In areas classified as General Quality Standard (a more stringent standard than contact recreation) concentrations of faecal coliforms and dissolved oxygen were at levels that were suitable for the desired purpose according to council monitoring. However, the concentrations of dissolved reactive phosphorus and ammonia were not at levels suitable for the desired purpose.
• In the Bay of Islands, the water quality in areas classified for contact recreation was suitable for the desired purpose. In areas classified for General Quality Standard the concentrations of dissolved oxygen and dissolved reactive phosphorus were at levels that were suitable for the desired purpose. However, the concentrations of faecal coliforms and ammonia were not at levels suitable for the desired purpose.
Contaminants in water bodies reduced
• Analysis of water quality data collected from the Bay of Islands between 2008 and 2011 found that faecal coliforms and ammonia decreased at two sites and that dissolved reactive phosphorus decreased at seven sites. An increase in turbidity at Doves Bay was the only negative trend. However, it should be noted that there is limited data available for trend analysis, because the monitoring programme has only been in place for three years, so the results presented earlier in this section need to be treated with caution.
• In Whāngārei Harbour, trend analysis found decreasing trends for ammonia and faecal indicator bacteria at two sites and a decrease in total phosphorus at one site. Negative trends for bacteria and turbidity were found at two sites. However, it should be noted that there is limited data available for trend analysis of some parameters including nutrients, because these parameters have only been monitored for three years, so the results presented earlier in this section need to be treated with caution.
The adverse effects of contaminants in water bodies and coastal waters be avoided, remedied or mitigated
• Consented discharges to the coastal marine environment have consent conditions relating to effluent quality and all consented discharges are monitored for compliance with their consent conditions.
• In Northland a lot of contaminants enter water bodies and coastal waters from diffuse sources rather than point source discharges. Such diffuse sources of contaminants including runoff from urban land and forestry are much harder to monitor and manage.
· The council works with landowners and community groups to reduce contaminants from diffuse sources by encouraging fencing and restoration of wetlands, fencing stock out of waterways and the coastal marine area, developing plans to stabilise erosion prone land and by helping farmers develop farm plans.
• The Proposed Regional Policy Statement for Northland directs the council to amend its regional plans so that they better manage diffuse source contaminations. Amendments include enhanced controls on access of livestock to the beds and margins of water bodies and requirements for the use of good management practices in primary production activities.
Improved aquatic habitat
• Stock access to and use of the coastal marine area can impact on the health and water quality of our harbours, estuaries and coastline. Animals below the tide line browse estuarine plants, crush shellfish, and drop their dung and urine in areas where fish breed and people collect seafood.
• As at 1 July 2009, under the rules of the Regional Coastal Plan for Northland, access to and use of the coastal marine area by stock became a prohibited activity in areas where stock have access to the area. Landowners are now required to put in place some form of fencing or other barrier to keep stock out of the coast.
• The Northland Regional Council, through its Environment Fund, has provided financial assistance to landowners to fence their property to protect the coastal marine area from stock. In the 2011-2012 year, $32,800 of funding was allocated to landowners and was used to assist with the cost of fencing 14km of coast. These projects may be funded at between 33% and 50% of the total cost of fencing, depending on the ecological values present.