17.2 What are the pressures and state of transportation in Northland?
This chapter on transportation differs slightly from other chapters in this State of the Environment Report, in that obviously transportation is not an environment like air, land and coastal but is a potential pressure on our environment. Therefore it is clearer to present the pressures and state of transportation together in this section.
Northland transport network
The present transportation network in the Northland Region comprises 6,530 kilometres of road, a rail link from Auckland via Whangarei to Otiria, natural deepwater port at Marsden Point and commercial airports at Whangarei, Kerikeri and Kaitaia. Northland's transport system is primarily dependent on its roading network.
Roads
Of the 6,530 kilometres of road in Northland, 753 kilometres are State Highway with the remaining being local roads (NRC 2006). Approximately 65% of these local roads are unsealed, compared to the national average of 40%. The proportion of unsealed roads, many of which have poor foundation conditions and alignments, is one of the highest in the country. Northland's roads are both narrow and winding in nature and are invariably bordered by drainage ditches. The roads are administered by Transit New Zealand (State Highways) and the district councils (local roads).
Rail
The present rail line extends from Auckland via Whangarei to Otiria with a link from Whangarei to Dargaville. This line has both speed restrictions and low tunnels which limits the size of containers that can be conveyed. In addition, there is no link from this line through to the Marsden Point Deep Water Port, although a proposal is underway (see the "What is being done?" section for more information). Product is conveyed in predominantly containerised freight and as raw timber product.
Public transport services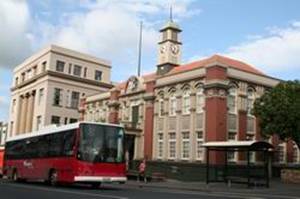
The public passenger transport system in Northland comprises bus, taxi and ferry services. All commercial services available to the general public are required to be registered with the Regional Council under the Transport Services Licensing Act 1989. The Council is responsible for monitoring the levels of services provided and deciding whether they are appropriate for the needs of people in the region.
Currently there is only one contracted public transport service in Northland: the City of Whangarei Bus Service. In addition, there are numerous school bus routes that also service large areas of Whangarei City and the region.
Shipping
There is one large port at Marsden Point which deals predominantly with raw timber product. There is provision at Marsden Point for vessels delivering crude oil to the refinery. There are also facilities at Portland for the conveyance of Golden Bay Cement products. The existing port facilities at Whangarei Port have been closed and the channel that serviced this port is no longer dredged.
Air travel
There are three commercial airports in Northland. These are situated at Whangarei, Kerikeri and Kaitaia. Due to the short length of the runways provided, these airports are restricted to small commercial aircraft only.
Walking and cycling
Walking and cycling has huge potential as a mode of transport in the Northland Region for both recreation and commuter trips and is the most environmentally friendly form of travel. However, walking and cycling to work has steadily declined, halving in the 15 years between 1986 and 2001. In 2001, 6.3% of Northland residents walked or cycled to work compared to 14.7% in 1986. In addition, very few Northland children cycle to school on a regular basis. A number of issues have been identified for cycling such as narrow carriageways, little or no road shoulders, and the number of heavy vehicles (freight transport).
For more information on getting around in Northland check out the following link on the Regional Council website:
http://www.nrc.govt.nz/Transport/Getting-around/
Limitations to transport network development
There are several challenges limiting the development of transport infrastructure in Northland, including:
· Low funding and rating base, and diverse socio-economic patterns within the region. For example, high growth in the south and on the east coast (as a result of Auckland's growth) compared to the far north and west coast which are more remote and sparsely settled with slower population growth.
· Low and geographically dispersed population base and lack of access to transport alternatives, and therefore high dependency on private vehicle use
· A strong rural based and manufacturing economy comprising pastoral farming, forestry, fishing and tourism, which is all reliant on heavy commercial vehicles.
· The influx of visitors in summer. The Northland region continues to be a favourable holiday destination with significant coastal development and traffic congestion at weekends and holiday periods.
As a result of this, there is currently an increase in pressure on the population and the environment caused by transportation.
Pressures on the environment
There are currently several pressures on Northland's environment caused by transportation.
Public health and air quality
Whilst Northland's air quality is generally good due to prevailing winds that disperse pollutants, there are some effects on human health and the environment caused by dust from unsealed roads and vehicle emissions. Current air quality monitoring includes deposited particulate matter (PM10) from a variety of sources, including combustion and unsealed roads. In March 2000 a PM10 high volume sampler was installed in Robert Street, Whangarei. The lack of a strong seasonal influence in the results suggests that material sourced at Robert Street is mainly from motor vehicles. PM10 concentrations at this site are acceptable approximately 74% of the time. The particulate monitoring, with sites at Robert Street and Whangarei Airport, suggests that dust nuisance is a localised problem. Approximately 50% of the inhaleable particulates in Whangarei are sourced from vehicles.
Investigations into vehicle emission levels in suburban and central Whangarei in 1994 showed that suburban Whangarei was within the Ministry for the Environment's air quality guidelines for carbon monoxide, nitrogen dioxide, PM10, and lead. However, the central city exceeded carbon monoxide levels for 5% of the monitoring period, with the results correlating well with traffic density.
Approximately 104 kilograms/day of PM10 and 8.6 tonnes/day of carbon monoxide are emitted from motor vehicles in the Whangarei Air Shed, as shown in table 1 (below), which includes the city centre and urban area of Whangarei (Wilton 2007). Earlier results estimated daily carbon monoxide emissions for the entire Northland region of 41.6 tonnes/day, of which about half (21.8 tonnes) originated from Whangarei district and about 17% (6.9 tonnes) originated from the Whangarei Air Shed (Baynham 2002).
Table 1: Estimated total daily vehicle emissions in Whangarei Air shed based on 2002 data (Source: Wilton 2007) and in turn the daily vehicle emissions per hectare.
| Daily vehicle emissions | Daily vehicle emissions/Ha | |
| PM10 | 104 kg | 13 g |
| CO | 8.63 t | 1071 g |
| NOx | 1.36 t | 169 g |
| SOx | 184 kg | 23 g |
| VOC | 1.36 t | 169 g |
| CO2 | 314 t | 39 kg |
Further investigation in 2000 suggests that the World Health Organisation's short-term exposure limits for carbon monoxide are unlikely to be significantly exceeded but the longer averaging periods, such as the eight-hour guideline, are more likely to be exceeded.
Dust from gravel roads is also a significant air quality issue, particularly during the dry period beginning in November and continuing through to March. Dust nuisance is linked to a perceived increase in respiratory illness and asthma. Road dust also has a considerable nuisance element especially for houses, schools, community and recreation facilities, and crops situated close to the road. Dust can affect the quality of tank water supplies. While dust suppressants can be used to control this problem, sealing is the preferred option.
For more information on the effects of vehicle emissions and the state of air quality in Northland refer to the air quality chapter.
Road run off and water quality
Surface water quality in Northland is a major issue, impacted by forest clearance, wetland drainage, pastoral farming and industrial and stormwater discharges. Vehicle emissions and pollutants in stormwater run-off from sealed areas, including roads and carparks, and unsealed roads along with adverse effects caused by bridges and culverts, all contribute to the contamination of water.
Stormwater run-off can contain a variety of contaminants including heavy metals, silt, oil, spilled stock effluent and other hazardous substances and pollutants. Many of the region's roads are affected by effluent spilled from stock trucks or left by stock crossing roads. Effluent illegally discharged from campervans can also affect water bodies. Northland's high percentage of unsealed roads have associated high run-off sedimentation issues which impacts on water quality. The severity of these effects is obviously dependant on the pressure placed on the infrastructure.
For more information on the effects of stormwater pollution and the state of water quality in Northland refer to the surface water quality chapter.
Environmentally sensitive areas
The environmental effects of the land transport network are greatly increased at environmentally sensitive sites. These effects are potentially most severe in previously undisturbed wilderness areas and can affect coastal processes, historic and natural heritage sites and landscape, ecological and habitat values.
Modification of the coastal environment for land transportation purposes can cause stormwater runoff, loss of habitat, erosion and adverse landscape effects. Coastal protection or reclamation works may be required and these can affect coastal processes, tidal estuaries and their aquatic habitats. The potential impact of climate change and sea level rise on the land transport network, particularly changes in the frequency and intensity of rainfall, storms and tropical cyclones, should also be taken into account.
Several of the major beaches in the region, including Ninety Mile Beach and the stretch of beach between Baylys Beach and Pouto Point have road access. There are effects from vehicle use on these beaches particularly to the dune land areas, shellfish and other wildlife. In addition, fore dune environments have been affected from growth in coastal area development in the region.
For more information on the effects of vehicles on beaches and coast care initiatives refer to the coastal management chapter.
Northland's land transport network extends to or passes through a number of natural areas that have important conservation and landscape values, such as Waipoua Forest. Careful attention needs to be given to the effects of new road and rail works on natural areas including:
· Removal or alteration of vegetation with a subsequent loss of habitat;
· Introduction of noxious weeds and predators to natural habitats;
· Changes to natural drainage patterns and wetland systems;
· Creation of a physical barrier to the movement of some wildlife;
· Effects on wildlife from the noise, lights and movements of traffic.
The construction, maintenance and operation of the land transport network can have adverse affects on historic buildings and sites. Historic buildings, sites and areas are offered varying levels of protection according to their importance under the Historic Places Act 1993 and the Far North, Kaipara and Whangarei District Plans. The land transport network can also have adverse effects on culturally sensitive areas, including waahi tapu, urupa and coastal areas. Northland has one of the highest density of archaeological sites in New Zealand.
For more information on culturally sensitive areas and archaeological sites in Northland refer to the tangata whenua chapter.
Spread of pests and litter
 The effects to the environment from the spread of roadside pests, weeds and litter should also be considered. The incidence of illegal dumping (vehicles and white-ware) has declined over recent years, although is still an issue in some parts of Northland. Roadside litter is still common.
Private versus public transport
Private vehicle use
Private vehicle is the predominant form of transport utilised by Northlanders, due to a limited public transport system and the expansive nature of the region. Approximately 87% of the region's households have access to at least one motor vehicle (Statistics NZ 2006), which is slightly lower than the national figure of 88% of households, as shown in table 2 (below).
Table 2: Number of vehicles that a household has access to as a percentage of the number of households surveyed in the three Northland Districts, Northland region and New Zealand (Statistics NZ 2006).
| Far North | Whangarei | Kaipara | Northland | NZ | |
| No vehicle | 6.8 | 7.4 | 5.9 | 7.0 | 7.8 |
| One vehicle | 37.5 | 36.7 | 38.0 | 37.2 | 36.3 |
| Two vehicles | 35.0 | 36.6 | 36.4 | 36.0 | 36.6 |
| Three or more | 12.5 | 14.1 | 14.6 | 13.6 | 15.3 |
| Not stated | 8.3 | 5.2 | 5.1 | 6.3 | 4.1 |
| No. of households | 19953 | 27621 | 6882 | 54456 | 1454178 |
Mode of transport on census day
Just over half of the people surveyed in Northland (53.9%) drove a private or company vehicle to work on the day of the 2006 census, which is only slightly higher than the national figure of 52.7%, as shown in table 3 (below).
However the concerning figures for Northland are the much lower percentages of people using public transport or walking/cycling to work. Only 0.3% of Northlanders used public transport to get to work, compared to 3.6% of New Zealanders. This is mostly due to limited public transport in Northland. Slightly less Northlanders (5.3%) cycled or walked to work compared to nationally (6.5%). This could partly be contributed to the rural nature of the Northland population and therefore the large distance between most Northlander's place of residence and work. This shows in the high percentage of Northlanders that work from home, particularly in Far North and Kaipara Districts.
Table 3: How people1 got to work on the day of the 2006 census as a percentage of the number of people surveyed in the three Northland Districts, Northland region and New Zealand (Statistics NZ 2006).
| Far North | Whangarei | Kaipara | Northland | Total NZ | |
| Worked at home | 15.0 | 9.2 | 20.0 | 12.7 | 7.4 |
| Did not go to work today | 9.7 | 10.6 | 9.6 | 10.1 | 9.2 |
| Drove a private vehicle | 40.8 | 46.7 | 37.2 | 43.4 | 43.1 |
| Drove a company vehicle | 9.7 | 11.6 | 8.6 | 10.5 | 9.6 |
| Passenger in a private/company vehicle | 4.0 | 4.8 | 3.7 | 4.4 | 4.1 |
| Public bus or train | 0.2 | 0.4 | 0.1 | 0.3 | 3.6 |
| Motor cycle or power cycle | 0.9 | 0.9 | 2.8 | 1.1 | 0.9 |
| Bicycle, walk or jog | 5.6 | 5.1 | 5.5 | 5.3 | 6.5 |
| Other | 0.6 | 0.4 | 0.4 | 0.5 | 0.7 |
| Not Stated | 7.6 | 4.8 | 6.4 | 6.0 | 4.8 |
| Total | 24003 | 35367 | 8859 | 68250 | 2208513 |
1. All figures are for the employed census usually resident population count aged 15 years and over.
Public transport
The City of Whangarei Bus Service is the only contracted public passenger transport service currently operating in the Northland region. This service is subsidised by both the Whangarei District Council and Land Transport New Zealand. Introduced in June 2000, it aims to reduce the number of private vehicles on the road. The number of people using the buses since 2000 has steadily increased, from approximately 80,000 in its first year of operation to approximately 238,000 in the 2006/07 financial year, as shown in figure 1 (below).
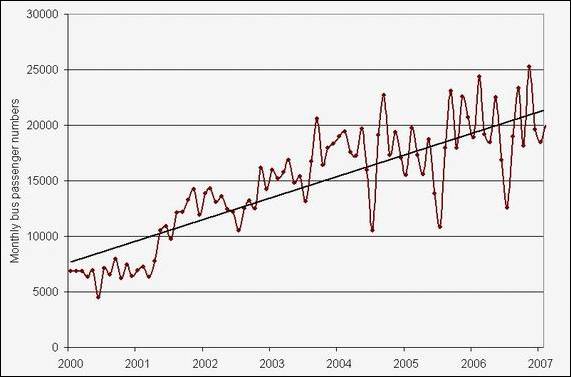
Figure 1: Monthly bus passenger numbers for Whangarei from July 2000 to June 2007
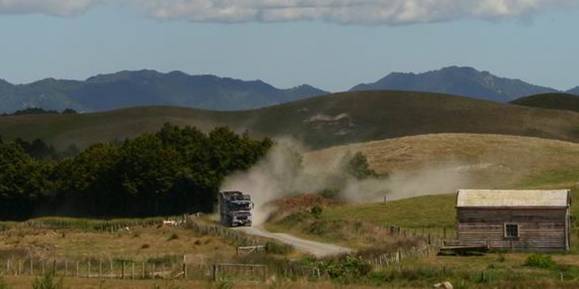
Heavy traffic movements
The Heavy Traffic Volumes report for Northland first produced in 2001 was updated in 2006. The key findings of the 2006 report are:
· On average there are 600 heavy traffic movements per day between Auckland and Whangarei (1,200 counting both directions), while there is approximately 2,500 truck movements per day in and around Whangarei, as shown in figure 2 (below).
· There have been several changes to heavy traffic movements since the 2001 report, including significant increases in the number of heavy vehicles on Northland roads for a number of reasons. These are discussed below in the ‘Changes to transportation in Northland' section.
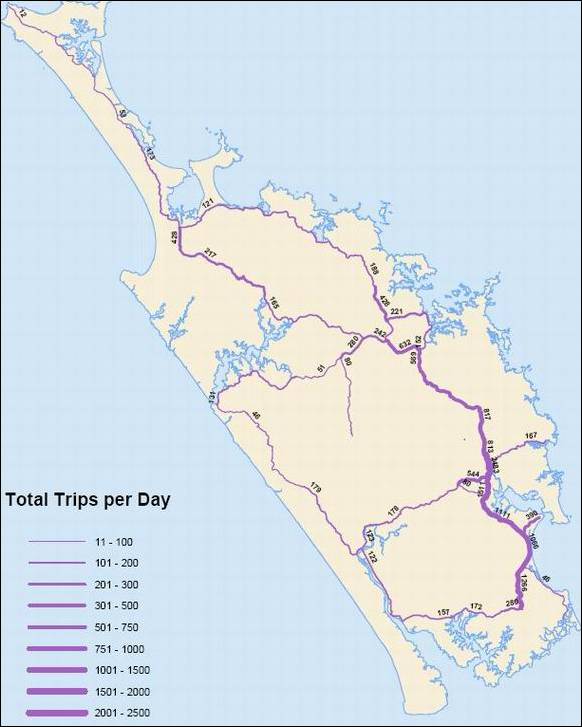
Figure 2: Total heavy traffic movements per day for Northland (NRC 2006).
Changes to transportation in Northland
The present condition of Northland's transport infrastructure is such that it is unable to effectively cope with the demand placed on it at present, let alone the pressure that will be created by the increased use of heavy vehicles in the region and increased traffic volumes.
Traffic volumes
Traffic volumes in the region are increasing with annual increases of two to five percent being recorded on State Highways and with an estimated Annual Daily Traffic (ADT) growth of up to 5.7% on SH1 south of Whangarei, as shown in table 4 (below). Heavy vehicle traffic numbers on most roads are high, ranging from nine to 25% of all traffic and with an estimated heavy commercial vehicle growth of 13.6% on SH1 south of Whangarei.
Table 4: Indicative traffic volume growth for key sites in the Northland region for both Annual Daily Traffic (ADT) and Heavy Commercial Vehicles (HCV). Source: Road Assessment and Maintenance Management (RAMM )database
| Site | Years of data | ADT growth (%) | HCV growth (%) |
| SH1N – RS00 North of Te hapua | 1993 – 2005 | 3.6 | 9.6 |
| SH10 – RS17 South of Takou Bay | 1994 - 2004 | 3.4 | 5.9 |
| SH14 – RS000 East of Te Mai Rd | 1999 – 2005 | 0.5 | 8.3 |
| SH1N – RS273 East of Waipapa bridge | 1999 - 2003 | 5.7 | 13.6 |
In 2004 a significant change in freight traffic occurred with the closure of Port Whangarei and the use of the new Marsden Point Port. The new port at Marsden Point is not connected to the rail network, which has resulted in traffic increases on SH1N south of Whangarei.
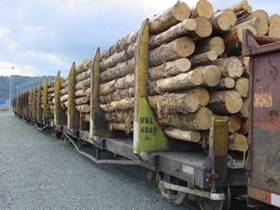 Pulp log exports were 900,000 tonnes out of Port Whangarei in 2003 with a significant portion delivered by rail. Woodchip is currently delivered by road from the chip mill at Portland to Marsden Point Port with 200,000 tonnes per year. Now that Marsden Point is fully functioning and Port Whangarei is being phased out, approximately 430,000 tonnes of bulk materials annually are road transported to Whangarei, often in short, peak durations. This has placed the rail network at some risk of closure. The discontinuation of the existing rail system would result in a significant impact on the road network with an estimated 86 truck trips on SH1N south of Whangarei per day, equating to a 14% increase. Whilst the State Highway would most likely cope with this increase, there would be adverse implications at key intersections with the State Highway network (NRC 2006).
There is also a marked increase in the number of motorcycles, quad bikes and four wheel drive vehicles using the beaches of Northland for recreation purposes. Much of this activity takes place within sand dune areas and is resulting in increased environmental damage and danger to local wildlife. For more information on vehicle on beaches check out the coastal management chapter.
The anticipated increase in logging truck movements has not happened yet due to poor market conditions. However it is likely at some stage in the future that logging volumes will reach the predicted 3 or 4 million tonnes per annum when market conditions allow harvesting. There has also been an expansion in timber processing, which has the potential to increase heavy traffic volumes overall by three times. For example, TDC Sawmills is shifting from 200,000 m3 to 400,000 m3 sawn timber per year.
Another change in heavy traffic volumes on SH1 from Whangarei to Auckland is as a result of the closure of Pohe Island landfill in Whangarei, which means the majority of solid waste for the Northland region is now trucked to Auckland. There are currently six or seven truck loads of solid waste a day for six days of the week from the Resort Resource Recovery Park in Rewarewa Road, Whangarei, to Redvale Landfill in Auckland (Pers. Comm. John Langsford, WDC). This includes the vegetation for composting which is trucked to living earth in Auckland.
In addition to the increase in heavy vehicles on the roads of Northland, there is a burgeoning tourist industry. The majority of these tourists travel by road. This increase further exacerbates the adverse effects to the environment.
Private vehicle ownership
Over the last 10 years there has been a slight decrease in the percentage of Northland households that do not have access to a vehicle and those that have access to one vehicle, while there has been a slight increase in the number of households that have access to two vehicles and three or more vehicles, as shown in figure 3 (below).
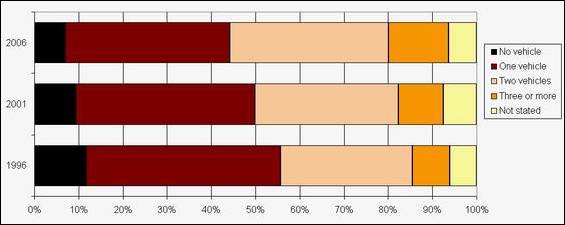
Figure 3: The number of vehicles Northland households have access to, as a percentage of the number of households surveyed for 1996, 2001 and 2006 (NZ Statistics census data).
Mode of transport on census day
How Northlanders got to work on census day in 1996, 2001 and 2006 is shown in figure 3 (below). There has been a slight decrease in the number of people working from home and the number of people that cycled or walked, while there has been a slight increase in the number of people that drove a private or company vehicle.
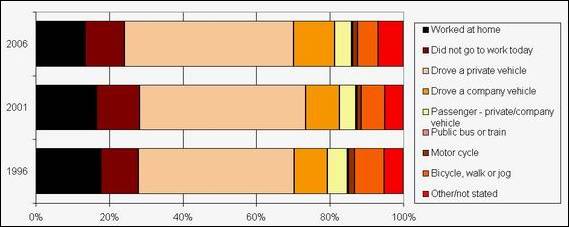
Figure 4: How people got to work on census day, as a percentage of the number of people surveyed for 1996, 2001 and 2006 (NZ Statistics census data).