10.8 Case study 2: Awanui River flood management scheme
Background
The Mangamuka range has 20,000ha of catchment that drains towards Kaitaia through three rivers: Takahue, Victoria and Fairburn. These three rivers join to form the Awanui River, which flows through Kaitaia and then Awanui, before discharging into the Rangaunu Harbour. Along the way, the Awanui River drains an additional 14,000ha of hill country and floodplain. A further 6000ha of catchment in the flood management scheme discharges into the Rangaunu through the Waipapakauri Cut or the Paeratahi Stream.
Operation
The successful operation of the scheme relies on two flow diversion points from the Awanui River, an overflow point across State Highway One at Larmer Rd, and the Whangatane Spillway, towards the northern end of Kaitaia. In large events, as little as a third of the original flow remains in the Awanui River after these flow diversions.
The operation of these overflow points has wider implications: The upper Whangatane channel bisects several dairy farms and can isolate herds from dairy sheds and there are no straightforward detours available once State Highway One becomes impassable. In addition, during larger events, the Awanui River will overtop its stopbanks, particularly on some reaches between Kaitaia and the Awanui township.
Management
Responsibility for the scheme passed from the Far North District Council to the Northland Regional Council (NRC) in July 2005. Since then, significant channel works have been undertaken to increase the capacity of the scheme, hydraulic modelling of the scheme has commenced, and the NRC hydrology team has been engaged to improve the ability of the council to monitor, log, and provide warning for events affecting the scheme.
Monitoring equipment and data capture
 Three rain gauges were already installed to observe rainfall in the ranges near the upper catchment of the Awanui. An additional NIWA rain gauge in Kaitaia provides urban rainfall information. Together, these gauges provide the first indication of how severe an event might be in the Awanui catchment.
Water level gauges have also been installed into each of the three upper rivers. These gauges indicate how the catchments have responded to rainfall, which can vary widely depending on the antecedent conditions. Based on long experience, the hydrology team can use these gauges to estimate what the water level will be through Kaitaia, some 12 hours before it gets there.
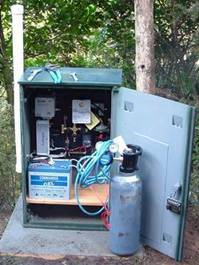
Water level recorder instrumentation on Victoria River including gas purge system, pressure transducer and data logger with cellular phone communications to Whangarei (right).
The flows through urban Kaitaia are monitored on the Awanui River, Tarawhataroa, and Whangatane Spillway. As flows peak and levels become critical, this data provides real-time feedback of how the scheme is performing.
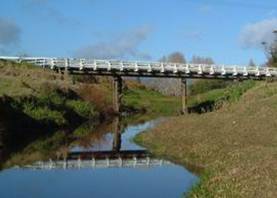
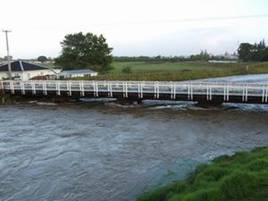
Whangatane Spillway in normal flow conditions (left) and flood conditions (right)
In addition to these gauges, which can all be monitored in real time from Whangarei, Council hydrology staff members also carry out high flow river gaugings. This requires a team in the field to measure water flows through a river cross section. For the urban gauges with established rating curves, this provides a check for changes in the channel capacity against the previous gaugings. For the level gauges in the upper catchment, these gaugings are still needed, to provide a rating curve to convert level information into flow rates. These recent purchase of an ADCP gauging system has the potential to reduce the time to complete a river gauging from over an hour to around 30 minutes.
The last gauge is located near the mouth of the Awanui River and provides tide level information, indicating the degree of storm surge occurring from the wind fetch and barometric pressure changes. The performance of the lower reaches of the scheme depends on the prevailing tide conditions.
A schematic map of the Awanui River Flood Management Scheme is presented in Appendix E.
Long-term value
The main application for this data has been focused on real-time monitoring of individual events. In the future, this data will also provide a valuable tool for understanding the way the catchments respond to rainfall and an insight into the long-term effects of any changes to land use or scheme developments.
As most of the gauges have only been installed for a few years, the data record is currently too brief for this application. In addition, ratings need to be developed for the upper catchment gauges so that flows, rather than just levels, can be estimated. Over time, it is expected that the big picture understanding provided by this monitoring programme will become just as important as the hazard management it currently assists with.
Overview
The flood management scheme has been developed over some 60 years. Early works in the 1900s focused on bringing land near the harbour into production by preventing tidal flooding by salt water. Stopbanks and floodgates gradually extended upstream to provide flood management for more productive floodplain land. The flood of 1958, which flowed through urban Kaitaia, prompted a comprehensive upgrade to the scheme. Stopbanks were constructed around Kaitaia and the Whangatane Spillway was enlarged. Large areas of highly productive land and the main service centre for the Far North now benefit from a significant level of reduction to the flood hazard present on the Awanui River flood plain.
More information on the scheme is available in the Awanui River Flood Management Plan available on the Regional Council website at the following link: