River Water Quality Monitoring Network
Within this section…
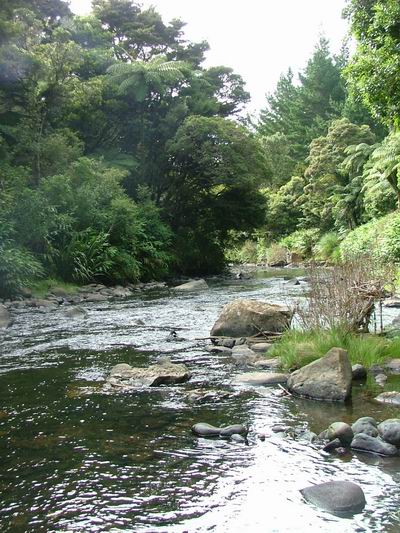
Water quality monitoring of rivers and streams is undertaken at 35 sites throughout Northland as part of the state of the environment monitoring network. Four of these sites are monitored by the National Institute of Water and Atmospheric Research (NIWA). The network covers a large geographic range and is representative of stream types in Northland to give us a good understanding of the state of the environment for the region as a whole.
Water quality is monitored monthly for a range of properties such as bacteria and nutrients. Results are compared to environmental guidelines for bathing safety – Microbial Water Quality Guidelines for Marine and Freshwater Recreational areas (Ministry for the Environment, Ministry of Health 2002), and aquatic ecosystem protection – The Australian and New Zealand Guidelines for Fresh and Marine Water quality (ANZECC 2000).
In 2010-2011, most sites had moderate to good performance compared to 2009-2010 results. For more information visit www.nrc.govt.nz/amr
Water clarity
Water clarity measures how clear or cloudy the water is. Poor water clarity means rivers are less suitable for swimming and it can also impact on river ecosystems by reducing visibility for predators – e.g. wading birds or fish – and by reducing the light available for aquatic plants. Poor water clarity can indicate there are high amounts of sediments in the water, which settle to the stream bed and can smother important habitat or irritate the gills of invertebrates and fish. The water clarity guideline value for ecosystem protection is that it should be greater than 0.6 meters visibility. Prolific weed and algal growth can also affect water clarity.
When compared to the previous year's data, water clarity improved at 17 sites and declined at 11 sites. Poorer clarity can be seen in highly erodible catchments – e.g. Utakura, Ruakaka and Paparoa rivers – and generally in response to heavy rainfall. Long-term trends show that there are improving trends for water clarity at 29 percent of sites with more than five year's data.
E.coli bacteria
Low levels of bacteria are present in freshwater bodies as a result of natural processes, such as plant decay. However, land-use practices and human activity can increase the levels of bacteria in freshwater bodies.
Improvements in bacteriological water quality were seen at 18 sites, when compared to the previous year's data. During 2010-2011, faecal source tracking investigations were undertaken at five sites where there were consistently high bacteria levels in order to try and isolate the source(s) of contamination. Initial results indicate that the main source of contamination is from herbivores.
One site (Mangahahuru River) showed the source of contamination to be avian however the profile was not consistent with ducks (a common avian source). Where faecal contamination is found to be from natural sources – i.e. from birds – little can be done to solve the problem. Where the source of contamination is non-avian, council staff liaise with landowners to discuss and implement land management options and ultimately reduce contamination. Further monitoring will continue in 2011-2012.
|
Site |
Herbivore |
Avian |
|
Kaihū River |
Yes |
|
|
Mangamuka River |
Yes |
|
|
Mangahahuru Stream |
|
Yes (not duck) |
|
Waimamaku River |
Yes |
|
|
Kaeo River |
Yes |
|
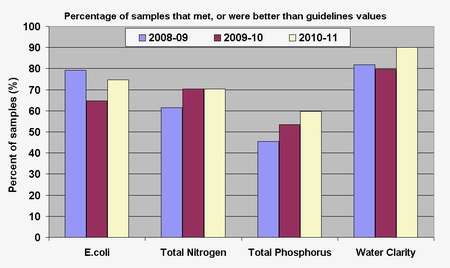
Figure 1: percentage of samples that met, or were better than guideline values.
Nutrients
Nitrogen and phosphorus are needed by aquatic plants and algae for growth and occur naturally in water bodies. Man-made sources of nutrients include fertiliser runoff, urine from farm animals and treated wastewater discharges.
If too much nitrogen or phosphorus enters our rivers it can result in pollution, which can lead to extensive algal growths, and in turn impact on the aquatic ecosystem. The recommended guideline for protection of aquatic ecosystems is that the total nitrogen concentration should remain below 0.614mg/L, and phosphorus concentration should remain below 0.033mg/L. This value is a trigger for further investigation. Values above this level may not pose any threat to aquatic ecosystems as some catchments naturally have levels above this trigger.
When compared to the previous year's data notable improvements in total nitrogen were observed at 12 sites. Long-term trends show that total nitrogen has improved at 18 percent of sites with more than five year's data.
Most sites showed moderate performance in comparison to the total phosphorus guidelines for protection of aquatic ecosystems. This is partly due to Northland's phosphorus-rich sandstone and mudstone catchment geology which provides a naturally high background level of phosphorus to streams.
When compared to previous year's data notable improvements in total phosphorus were observed at 17 sites. Long-term trends show improving trends for total phosphorus at 65% of sites with more than five year's data.