River water quality monitoring network
Within this section…
Water quality monitoring of rivers and streams is undertaken at 35 sites throughout Northland as part of the state of the environment monitoring network. Four of these sites are monitored by the National Institute of Water and Atmospheric Research (NIWA). The monitoring network covers a large geographic range and is representative of stream types in Northland to give us a good understanding of the state of the environment for the region as a whole.
Water quality is monitored monthly for a range of properties such as bacteria and nutrients. Results are assessed for compliance with environmental guidelines for bathing safety – ‘Microbial Water Quality Guidelines for Marine and Freshwater Recreational areas' (Ministry for the Environment, Ministry of Health 2002), and aquatic ecosystem protection – The Australian and New Zealand Guidelines for Fresh and Marine Water quality (ANZECC 2000).
Water clarity
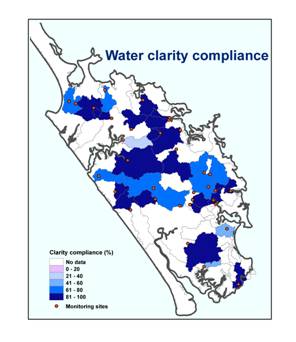
Water clarity measures how clear or cloudy the water is. Poor water clarity compromises the river's suitability for swimming and can also impact on river ecosystems by reducing visibility for predators, e.g. wading birds or fish and by reducing the light available for aquatic plants. Poor water clarity can indicate that there are high amounts of sediments in the water. These sediments settle to the stream bed and can smother important habitat or irritate the gills of invertebrates and fish. The water clarity guideline value for ecosystem protection is that it should be greater than 0.6 meters visibility. Prolific weed and algal growth can also affect water clarity.
In 2009-2010 most sites had good compliance with water clarity guidelines. Poorer clarity is displayed in highly erodible catchments, e.g. Utakura, Ruakaka and Paparoa Rivers. When compared to the previous year's data, notable improvements in water clarity are observed in the Awanui, Victoria, Kaeo and Ruakaka catchments. It is possible that the changes in water clarity could be as a result of the drought in 2009-2010. With less rainfall runoff fewer sediments would have entered the rivers, and low river levels and higher temperatures encourage weed and algal growth.

E.coli bacteria
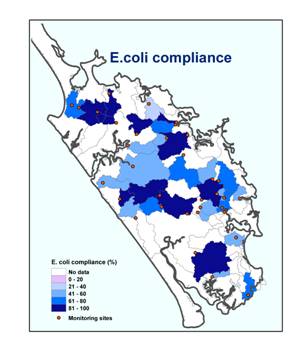
Low levels of bacteria are present in freshwater bodies as a result of natural processes, such as plant decay. However, land-use practices and human activity can increase the levels of bacteria in freshwater bodies. Water that has been contaminated by human or animal faeces may contain a range of disease-causing micro-organisms, such as viruses, bacteria and protozoa. These organisms may pose a health hazard when the water is used for recreational activities. The bathing guideline value for the indicator bacteria E.coli is 550 / 100ml. If concentrations of E.coli are greater than this, it may pose health risks for people swimming in the water.
Most sites had average to good compliance with the water quality guidelines for bathing. When compared to the previous year's data notable declines in bacteriological water quality are observed at most sites. These declines could be due to the drought in 2009-2010. With below average rainfall, river and stream levels became very low compared to normal flows in summer. This allowed water temperatures to be much warmer which encourages bacteria to breed to higher numbers. The low flows of the rivers and streams may have provided less dilution of inputs and could help explain the observed declines in 2009-2010. Further work is being done to determine the source of E.coli in rivers.

Total nitrogen
Nitrogen is needed by aquatic plants and algae for growth and occurs naturally in water bodies. Man made sources of nitrogen include fertiliser runoff, urine from farm animals and treated wastewater discharges.
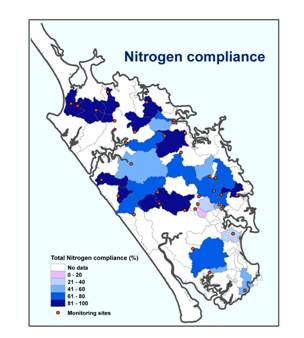
If nitrogen enters our rivers it can result in pollution which can lead to extensive algal growths, which then impact on the aquatic ecosystem. The recommended guideline for protection of aquatic ecosystems is that the total nitrogen concentration should remain below 0.614 mg/L.
Most sites showed good compliance with the total nitrogen guidelines for protection of aquatic ecosystems. When compared to the previous year's data notable improvements in total nitrogen water quality were observed at many sites. It is likely that less rainfall runoff during the drought resulted in fewer nutrients being delivered to the rivers and streams. Also algal growths within the streams would have taken up a lot of the nitrogen. Both of these effects resulted in lower total nitrogen concentrations in the rivers.

Total phosphorus
Phosphorus is also needed by aquatic plants and algae for growth and occurs naturally in water bodies. Man made sources of phosphorus include fertiliser runoff, wastewater discharges and land clearance runoff.
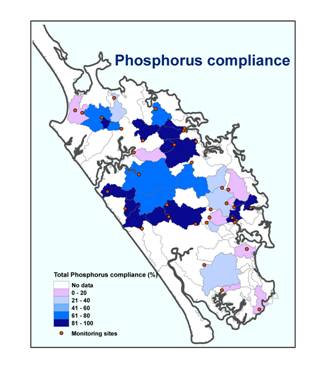
If phosphorus enters our rivers it can result in pollution which can lead to extensive algal growths that can impact on the aquatic ecosystem. The recommended guideline for protection of aquatic ecosystems is that the total phosphorus concentration should remain below 0.033 mg/L.
Most sites show poor compliance with the total phosphorus guidelines for protection of aquatic ecosystems. This is partly due to Northland's phosphorus rich sandstone and mudstone catchment geology which provides a high background level of phosphorus to streams naturally.
When compared to the previous year's data notable improvements in total phosphorus water quality are observed at many sites. Like nitrogen, it is likely that less rainfall runoff during the drought resulted in fewer nutrients being delivered to the rivers and streams. Also algal growths within the streams would have taken up a lot of the phosphorus. Both of these effects resulted in lower total phosphorus concentrations in the rivers.
For more information go to www.nrc.govt.nz/riverdata

