River Water Quality
Within this section…
- River Water Quality Monitoring Network
- River Water Quality Results
- Waipoua River
- Opouteke River
- Mangakahia River at Twin Bridges
- Waipapa River
- Kaihu River
- Mangahahuru Stream at Main Road
- Waimamaku River
- Victoria River
- Waipapa Stream at Kerikeri Inlet
- Kerikeri River, Stone Store Bridge
- Mangamuka River
- Waitangi River at Watea
- Waitangi River at Waimate North
- Waiarohia Stream at Second Ave
- Whakapara River
- Waiarohia Stream at Whau Valley Road
- Waipao Stream, Draffin Road Bridge
- Mangakahia River at Titoki
- Ngunguru River
- Kaeo River
- Punakitere River at Taheke
- Oruru River, Oruru Road
- Waiotu River at SH1
- Awanui River at FNDC water take
- Mangahahuru Stream at Apotu Road
- Waiharakeke River at Stringer Road
- Paparoa Stream
- Hakaru River
- Wairua River at Purua
- Utakura River at Rangiahua Road Bridge
- Awanui River at Waihue Channel
- Mangere River at Knights Road
- Ruakaka River at Flyger Road
- Manganui River at Mitaitai Road
- Trends in Water Quality
River Water Quality Monitoring Network
NRC also undertakes freshwater quality monitoring through the regional River Water Quality Monitoring Network (RWQMN). The network involves the monitoring of water quality and macroinvertebrate biota in an increasing number of rivers around Northland.
In 2007-08, the network included 34 sites spread across the region. These sites are shown on the map below. Four of these sites are part of the National River Water Quality Network, which is monitored by staff from the National Institute of Water and Atmospheric Research (NIWA) (Waipapa River in Puketi Forest, Waitangi River at Watea, Mangakahia River at Titoki and Wairua River at Purua).
Ten new sites were added to the network in 2007-08. These sites are located in river systems not previously monitored on the network, including the Paparoa and Waipao Stream and the Hakaru, Ngunguru, Waipapa, Kerikeri, Utakura, Oruru, Waimamaku and Mangamuka rivers. These rivers were added in order to improve coverage over a range of river types, based on geology, source and land cover/catchment type.
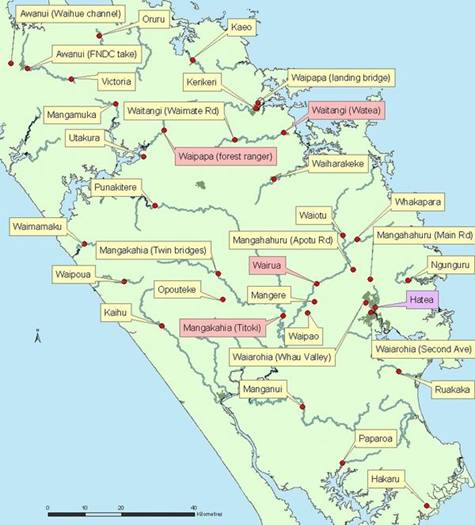
Map: RWQMN Sites in Northland, 2007-08
(Pink = sites monitored by NIWA, Purple = site to be added in 2008-09)
Monthly water quality sampling is carried out at each site in the network and samples are analysed for a range of chemical and physical parameters. These are shown in the table below. The purpose of the network is to provide information about the current state of Northland's rivers, and to look at long-term trends in water quality over time.
Most results are compared to the New Zealand trigger values for the protection of aquatic environments, found in the ‘Australian and New Zealand Guidelines for Fresh and Marine Water Quality' (ANZECC 2000). It is important to note that the trigger values are used to assess the risk of adverse effects on an ecosystem and when results are outside trigger values, further investigation may still be required to determine whether or not this is having an adverse effect on the aquatic environment.
Two sets of trigger values are used by NRC to analyse results; one for upland rivers, which only includes one site in the network (Waipoua River), and one for lowland rivers (as shown in the table below). Levels of the indicator bacteria E. coli are compared to the ‘Microbiological Water Quality Guidelines for Marine and Freshwater Recreational areas' (see the Recreational Bathing Water Quality section above). Dissolved Oxygen is measured against the minimum recommended by the Regional Water and Soil Plan for Northland, which is of 6 mg/L.
| Parameter | Guideline trigger values (NZ lowland rivers) | Guideline trigger values (NZ upland rivers) |
| Temperature (Degrees Celsius) | - | - |
| Dissolved oxygen (mg/L) | > 6* | > 6* |
| Dissolved oxygen (% Saturation) | 98 - 105 | 99 – 103 |
| Conductivity (mSm) | - | - |
| Water clarity (m) | > 0.6 | > 0.8 |
| Turbidity (NTU) | < 5.6 | < 4.1 |
| E. coli (n/100mL) | < 550^ | < 550^ |
| Dissolved reactive phosphorus(mg/L) | < 0.01 | < 0.009 |
| Total phosphorus (mg/L) | < 0.033 | < 0.026 |
| Ammoniacal nitrogen (mg/L) | < 0.021 | < 0.01 |
| Total nitrogen (mg/L) | < 0.614 | < 0.295 |
| pH | 7.2 – 7.8 | 7.3 – 8.0 |
* accepted level of dissolved oxygen (mg/L)
^ E. coli guideline for recreational bathing in freshwater
The results for each river from 2007-08 are detailed in the following sections. Over half of the rivers in the network now have enough data to begin long-term trend analysis. Some of the trends are discussed in more detail later in this report (Trends in Water Quality). In addition, the results from the annual macroinvertebrate monitoring for 2007-08 are discussed in the Macroinvertebrate Monitoring section.
River Water Quality Results
Rivers have been ranked from best to worst using the results from 2007-08 for a range of parameters (i.e. highest to lowest water clarity, or least to most nitrogen).
The order of sites from overall best water quality to worst has changed in the last financial year, partly due to the addition of 10 new sites in 2007-08. Waipoua River was again ranked the best however the Manganui River outranked the Mangere River this year as the worst.
As in previous years, the ranking of sites is linked to catchment land use. The best sites have catchments dominated by native forest, moving through to sites with a mix of forestry, native forest and agriculture. The worst sites have catchments dominated by intensive agricultural land use. Some sites have been shown with equal ranking, as it was difficult to differentiate between them.
Waipoua River
The Waipoua River originates in and flows through Waipoua Forest, on the West Coast of Northland. The river cuts through volcanic soils and has a predominantly native forest catchment. The Waipoua River site is the only site in the network that is classified as "hill elevation" by the ‘River Environment Classification' (NIWA & MfE 2004) and therefore the results have been compared to the trigger values for an upland river. The Waipoua River is the closest to pristine condition of all the rivers in the network.
Results for 2007-08 for the Waipoua River site are summarised in the table below. These include the median, range and percentage of sampling occasions that complied with relevant guidelines for the 12 sampling occasions. An asterisk in the table below denotes a median value outside the recommended guideline.
| Parameter | Median | Range | % compliance with guideline |
| Temperature (deg. cel.) | 13.45 | 10 - 18.1 | - |
| Dissolved oxygen (mg/L) | 10.6 | 7.7 - 11.7 | 100 |
| Dissolved oxygen (% Sat.) | 101.6 | 69.4 - 106.2 | 50 |
| Conductivity (mSm) | 8.0 | 6.1 - 19 | - |
| Water clarity (m) | 2.3 | 1.17 - 2.77 | 100 |
| Turbidity (NTU) | 2.9 | 2 - 8 | 67 |
| E. coli (n/100mL) | 36 | 5 - 789 | 92 |
| Dissolved reactive phosphorus (mg/L) | 0.005 | 0.005 - 0.01 | 67 |
| Total phosphorus (mg/L) | 0.02 | 0.005 - 0.03 | 67 |
| Ammoniacal nitrogen (mg/L) | 0.005 | 0.005 - 0.27 | 92 |
| Total nitrogen (mg/L) | 0.1 | 0.123 - 0.321 | 83 |
| pH | 7.25* | 3.4 - 7.6 | 50 |
The results for 2007-08 show that Waipoua River remains in a relatively pristine condition. The medians of all parameters, except for pH, were within the relevant guideline for an upland river. The median pH of 7.25 is slightly under the range of 7.3 to 8 for an upland river and only complied on 50% of sampling occasions.
However, compliance with guidelines for single samples has been an issue this year, with half of the parameters not complying on four or more sampling occasions. In 2006-07, most parameters met the guidelines on either 11 or 12 sampling occasions.
Trend analysis for this site shows that there is an increasing trend in total phosphorus and dissolved reactive phosphorus, which is of concern. This could be attributed to intensification of farming on the outskirts of the catchment or it could be attributed to an increase in earth movement, such as slips, in the catchment.
Opouteke River
The Opouteke River drains from predominantly exotic forestry (pine forest), through a small area of pasture, before reaching the Mangakahia River. The only pastoral land use upstream of the sampling site is a sheep and beef farm, although dairy farms do occur further downstream. Acidic volcanic rocks make up the underlying geology.
Results for 2007-08 for the Opouteke River are summarised in the table below. These include the median, range and percentage of sampling occasions that complied with relevant guidelines. An asterisk in the table below denotes a median value outside the recommended guideline.
| Parameter | Median | Range | % comply with guideline |
| Temperature (deg. cel.) | 16.6 | 11.2 - 24.1 | - |
| Dissolved oxygen (mg/L) | 10.05 | 7 - 11.9 | 100 |
| Dissolved oxygen (% Sat.) | 107.5* | 64.5 - 114.2 | 8 |
| Conductivity (mSm) | 12.8 | 9.7 - 23.7 | - |
| Water clarity (m) | 2.07 | 0.33 - 3.65 | 83 |
| Turbidity (NTU) | 2.9 | 1 - 40 | 67 |
| E. coli (n/100mL) | 195 | 10 - 1022 | 92 |
| Dissolved reactive phosphorus (mg/L) | 0.005 | 0.005 - 0.01 | 100 |
| Total phosphorus (mg/L) | 0.021 | 0.005 - 0.04 | 92 |
| Ammoniacal nitrogen (mg/L) | 0.01 | 0.005 - 0.1 | 92 |
| Total nitrogen (mg/L) | 0.267 | 0.128 - 0.912 | 92 |
| pH | 8.0* | 7.2 - 8.4 | 50 |
As in previous years, dissolved oxygen concentrations (% saturation) are often elevated in Opouteke River. Median for pH also fell outside the guidelines.
During 2007-08, phosphorus levels met the guidelines on 11 out of 12 sampling occasions. In previous years, they exceeded guideline trigger values on 5 or more occasions. The trend analysis on the 13 years data available for Opouteke River shows that dissolved reactive and total phosphorus levels are decreasing.
Like many of the other sites in the RWQMN, there is a significant increasing trend in pH in Opouteke River (i.e. trend analysis indicates that this site is becoming more alkaline). This could be a detrimental trend at this site, as pH is often above the 7.2 to 7.8 trigger value range.
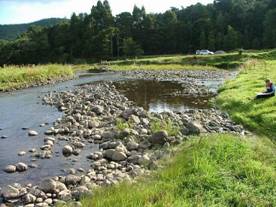
Photo: Opouteke River
Mangakahia River at Twin Bridges
The Mangakahia River originates from Matarua Forest and flows southwest until it reaches the Wairua River. There are two sites on the Mangakahia River in the network; one at Twin Bridges and the other at Titoki Bridge, in the lower reaches. The Twin Bridges lie at the confluence of the Awaroa and Mangakahia Rivers. The sampling site is directly downstream of this confluence. The upstream catchment is a mixture of plantation forestry, and beef and sheep farming, with a acidic, volcanic underlying geology.
Results for 2007-08 for Twin Bridges on the Mangakahia River are summarised in the table below. These include the median, range and percentage of sampling occasions that complied with relevant guidelines. An asterisk in the table below denotes a median value outside the recommended guideline.
| Parameter | Median | Range | % comply with guideline |
| Temperature (deg. cel.) | 16.6 | 11.7 - 24.1 | - |
| Dissolved oxygen (mg/L) | 10.3 | 6.8 - 12 | 100 |
| Dissolved oxygen (% Sat.) | 106.1* | 63.6 - 117 | 25 |
| Conductivity (mSm) | 10.4 | 7.7 - 21.1 | - |
| Water clarity (m) | 1.44 | 0.49 - 3.26 | 83 |
| Turbidity (NTU) | 4.2 | 1 - 42.1 | 58 |
| E. coli (n/100mL) | 185 | 20 - 1782 | 75 |
| Dissolved reactive phosphorus (mg/L) | 0.008 | 0.005 - 0.013 | 83 |
| Total phosphorus (mg/L) | 0.030 | 0.01 - 0.047 | 58 |
| Ammoniacal nitrogen (mg/L) | 0.01 | 0.005 - 0.04 | 92 |
| Total nitrogen (mg/L) | 0.247 | 0.134 - 0.784 | 75 |
| pH | 7.8* | 7.2 - 8.4 | 58 |
Results from 2007-08 show that the two sites on the Mangakahia River had the second highest temperature of all the RWQMN sites. On 16 January 2008, temperature reached 24.1°C (Waiarohia Stream at Second Ave had the highest). It is generally thought that freshwater ecosystems, particularly fish and macroinvertebrate communities, are likely to be detrimentally effected if water temperatures exceed 25°C. It is likely that temperature exceeds this at Twin Bridges at certain times of the day during the summer months.
During 2007-08, phosphorus levels in the Mangakahia River were lower than in previous years. Dissolved reactive phosphorus values met the guidelines on 10 out of 12 sampling occasions compared to three in 2005-06. Trend analysis shows that there is a significant decreasing trend in both dissolved reactive phosphorus and total phosphorus in this river.
The median of dissolved oxygen (percentage saturation), and pH were also above the recommended guideline. The high dissolved oxygen levels occur in summer during lower flows, when photosynthesis rates by plants are greater. There is also an increasing trend in pH at this site.
Waipapa River
The Waipapa River originates in and flows through Puketi forest in central Northland, meandering through farmland until it reaches the upper Hokianga Harbour. The sampling site is in the upper reaches and therefore the catchment above it is predominantly indigenous forest, with some small areas of exotic forest in the headwaters. The geology of the Waipapa River is soft sedimentary (siltstones and mudstones). Similarly to the Waipoua River site, this site is in near pristine condition. The Waipapa site is one of four sites in Northland that are part of the National River Water Quality Network administered by NIWA.
Results from 2007-08 for the Waipapa River are summarised in the table below. These include the median, range and percentage of sampling occasions that complied with relevant guidelines. Note: Dissolved reactive phosphorus and ammoniacal nitrogen results were only available for six sampling occasions (July 2007 – December 2007). An asterisk in the table below denotes a median value outside the recommended guideline.
| Parameter | Median | Range | % comply with guideline |
| Temperature (deg. cel.) | 15.5 | 11.3 - 19.9 | - |
| Dissolved oxygen (mg/L) | 9.6 | 8.4 - 10.8 | 100 |
| Dissolved oxygen (% Sat.) | 96.2* | 93.3 - 97.9 | 0 |
| Conductivity (mSm) | 11.77 | 9.01 - 13.1 | - |
| Water clarity (m) | 1.86 | 0.215 - 3.62 | 83 |
| Turbidity (NTU) | 3.6 | 1.52 - 7.3 | 58 |
| E. coli (n/100mL) | 98.5 | 9.6 - 517.2 | 100 |
| Dissolved reactive phosphorus (mg/L) | 0.006 | 0.004 - 0.007 | 100 |
| Total phosphorus (mg/L) | 0.011 | 0.009 - 0.032 | 100 |
| Ammoniacal nitrogen (mg/L) | 0.003 | 0.002 - 0.004 | 100 |
| Total nitrogen (mg/L) | 0.113 | 0.077 - 0.307 | 100 |
| pH | 7.52 | 7.31 - 7.69 | 100 |
Results for 2007-08 show that the Waipapa River remains in a relatively pristine state. The medians of all parameters, except dissolved oxygen (% saturation) met their relevant guidelines. Seven parameters complied with their respective guidelines on all 12 sampling occasions; dissolved oxygen (mg/L), E. coli, dissolved reactive phosphorus, total phosphorus, ammoniacal nitrogen, total nitrogen and pH.
Long-term trends indicate that nitrate nitrogen, ammoniacal nitrogen, dissolved reactive phosphorus and total phosphorus are declining in this river. However, there are also long term trends indicating that pH is increasing (the water is becoming more alkaline) and conductivity is increasing. It is unknown at this stage whether increasing pH is a positive or negative trend.
Kaihu River
The Kaihu River originates in native forest to the west of Trounson Kauri Park and drains into the Wairoa River in Dargaville. The catchment is a mix of exotic and indigenous forestry, agriculture and horticulture but dairy farming is the predominant land-use. Kaihu River is one of six sites in the network that have volcanic acidic geology.
The results from 2007-08 for the Kaihu River site are summarised in the table below. These include the median, range and percentage of sampling occasions that complied with relevant guidelines. An asterisk in the table below denotes a median value outside the recommended guideline.
| Parameter | Median | Range | % comply with guideline |
| Temperature (deg. cel.) | 14.6 | 11.4 - 20.1 | - |
| Dissolved oxygen (mg/L) | 10.3 | 8.1 - 11.2 | 100 |
| Dissolved oxygen (% Sat.) | 100.7 | 75 - 108.5 | 67 |
| Conductivity (mSm) | 11.4 | 8.8 - 22 | - |
| Water clarity (m) | 1.76 | 0.41 - 3.24 | 92 |
| Turbidity (NTU) | 4.7 | 1 - 41 | 58 |
| E. coli (n/100mL) | 181 | 52 - 6867 | 83 |
| Dissolved reactive phosphorus (mg/L) | 0.01* | 0.005 - 0.02 | 67 |
| Total phosphorus (mg/L) | 0.03 | 0.005 - 0.085 | 75 |
| Ammoniacal nitrogen (mg/L) | 0.01 | 0.005 - 0.42 | 83 |
| Total nitrogen (mg/L) | 0.477 | 0.194 - 1.738 | 67 |
| pH | 7.3 | 6.9 - 7.6 | 75 |
The results from 2007-08 indicated that some water quality parameters were outside of guideline values at this site on some occasions. The median for dissolved reactive phosphorus fell outside of its recommended guideline.
During 2007-08, spikes in E. Coli, nitrogen and phosphorus were associated with increased flow and turbidity. This contamination is most likely the result of run-off from pastoral and/or forestry land use within the catchment during heavy rainfall events.
Trend analysis on five years of water quality data collected for the Kaihu River shows that there is an improving trend in water clarity. Dissolved oxygen (% and mg/l) is decreasing however it is not yet known if decreasing dissolved oxygen is a positive or negative trend.
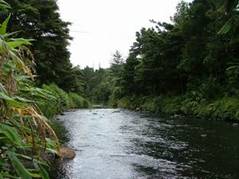
Photo: The Kaihu River sampling site
Mangahahuru Stream at Main Road
The Mangahahuru Stream, which begins in Pinus radiata forest to the southeast of Hikurangi, is a small tributary of the Wairua River. The sampling site is located in the upper catchment and therefore the predominant land use in this area is exotic forestry. The site was added to the RWQMN in 2005-06 as a representative of a river system on hard, sedimentary rock surrounded by exotic forestry. It provides a good comparison to the Mangahahuru Stream site at Apotu Road.
Results from 2007-08 are summarised in the table below. These include the median, range and percentage of sampling occasions that complied with the relevant guidelines. An asterisk in the table below denotes a median value outside the recommended guideline.
| Parameter | Median | Range | % comply with guideline |
| Temperature (deg. cel.) | 14.9 | 10.7 - 18.8 | - |
| Dissolved oxygen (mg/L) | 9.9 | 8.9 - 11.3 | 100 |
| Dissolved oxygen (% Sat.) | 95.7* | 92.1 - 101.8 | 25 |
| Conductivity (mSm) | 9.45 | 7.8 - 29.1 | - |
| Water clarity (m) | 1.15 | 0.39 - 1.77 | 91 |
| Turbidity (NTU) | 5.75* | 4.8 - 39 | 50 |
| E. coli (n/100mL) | 184 | 63 - 2282 | 75 |
| Dissolved reactive phosphorus (mg/L) | 0.01* | 0.01 - 0.06 | 67 |
| Total phosphorus (mg/L) | 0.03 | 0.01 - 0.11 | 58 |
| Ammoniacal nitrogen (mg/L) | 0.005 | 0.005 - 0.04 | 83 |
| Total nitrogen (mg/L) | 0.297 | 0.127 - 0.752 | 92 |
| pH | 7.1 | 6.7 – 7.3 | 17 |
The results from 2007-08 indicate that water quality at the Mangahahuru Stream at Main Road is only slightly impacted with medians of most parameters meeting their respective guideline values.
During 2007-08, nutrient levels were higher than previous years. This is especially apparent for phosphorus. Dissolved reactive and total phosphorus met the guideline values on every sampling occasion in 2005-06, however in 2007-08, both parameters exceeded guideline values on four or more sampling occasions. This may be due to fertiliser application within the forestry blocks.
There is not yet sufficient data to undertake trend analysis for this site.
Waimamaku River
The Waimamaku River begins north of the Waipoua forest and flows west through Waimamaku township, eventually reaching the West Coast south of the Hokianga Harbour. The catchment is dominated by indigenous forest in the upper reaches and is mainly pastoral in the lower catchment. The sampling site is located in the lower reaches of the river, after it passes through Waimamaku.
The results for 2007-08 are summarised in the table below. These include the median, range and percentage of sampling occasions that complied with relevant guidelines. Please note, this site was only sampled on 9 occasions in 2007-08 (sampling began in October 2007). An asterisk in the table below denotes a median value outside the recommended guideline.
| Parameter | Median | Range | % comply with guideline |
| Temperature (deg. cel.) | 16.3 | 11.9 - 23 | - |
| Dissolved oxygen (mg/L) | 9.6 | 7.1 - 10.6 | 100 |
| Dissolved oxygen (% Sat.) | 101.8 | 65.7 - 107.3 | 56 |
| Conductivity (mSm) | 11 | 8 - 21.2 | - |
| Water clarity (m) | 1.9 | 0.66 - 2.95 | 100 |
| Turbidity (NTU) | 2.9 | 1 - 10.7 | 78 |
| E. coli (n/100mL) | 723* | 74 - 2187 | 44 |
| Dissolved reactive phosphorus (mg/L) | 0.01* | 0.005 - 0.03 | 78 |
| Total phosphorus (mg/L) | 0.024 | 0.01 - 0.03 | 100 |
| Ammoniacal nitrogen (mg/L) | 0.005 | 0.005 - 0.06 | 78 |
| Total nitrogen (mg/L) | 0.277 | 0.136 - 0.544 | 100 |
| pH | 7.6 | 7.1 - 8 | 78 |
This results from 2007-08 for the Waimamaku River indicate that water quality is good in this river. The medians for the majority of parameters were within relevant guidelines, except for E. coli and dissolved reactive phosphorus. Bacteria levels (E. coli) were high and exceeded guideline values on 8 out of 9 sampling occasions. Water clarity, dissolved oxygen (mg/L), total nitrogen and phosphorus concentrations met the guidelines on all sampling occasions.
There is not yet sufficient data to undertake trend analysis for this site.
Victoria River
The Victoria River begins in native forest in the Mangamuka Ranges, and runs north through pasture before joining the Awanui River near Kaitaia. The site is located approximately two kilometres downstream of the forest, in pastoral land use; however the upstream catchment is dominated by indigenous forest. The geology of this site is classified as volcanic acidic in the ‘River Environment Classification' (NIWA & MfE 2004).
The results for 2007-08 for the Victoria River site are summarised in the table below. These include the median, range and percentage of sampling occasions that complied with relevant guidelines. An asterisk in the table below denotes a median value outside the recommended guideline.
| Parameter | Median | Range | % comply with guideline |
| Temperature (deg. cel.) | 14.8 | 10.1 - 18.7 | - |
| Dissolved oxygen (mg/L) | 9.7 | 7.8 - 11.3 | 100 |
| Dissolved oxygen (% Sat.) | 95.1* | 82.9 - 108.3 | 17 |
| Conductivity (mSm) | 15.7 | 11.5 - 17.4 | - |
| Water clarity (m) | 1.3 | 0.6 - 3.2 | 100 |
| Turbidity (NTU) | 1.20 | 1 - 47 | 67 |
| E. coli (n/100mL) | 232 | 73 - 601 | 83 |
| Dissolved reactive phosphorus (mg/L) | 0.020* | 0.01 - 0.021 | 9 |
| Total phosphorus (mg/L) | 0.030 | 0.019 - 0.09 | 64 |
| Ammoniacal nitrogen (mg/L) | 0.005 | 0.005 - 0.01 | 100 |
| Total nitrogen (mg/L) | 0.228 | 0.104 - 1.142 | 83 |
| pH | 7.6 | 7.1 - 7.8 | 92 |
Results for 2007-08 indicate that water quality in the Victoria River is, for the most part, excellent. The medians for the majority of parameters are within relevant guidelines and most met their relevant guidelines on 10 or more sampling occasions. Dissolved oxygen (%) and dissolved reactive phosphorus are the parameters of most concern as relevant guidelines were not met on 9 or more sampling occasions.
Long-term trend analysis of data for the Victoria River site shows a positive decreasing trend in both dissolved reactive and total phosphorus levels. However, there are significant long term trends indicating that pH, total nitrogen (organic nitrogen) and dissolved oxygen (% saturation) are increasing and water clarity is decreasing. It is likely that the increased trend in dissolved oxygen is positive as current values are low but trends in water clarity and total nitrogen are of greater concern.
Waipapa Stream at Kerikeri Inlet
The Waipapa Stream is fed by Lake Manuwai and flows east out into the Kerikeri Inlet. The stream passes through a mixture of land use types, including pastoral, horticulture (orchards) and lifestyle blocks. The underlying geology is predominantly acidic volcanic.
The results from 2007-08 are summarised in the table below. These include the median, range and percentage of sampling occasions that comply with relevant guidelines. Please note that this site was only sampled on 11 occasions in 2007-08 (sampling began August 2007). An asterisk in the table below denotes a median value outside the recommended guideline.
| Parameter | Median | Range | % comply with guideline |
| Temperature (deg. cel.) | 17.4 | 12.9 - 22 | - |
| Dissolved oxygen (mg/L) | 9.5 | 7.4 - 11.5 | 100 |
| Dissolved oxygen (% Sat.) | 98.5 | 84.9 - 109.2 | 36 |
| Conductivity (mSm) | 8 | 6.8 - 28.8 | - |
| Water clarity (m) | 1.87 | 0.45 - 2.85 | 90 |
| Turbidity (NTU) | 2.7 | 1 - 18.2 | 82 |
| E. coli (n/100mL) | 183 | 31 - 4884 | 91 |
| Dissolved reactive phosphorus (mg/L) | 0.01* | 0.005 - 0.03 | 82 |
| Total phosphorus (mg/L) | 0.03 | 0.005 - 0.075 | 73 |
| Ammoniacal nitrogen (mg/L) | 0.01 | 0.005 - 0.16 | 91 |
| Total nitrogen (mg/L) | 0.612 | 0.342 - 1.092 | 55 |
| pH | 6.9* | 3.4 - 7.3 | 18 |
Results from 2007-08 indicate that water quality at the Waipapa Stream site is generally good, with peaks in nutrients and turbidity occurring during times of high flows.
During 2007-08, the medians for the majority of parameters met their relevant guidelines, except dissolved reactive phosphorus and pH. Dissolved oxygen (mg/l) was the only parameter to meet the guidelines on all sampling occasions. Water clarity, bacteria and ammoniacal nitrogen levels only failed to met recommended guidelines on one occasion.
There is not yet sufficient data to undertake trend analysis for this site.
Kerikeri River, Stone Store Bridge
The Kerikeri River originates to the east of the Puketi Forest, and flows east into the Kerikeri Inlet. The catchment contains a range of land use, including pastoral, horticulture (orchards), agriculture (crops) and forestry (pine plantations). There are small areas of indigenous forest in the headwaters.
The results from 2007-08 are summarised in the table below. These include the median, range and percentage of sampling occasions that complied with relevant guidelines. Please note that this site was only sampled on 11 occasions in 2007-08 (sampling began August 2007). An asterisk in the table below denotes a median value outside the recommended guideline.
| Parameter | Median | Range | % comply with guideline |
| Temperature (deg. cel.) | 16.7 | 12.4 - 21.3 | - |
| Dissolved oxygen (mg/L) | 9.7 | 8.6 - 13.2 | 100 |
| Dissolved oxygen (% Sat.) | 101.4 | 88.9 - 123.5 | 70 |
| Conductivity (mSm) | 7.9 | 6.9 - 30 | - |
| Water clarity (m) | 2.11 | 0.6 - 2.66 | 100 |
| Turbidity (NTU) | 2.8 | 1 - 26 | 64 |
| E. coli (n/100mL) | 472 | 98 - 8164 | 55 |
| Dissolved reactive phosphorus (mg/L) | 0.02* | 0.005 - 0.06 | 36 |
| Total phosphorus (mg/L) | 0.03 | 0.016 - 1.2 | 55 |
| Ammoniacal nitrogen (mg/L) | 0.005 | 0.005 - 0.21 | 73 |
| Total nitrogen (mg/L) | 0.762* | 0.512 - 1.343 | 27 |
| pH | 7.3 | 7 - 7.4 | 82 |
During 2007-08, the medians for the majority of parameters met their relevant guidelines, except dissolved reactive phosphorus and total nitrogen. Dissolved oxygen (mg/l) and water clarity were the only parameters that met the guideline on all sampling occasions.
Bacterial levels (E. coli) exceeded the guideline value for recreational bathing of 550/100ml on six out of 11 sampling occasions. This is concerning and indicates that there is a more persistent source of E. coli in the upper catchment, such as a leaking septic tank, stock with access to the river or farm dairy discharge. Restricting stock access to the river, managing point-source discharges and maintaining septic tanks in this area would benefit water quality in this river.
This is the first year this river has been monitored as part of the RWQMN. There is not yet sufficient data to undertake trend analysis for this site.
Mangamuka River
The Mangamuka River begins in the Mangamuka Forest. The river then flows south into the upper reaches of the Hokianga Harbour. In the lower reaches, the river passes through pastoral land however the upper catchment is dominated by indigenous forest. The sampling site is located upstream of the confluence between the Mangamuka and Iwitaua Stream.
Results for 2007-08 are summarised in the table below. These include the median, range and percentage of sampling occasions that complied with relevant guidelines. Please note that this site was only sampled on 11 occasions in 2007-08 (sampling began August 2007). An asterisk in the table below denotes a median value outside the recommended guideline.
| Parameter | Median | Range | % comply with guideline |
| Temperature (deg. cel.) | 14.9 | 10.3 - 18.8 | - |
| Dissolved oxygen (mg/L) | 9.2 | 7.8 - 10.9 | 100 |
| Dissolved oxygen (% Sat.) | 93.8* | 80.7 - 100.5 | 18 |
| Conductivity (mSm) | 16 | 10.7 - 17.8 | - |
| Water clarity (m) | 1.6 | 0.9 - 3.4 | 100 |
| Turbidity (NTU) | 1 | 1 - 25 | 70 |
| E. coli (n/100mL) | 272 | 86 - 2282 | 82 |
| Dissolved reactive phosphorus (mg/L) | 0.03* | 0.03 - 0.04 | 0 |
| Total phosphorus (mg/L) | 0.046* | 0.033 - 0.073 | 10 |
| Ammoniacal nitrogen (mg/L) | 0.005 | 0.005 | 100 |
| Total nitrogen (mg/L) | 0.121 | 0.084 - 0.852 | 91 |
| pH | 7.5 | 6.9 - 7.7 | 91 |
During 2007-08, dissolved oxygen (mg/l), water clarity and ammoniacal nitrogen were the only parameters that met the guidelines on all sampling occasions. Dissolved reactive phosphorus did not meet the relevant guideline on any occasion, which is concerning as the majority of the catchment is native forest.
This is the first year this river has been monitored as part of the RWQMN. There is not yet sufficient data to undertake trend analysis for this site.
Waitangi River at Watea
The Waitangi River originates in the middle of Northland and flows east, where it joins the coast at Waitangi. There are two sites on the Waitangi River that form part of the RWQMN; one at Waimate North and the other at Watea near Waitangi. The catchments of both sites are dominated by pastoral farming. However, the geology of the upstream site at Waimate North is predominantly volcanic acidic, while the site at Watea is dominated by hard sediments.
Unlike many of Northland's rivers, a buffer strip of riparian vegetation exists along the banks of the majority of the Waitangi River. The Watea site on the Waitangi River is one of four sites in Northland that are part of the National River Water Quality Network administered by NIWA.
The results from 2007-08 for this site are summarised in the table below. These include the median, range and percentage of sampling occasions that complied with relevant guidelines. Note: Dissolved reactive phosphorus and ammoniacal nitrogen results were only available for six sampling occasions (July 2007 – December 2007). An asterisk in the table below denotes a median value outside the recommended guideline.
| Parameter | Median | Range | % comply with guideline |
| Temperature (deg. cel.) | 18 | 12.3 - 23.2 | - |
| Dissolved oxygen (mg/L) | 9.7 | 8.3 - 11.1 | 100 |
| Dissolved oxygen (% Sat.) | 101.9 | 96.2 - 109.6 | 75 |
| Conductivity (mSm) | 11.3 | 9.68 - 13.5 | - |
| Water clarity (m) | 0.94 | 0.125 - 2.75 | 58 |
| Turbidity (NTU) | 5.1 | 0.8 - 42.3 | 50 |
| E. coli (n/100mL) | 292 | 56 - 2419 | 67 |
| Dissolved reactive phosphorus (mg/L) | 0.007 | 0.004 - 0.015 | 67 |
| Total phosphorus (mg/L) | 0.027 | 0.015 - 0.136 | 67 |
| Ammoniacal nitrogen (mg/L) | 0.007 | 0.003 - 0.028 | 83 |
| Total nitrogen (mg/L) | 0.622* | 0.226 - 1.175 | 42 |
| pH | 7.5 | 6.9 - 7.8 | 75 |
During 2007-08, water quality at the Watea site on the Waitangi River was similar to that at the Waimate North site. The median for total nitrogen was the only parameter outside of the recommended guidelines. However, like the Waimate site, compliance with the guidelines for most parameters has fallen this year.
Again, bacterial contamination is the most concerning result with E. coli levels exceeding the relevant guideline of 550 E. coli/100ml on eight out of 12 sampling occasions. Total nitrogen also had poor compliance, with levels exceeding 0.614 mg/l on seven sampling occasions.
Based on data from October 1996 to December 2007, the trend analysis shows that there are no significant trends for any of the parameters at this site.
Waitangi River at Waimate North
The Waitangi River originates just east of Lake Omapere, and flows into the Bay of Islands. There are two sites on Waitangi River in the RWQMN; one in the upper to mid reaches at Waimate North and the other in the lower reaches at Watea. At the Waimate North site, the catchment is a mix of beef, sheep and dairy farming, with significant areas of indigenous forest in the headwaters. The underlying geology is predominantly acidic volcanic.
The results for 2007-08 for the Waitangi River at Waimate North are summarised in the table below. These include the median, range and percentage of sampling occasions that complied with relevant guidelines. An asterisk in the table below denotes a median value outside the recommended guideline.
| Parameter | Median | Range | % comply with guideline |
| Temperature (deg. cel.) | 15.1 | 11.6 - 19.5 | - |
| Dissolved oxygen (mg/L) | 9.6 | 8.8 - 11.3 | 100 |
| Dissolved oxygen (% Sat.) | 95.3* | 91.1 - 104.3 | 25 |
| Conductivity (mSm) | 9.55 | 4.2 - 31.5 | - |
| Water clarity (m) | 0.9 | 0.3 - 2.2 | 64 |
| Turbidity (NTU) | 6.1* | 2.8 - 44 | 42 |
| E. coli (n/100mL) | 446 | 275 - 2063 | 67 |
| Dissolved reactive phosphorus (mg/L) | 0.01* | 0.005 - 0.02 | 64 |
| Total phosphorus (mg/L) | 0.03 | 0.015 - 0.065 | 58 |
| Ammoniacal nitrogen (mg/L) | 0.0075 | 0.005 - 0.15 | 67 |
| Total nitrogen (mg/L) | 0.5775 | 0.472 - 1.042 | 58 |
| pH | 6.9* | 6.7 - 7.1 | 0 |
During 2007-08. water quality in the Waitangi River at Waimate North has deteriorated. Results from 2007-08 indicate elevated levels of nutrients, increased turbidity and decreasing water clarity. In the past, nutrient levels and water clarity have met their relevant guidelines on most sampling occasions at this site.
The median for turbidity and pH were not within accepted guidelines this year.
Trend analysis on 10 years of data for this site shows that there is a significant increase in water clarity and a decrease in dissolved reactive and total phosphorus. These are positive trends.
There is also an increasing trend in pH; however, it is not yet known whether an increase in pH at this site is beneficial or detrimental, however, it is likely that an increase in pH is beneficial, as pH levels this year were often below the optimum pH range for the protection of aquatic ecosystems.
Waiarohia Stream at Second Ave
Waiarohia Stream is a small stream originating from Pukenui Forest and the Western Hills in Whangarei. The upper catchment is mainly indigenous forest with some exotic forestry. The stream flows through a small area of low intensity farmland and lifestyles block, before it reaches residential housing and the central business area of Whangarei. This site is located in the central business area and was added to the RWQMN in 2005-06 to look at urban influences on water quality. Results for this site can be compared to the upstream site in Whau Valley.
The results from 2007-08 for the Waiarohia Stream site at Second Ave are summarised in the table below. These include the median, range and percentage of sampling occasions that complied with relevant guidelines. An asterisk in the table below denotes a median value outside the recommended guideline.
| Parameter | Median | Range | % comply with guideline |
| Temperature (deg. cel.) | 18.65 | 13.6 - 25.5 | - |
| Dissolved oxygen (mg/L) | 10.3 | 8.1 - 12.1 | 100 |
| Dissolved oxygen (% Sat.) | 105.7 | 87.2 - 121.8 | 25 |
| Conductivity (mSm) | 21.9 | 2.5 - 31.8 | - |
| Water clarity (m) | 1.59 | 0.4 - 2.67 | 92 |
| Turbidity (NTU) | 5.6* | 2 - 24 | 50 |
| E. coli (n/100mL) | 434 | 121 - 1789 | 58 |
| Dissolved reactive phosphorus (mg/L) | 0.01* | 0.01 - 0.017 | 75 |
| Total phosphorus (mg/L) | 0.03 | 0.01 - 0.05 | 67 |
| Ammoniacal nitrogen (mg/L) | 0.01 | 0.005 - 0.27 | 92 |
| Total nitrogen (mg/L) | 0.632* | 0.292 - 0.982 | 50 |
| pH | 7.4 | 6.8 - 7.8 | 92 |
Results from 2007-08 indicate that water quality at this site is average, with half of the parameters meeting their respective guidelines on eight or more sampling occasions.
Bacteria levels are often elevated at this site with levels higher than the recreational bathing guideline of 550 E. coli/100 mL on five occasions. The highest temperature of all the RWQMN sites was recorded at this site on 16 January 2008 (25.5°C). It is commonly accepted that water temperatures of greater then 25°C are potentially harmful or even lethal for aquatic life.
During 2007-08, dissolved reactive phosphorus, total nitrogen and turbidity were also elevated and did not meet their relevant guidelines. The source of nutrient and bacterial contamination in this stream is likely to be surrounding, small scale pastoral farming and is probably related to stock access to the stream. The overuse of fertiliser in residential gardens could also contribute to the increase in nitrogen.
There is not yet sufficient data to undertake trend analysis for this site.
Whakapara River
The Whakapara River originates from the ranges east of Hikurangi and Whakapara, eventually joining the Waiotu River, forming the headwaters of the greater Wairua River. The river cuts through hard sediments formed from faulted greywacke, along a relatively low gradient. The site is located in a beef and sheep farm near State Highway one, with an upstream catchment dominated by forested hills and pastoral farming.
The results for 2007-08 for the Whakapara River site are summarised in the table below. These include the median, range and percentage of sampling occasions that complied with relevant guidelines. An asterisk in the table below denotes a median value outside the recommended guideline.
| Parameter | Median | Range | % comply with guideline |
| Temperature (deg. cel.) | 16.0 | 11.7 - 20.4 | - |
| Dissolved oxygen (mg/L) | 9.6 | 7.3 - 10.8 | 100 |
| Dissolved oxygen (% Sat.) | 93.1* | 75.9 - 111 | 17 |
| Conductivity (mSm) | 9.0 | 5 - 29.8 | - |
| Water clarity (m) | 1.0 | 0.22 - 1.84 | 73 |
| Turbidity (NTU) | 7.7* | 2.9 - 119 | 17 |
| E. coli (n/100mL) | 181 | 20 - 8664 | 83 |
| Dissolved reactive phosphorus (mg/L) | 0.027* | 0.02 - 0.054 | 0 |
| Total phosphorus (mg/L) | 0.05* | 0.037 - 0.183 | 0 |
| Ammoniacal nitrogen (mg/L) | 0.01 | 0.005 - 0.13 | 58 |
| Total nitrogen (mg/L) | 0.542 | 0.155 - 1.746 | 58 |
| pH | 6.8* | 6.4 - 7.3 | 25 |
During 2007-08, the medians for five parameters did not meet their relevant guidelines. Both total phosphorus and dissolved reactive phosphorus did not meet guideline values on any of the sampling occasions. Turbidity, dissolved oxygen (%) and pH failed to meet their respective guidelines on most sampling occasions.
Significant long term trends in Whakapara River include increasing water clarity and decreasing dissolved reactive and total phosphorus trends, which are all seen as positive trends. There is an increasing trend in dissolved oxygen (%), which could be related to an increase in the biomass of oxygen weed and other macrophytes in the river. It is unknown whether this is a negative or positive trend, as dissolved oxygen levels can be both below and above the optimum range for the protection of aquatic ecosystems.
There is also an increasing trend in pH, which is likely to be beneficial as the pH is often below the optimum range for aquatic life.
Waiarohia Stream at Whau Valley Road
Waiarohia Stream is a small stream originating from Pukenui Forest and the Western Hills in Whangarei. The upper catchment is mainly indigenous forest with some exotic forestry. The stream flows through a small area of low intensity farm land (mostly lifestyle blocks), before it reaches residential housing and the central business area of Whangarei. This site is located upstream of the majority of residential housing in the upper catchment of the Waiarohia Stream.
The results from 2007-08 for the Waiarohia Stream site at Whau Valley Road are summarised in the table below. These include the median, range and percentage of sampling occasions that complied with relevant guidelines. An asterisk in the table below denotes a median value outside the recommended guideline.
| Parameter | Median | Range | % comply with guideline |
| Temperature (deg. cel.) | 16.4 | 12.8 - 21.1 | - |
| Dissolved oxygen (mg/L) | 9.9 | 7.9 - 10.7 | 100 |
| Dissolved oxygen (% Sat.) | 98.0 | 84.6 - 120.5 | 25 |
| Conductivity (mSm) | 23.5 | 13.5 - 39.2 | - |
| Water clarity (m) | 0.95 | 0.4 - 1.76 | 83 |
| Turbidity (NTU) | 6.55 | 3.2 - 42 | 42 |
| E. coli (n/100mL) | 391 | 5 - 2382 | 67 |
| Dissolved reactive phosphorus (mg/L) | 0.017* | 0.01 - 0.02 | 25 |
| Total phosphorus (mg/L) | 0.04* | 0.02 - 0.08 | 33 |
| Ammoniacal nitrogen (mg/L) | 0.005 | 0.005 - 0.21 | 92 |
| Total nitrogen (mg/L) | 0.597 | 0.362 - 0.972 | 58 |
| pH | 7.3 | 6.8 - 7.7 | 67 |
Results from 2007-08 highlight several areas of concern in the Waiarohia Stream. Compliance with guideline values is poor for dissolved oxygen (%), turbidity, and dissolved reactive and total phosphorus. Phosphorus levels are higher and fail to met recommended guideline values on more occasions than the downstream site at Second Ave.
The source of nutrient and bacterial contamination is likely to be surrounding, small-scale pastoral farming and could be related to stock access to the stream.
There is not yet sufficient data to undertake trend analysis for this site.
Waipao Stream, Draffin Road Bridge
The Waipao Stream was added to the RWQMN in 2007-08. The Waipao Stream begins as the Kauritutahi Stream to the west of Mangatapere (the Kauritutahi Stream becomes Waipao as it flows west towards Poroti). At Poroti, a number of springs feed into the stream and the stream itself eventually feeds into the Wairua River. The catchment of the stream is largely agricultural and includes high production farmland, orchards, crops and some small lifestyle blocks.
The 2007-08 results for Waipao Stream are summarised in the table below. These include the median, range and percentage of sampling occasions that complied with relevant guidelines. Please note that this site was only sampled on 10 occasions in 2007-08. An asterisk in the table below denotes a median value outside the recommended guideline.
| Parameter | Median | Range | % comply with guideline |
| Temperature (deg. cel.) | 17 | 13.4 - 19.4 | - |
| Dissolved oxygen (mg/L) | 9.95 | 8 - 12.4 | 100 |
| Dissolved oxygen (% Sat.) | 102 | 83.6 - 135.1 | 40 |
| Conductivity (mSm) | 18.15 | 17.3 - 20.8 | - |
| Water clarity (m) | 1.81 | 0.42 - 2.86 | 90 |
| Turbidity (NTU) | 3.25 | 1 - 14.3 | 80 |
| E. coli (n/100mL) | 700* | 384 - 2481 | 20 |
| Dissolved reactive phosphorus (mg/L) | 0.03* | 0.02 - 0.049 | 0 |
| Total phosphorus (mg/L) | 0.055* | 0.03 - 0.136 | 10 |
| Ammoniacal nitrogen (mg/L) | 0.005 | 0.005 - 0.11 | 80 |
| Total nitrogen (mg/L) | 3.0195* | 2.184 - 3.842 | 0 |
| pH | 7.35 | 7 - 8.1 | 80 |
Limited conclusions can be drawn from the data collected in 2007-08, as this was the first year of sampling at this site. However, it is apparent from the results that dissolved and total phosphorus, total nitrogen, and E. coli levels are elevated in the Waipao Stream.
The median for total nitrogen is significantly higher than the guideline value of 0.614 mg/l. Nitrogen could be entering the stream through runoff from surrounding agricultural land or could be naturally occurring, leaching from volcanic soils in the catchment.
E.coli, dissolved reactive phosphorus and total nitrogen did not meet the relevant guidelines on eight or more of the sampling occasions.
As the site was only added to the network in 2007, there is not yet sufficient data for the site to undertake trend analysis.
Mangakahia River at Titoki
The Mangakahia River originates in native bush near Waipoua Forest and flows southwest until it reaches the Wairua River. There are two sites on the Mangakahia River; one mid catchment at Twin Bridges and the other at Titoki Bridge in the lower reaches. By the time the Mangakahia River reaches the settlement of Titoki, surrounding land use is predominantly beef and dairy farming, with an underlying geology of acidic volcanic rock. This site is one of four sites in Northland that are part of the National River Water Quality Network, administered by NIWA.
The results from 2007-08 for the Mangakahia River site at Titoki Bridge are summarised in the table below. These include the median, range and percentage of sampling occasions that complied with relevant guidelines. Note: Dissolved reactive phosphorus and ammoniacal nitrogen results were only available for six sampling occasions (July 2007 – December 2007). An asterisk in the table below denotes a median value outside the recommended guideline.
| Parameter | Median | Range | % comply with guideline |
| Temperature (deg. cel.) | 17.2 | 12.1 - 24.1 | - |
| Dissolved oxygen (mg/L) | 9.2 | 6.9 - 10.4 | 100 |
| Dissolved oxygen (% Sat.) | 95.7* | 73.3 - 101.7 | 17 |
| Conductivity (mSm) | 13.5 | 7.78 - 16.5 | - |
| Water clarity (m) | 0.50* | 0.05 - 1.7 | 42 |
| Turbidity (NTU) | 8.30* | 3.5 - 23.3 | 36 |
| E. coli (n/100mL) | 262 | 80 - 2419 | 75 |
| Dissolved reactive phosphorus (mg/L) | 0.008 | 0.006 - 0.011 | 83 |
| Total phosphorus (mg/L) | 0.029 | 0.012 - 0.283 | 58 |
| Ammoniacal nitrogen (mg/L) | 0.015 | 0.01 - 0.03 | 83 |
| Total nitrogen (mg/L) | 0.301 | 0.1 - 1.22 | 92 |
| pH | 7.3 | 6.73 - 7.93 | 67 |
The results from 2007-08 indicate that water in the Mangakahia at Titoki is of moderate quality. The medians for turbidity, water clarity and dissolved oxygen (% saturation) did not meet their respective guidelines. The peaks in nutrients, turbidity and bacterial levels are related to increased/high flow.
Trend analysis on data from October 1996 to May 2006 indicates there is an increasing trend in total kjeldahl nitrogen (the sum of organic nitrogen, ammonia and ammonium) but not in total or ammoniacal nitrogen.
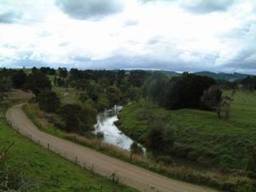
Photo: Mangakahia River at Titoki
Ngunguru River
The Ngunguru River originates in Waipaipai to the west of the Tutukaka Coast and flows through the Glenbervie forest out into the Ngunguru Estuary. Half of the catchment is pastoral, with the rest a mixture of Pinus radiata forest and indigenous forest. The site is situated in the lower reaches of the river just before the river becomes saline.
The 2007-08 results for the Ngunguru River are summarised in the table below. These include the median, range and percentage of sampling occasions that complied with relevant guidelines. Please note, this site was only sampled on nine occasions in 2007-08. An asterisk in the table below denotes a median value outside the recommended guideline.
| Parameter | Median | Range | % comply with guideline |
| Temperature (deg. cel.) | 16.7 | 12.6 - 21 | - |
| Dissolved oxygen (mg/L) | 9.3 | 7.7 - 10.4 | 100 |
| Dissolved oxygen (% Sat.) | 96.6* | 86.2 - 100.2 | 22 |
| Conductivity (mSm) | 10.5 | 3.11 - 38.6 | - |
| Water clarity (m) | 0.91 | 0.31 - 1.98 | 78 |
| Turbidity (NTU) | 12.7* | 3.8 - 102 | 33 |
| E. coli (n/100mL) | 457 | 122 - 3873 | 67 |
| Dissolved reactive phosphorus (mg/L) | 0.014* | 0.01 - 0.02 | 33 |
| Total phosphorus (mg/L) | 0.035* | 0.02 - 0.084 | 44 |
| Ammoniacal nitrogen (mg/L) | 0.020 | 0.005 - 0.08 | 67 |
| Total nitrogen (mg/L) | 0.294 | 0.174 - 1.072 | 89 |
| pH | 6.9* | 6.8 - 7.2 | 11 |
The results from 2007-08 indicate that the Ngunguru River has moderate water quality. Dissolved oxygen (mg/l) was the only parameter to comply with its guideline value on all sampling occasions.
PH only met its recommended guideline on one out of nine sampling occasions. Dissolved oxygen (%), turbidity, total and dissolved phosphorus also appear to be an issue at this site, with their medians for 2007-08 falling outside the relevant guideline value.
Trend analysis cannot yet be undertaken for this site as there is insufficient data.
Kaeo River
The Kaeo River begins north of Waipapa and flows north into the Whangaroa Harbour. Approximately half of the catchment is indigenous forest and scrub, with the remainder in pine forestry or pastoral farming. The underlying geology of the river is soft sediments. The site is located below the township of Kaeo, just before the influence of salt water.
The results from 2007-08 for the Kaeo River are summarised in the table below. These include the median, range and percentage of sampling occasions that complied with relevant guidelines. Please note that this site was only sampled on 11 occasions in 2007-08. An asterisk in the table below denotes a median value outside the recommended guideline.
| Parameter | Median | Range | % comply with guideline |
| Temperature (deg. cel.) | 17 | 11.2 - 23.2 | - |
| Dissolved oxygen (mg/L) | 8.7 | 7.6 - 10.1 | 100 |
| Dissolved oxygen (% Sat.) | 87.6* | 81.2 - 118 | 9 |
| Conductivity (mSm) | 12.6 | 6.4 - 14.4 | - |
| Water clarity (m) | 0.7 | 0.3 - 1.6 | 78 |
| Turbidity (NTU) | 7.5* | 3.9 - 88 | 18 |
| E. coli (n/100mL) | 656.5* | 262 - 1274 | 36 |
| Dissolved reactive phosphorus (mg/L) | 0.008 | 0.005 - 0.015 | 80 |
| Total phosphorus (mg/L) | 0.030 | 0.01 - 0.077 | 80 |
| Ammoniacal nitrogen (mg/L) | 0.010 | 0.005 - 0.03 | 82 |
| Total nitrogen (mg/L) | 0.262 | 0.168 - 0.802 | 82 |
| pH | 7.1* | 6.9 - 7.3 | 27 |
The results from 2007-08 indicate that water quality in the Kaeo River is moderate, with most parameters meeting their respective guidelines on eight or more sampling occasions. However, the median for dissolved oxygen (%), turbidity, E. coli and pH exceeded the relevant guideline value.
Trend analysis cannot yet be undertaken for this site as there is insufficient data.
Punakitere River at Taheke
The Punakitere River originates from a wetland to the southwest of Kaikohe and is a major tributary of the Waima River (which flows into the Hokianga Harbour). The catchment is predominantly agricultural land use with an underlying geology of soft sediments.
The results from 2007-08 for the Punakitere River are summarised in the table below. These include the median, range and percentage of sampling occasions that complied with relevant guidelines. An asterisk in the table below denotes a median value outside the recommended guideline.
| Parameter | Median | Range | % comply with guideline |
| Temperature (deg. cel.) | 15.6 | 11.8 - 21.4 | - |
| Dissolved oxygen (mg/L) | 9.9 | 6.3 - 10.7 | 100 |
| Dissolved oxygen (% Sat.) | 98.7 | 58.6 - 109.2 | 42 |
| Conductivity (mSm) | 12.3 | 9.1 - 23.5 | - |
| Water clarity (m) | 0.92 | 0.24 - 2.52 | 67 |
| Turbidity (NTU) | 11.7* | 2.4 - 122 | 25 |
| E. coli (n/100mL) | 480 | 195 - 17329 | 67 |
| Dissolved reactive phosphorus (mg/L) | 0.03* | 0.01 - 0.071 | 8 |
| Total phosphorus (mg/L) | 0.065* | 0.03 - 0.196 | 8 |
| Ammoniacal nitrogen (mg/L) | 0.020 | 0.005 - 0.08 | 58 |
| Total nitrogen (mg/L) | 0.83* | 0.276 - 1.612 | 17 |
| pH | 7.4 | 7 - 8 | 50 |
The results from 2007-08 indicate that the Punakitere River suffers from significant nutrient overloading, with medians for turbidity, dissolved reactive phosphorus, total phosphorus and total nitrogen all exceeding their respective guidelines. Run-off from surrounding land-use is the most likely source of nutrient and bacterial contamination in the Punakitere River.
Both dissolved reactive and total phosphorus only met their recommended guideline on one occasion.
Trend analysis on seven years data shows that there is a decreasing trend in ammoniacal nitrogen for the Punakitere River. There is also a slight decrease in total nitrogen however this trend is not significant.
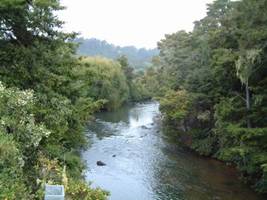
Photo: Punakitere River
Oruru River, Oruru Road
The Oruru River originates from the Otangaroa forest and flows north through indigenous forest and scrub. In the lower catchment, the river meanders through pastoral dominated land eventually flowing out into the Taipa River. Underlying geology is dominated by volcanic acidic rock, with some areas of soft sediments.
The results for 2007-08 for the Oruru River are summarised in the table below. These include the median, range and percentage of sampling occasions that complied with relevant guidelines. Please note that this site was only sampled on 11 occasions in 2007-08. An asterisk in the table below denotes a median value outside the recommended guideline.
| Parameter | Median | Range | % comply with guideline |
| Temperature (deg. cel.) | 16.8 | 12.5 - 21.8 | - |
| Dissolved oxygen (mg/L) | 8.1 | 6.9 - 10.3 | 100 |
| Dissolved oxygen (% Sat.) | 84.0* | 73.3 - 96.9 | 0 |
| Conductivity (mSm) | 16.2 | 10.2 - 17.7 | - |
| Water clarity (m) | 0.7 | 0.4 - 1.3 | 67 |
| Turbidity (NTU) | 8.3* | 3.3 - 112 | 27 |
| E. coli (n/100mL) | 301 | 86 - 4884 | 73 |
| Dissolved reactive phosphorus (mg/L) | 0.021* | 0.02 - 0.032 | 0 |
| Total phosphorus (mg/L) | 0.042* | 0.03 - 0.143 | 10 |
| Ammoniacal nitrogen (mg/L) | 0.005 | 0.005 - 0.05 | 73 |
| Total nitrogen (mg/L) | 0.288 | 0.125 - 1.092 | 73 |
| pH | 7* | 7.1 - 7.7 | 82 |
The results from 2007–08 indicate that water quality in the Oruru River is highly impacted, with the medians for dissolved oxygen (%), turbidity, pH, and total and dissolved phosphorus all exceeding their recommended guideline values.
Dissolved oxygen (percentage) and dissolved reactive phosphorus did not meet the relevant guideline values on any of the 11 sampling occasions.
Trend analysis cannot yet be undertaken for this site as there is insufficient data.
Waiotu River at SH1
The Waiotu River is a hard sediment bottomed river derived from a predominantly agricultural catchment. The river originates from the hills to the northeast of State Highway one, between Kawakawa and Whangarei, and runs into the Whakapara River to form the greater Wairua River.
The results from 2007-08 for the Waiotu River site are summarised in the table below. These include the median, range and percentage of sampling occasions that complied with the relevant guidelines. An asterisk in the table below denotes a median value outside the recommended guideline.
| Parameter | Median | Range | % comply with guideline |
| Temperature (deg. cel.) | 15.9 | 11.5 - 20.1 | - |
| Dissolved oxygen (mg/L) | 9.0 | 7.1 - 10.7 | 100 |
| Dissolved oxygen (% Sat.) | 90.3 | 73.3 - 98.8 | 17 |
| Conductivity (mSm) | 9.9 | 8 - 30.7 | - |
| Water clarity (m) | 0.89 | 0.32 - 1.66 | 73 |
| Turbidity (NTU) | 9.45* | 4.3 - 33 | 17 |
| E. coli (n/100mL) | 384 | 74 - 4106 | 75 |
| Dissolved reactive phosphorus (mg/L) | 0.023* | 0.02 - 0.121 | 0 |
| Total phosphorus (mg/L) | 0.065* | 0.03 - 0.123 | 8 |
| Ammoniacal nitrogen (mg/L) | 0.030* | 0.005 - 0.14 | 42 |
| Total nitrogen (mg/L) | 0.617* | 0.234 - 1.737 | 50 |
| pH | 6.8* | 6 - 7.3 | 17 |
Results from 2007-08 indicate that water quality in the Waiotu River is highly impacted, with the medians for the majority of parameters not meeting their respective guidelines. Dissolved reactive phosphorus exceeded its ANZECC trigger values on all 12 sampling occasions. Total phosphorus only met its respective guidelines once.
For the majority of parameters, the medians from 2007-08 are higher than those recorded in 2006-07, in particular total nitrogen and turbidity.
Trend analysis on data collected for this site suggests that there is an increasing trend in turbidity.
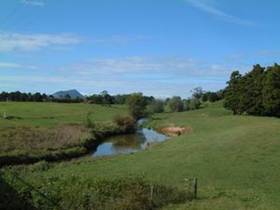
Photo: Waiotu River
Awanui River at FNDC water take
The Awanui River originates from Raetea Forest (Mangamuka's) and meanders north for a significant distance through pasture and the Kaitaia township, eventually flowing into the Rangunu Harbour. There are 3 sites in the network on the Awanui River system; one in the upper reaches on Victoria River, one in the mid reaches at the FNDC water take and one in the lower reaches directly above Waihue channel.
The FNDC water take from the Awanui River is adjacent to State Highway 1, just south of Kaitaia. Land use in the upstream catchment is predominantly pastoral, with some semi-forested tributaries, for example, the Victoria River. The river's geology is soft sediments.
The results from 2007-08 for the Awanui River at the FNDC water take are summarised in the table below. These include the median, range and percentage of sampling occasions that complied with relevant guidelines. An asterisk in the table below denotes a median value outside the recommended guideline.
| Parameter | Median | Range | % comply with guideline |
| Temperature (deg. cel.) | 15.8 | 12.1 - 21.5 | - |
| Dissolved oxygen (mg/L) | 8.6 | 6.4 - 9.8 | 100 |
| Dissolved oxygen (% Sat.) | 82.5* | 71.8 - 98.4 | 8 |
| Conductivity (mSm) | 18.9 | 15.1 - 22.7 | - |
| Water clarity (m) | 0.70 | 0.3 - 2 | 70 |
| Turbidity (NTU) | 8.25* | 2.3 - 51 | 17 |
| E. coli (n/100mL) | 207 | 20 - 3873 | 67 |
| Dissolved reactive phosphorus (mg/L) | 0.02* | 0.02 - 0.045 | 0 |
| Total phosphorus (mg/L) | 0.05* | 0.02 - 0.13 | 18 |
| Ammoniacal nitrogen (mg/L) | 0.018 | 0.005 - 0.05 | 50 |
| Total nitrogen (mg/L) | 0.330 | 0.119 - 2.552 | 75 |
| pH | 7.55 | 7.1 - 7.9 | 67 |
As for the previous two years, results from 2007-08 indicate that nitrogen concentrations at this site are satisfactory on most occasions, however dissolved oxygen (% saturation), phosphorus and turbidity failed to meet the relevant guidelines on 10 or more sampling occasions. Some of these elevated results coincided with high flows and therefore are most likely the result of surface run-off from surrounding land during rainfall events.
Improved riparian management, for example, restricting stock access to waterways in this catchment will assist in improving water quality. Better maintenance of septic tanks in the catchment may also reduce contamination.
A potential source of phosphorus is inefficiently applied fertiliser. Peaks in phosphorus generally occur in autumn when fertiliser is typically applied. Accurate nutrient budgeting and appropriate application can reduce the amount of fertiliser wasted in run-off, which then enters streams.
Trend analysis for 12 years of water quality data shows that there is a decreasing trend in ammoniacal nitrogen, and dissolved reactive and total phosphorus at this site. These are all beneficial trends and may already be the result of improved land management practices in the catchment.
Mangahahuru Stream at Apotu Road
The Mangahahuru Stream, which begins in Pinus radiata forestry southeast of Hikurangi, is a small tributary of the Wairua River. Other than the exotic forestry in the headwaters, the catchment is predominantly agricultural land use, with an increasing number of lifestyle blocks. The underlying geology is hard sedimentary.
The results for 2007-08 for the Mangahahuru Stream at Apotu Road are summarised in the table below. These include the median, range and percentage of sampling occasions that complied with the relevant guidelines. An asterisk in the table below denotes a median value outside the recommended guideline.
| Parameter | Median | Range | % comply with guideline |
| Temperature (deg. cel.) | 16.2 | 11.7 - 20.1 | - |
| Dissolved oxygen (mg/L) | 9.9 | 5.4 - 11.4 | 92 |
| Dissolved oxygen (% Sat.) | 95.3* | 55.9 - 115 | 17 |
| Conductivity (mSm) | 11.5 | 8.7 - 32.3 | - |
| Water clarity (m) | 0.85 | 0.26 - 1.8 | 73 |
| Turbidity (NTU) | 8.25* | 3.6 - 64 | 17 |
| E. coli (n/100mL) | 573* | 109 - 5794 | 50 |
| Dissolved reactive phosphorus (mg/L) | 0.029* | 0.019 - 0.052 | 0 |
| Total phosphorus (mg/L) | 0.075* | 0.037 - 0.143 | 0 |
| Ammoniacal nitrogen (mg/L) | 0.03* | 0.005 - 0.07 | 50 |
| Total nitrogen (mg/L) | 0.651* | 0.372 - 1.402 | 50 |
| pH | 6.9* | 6.2 - 7.3 | 25 |
The results from 2007-08 indicate that water quality in the Mangahahuru Stream is highly impacted, with the medians of most parameters exceeding their guideline values. The stream has high levels of nutrients and E. coli bacteria.
In 2007-08, both total and dissolved phosphorus exceeded guideline values on all sampling occasions. Dissolved oxygen (%) levels are of particular concern, as there are large variations with the lowest observed reading being 55.9 mg/l and the highest being 115 mg/l. It is likely these variations are due to large amounts of oxygen weed at the site.
The most likely source of contamination at this site is surface run-off from surrounding land, as spikes in contamination are associated with high river flows after rainfall events. Poorly maintained septic tanks, stock access to the stream and point source consented discharges, such as the Hikurangi Oxidation Pond, may also contribute.
Trend analysis on data for the site indicates positive (improving) trends for water clarity, ammoniacal nitrogen, nitrate nitrite nitrogen, and dissolved reactive and total phosphorus in the Mangahahuru Stream. There is also an increasing trend in pH, which in this case is a positive trend, as pH at this site is often below the optimum range for aquatic life.
There are some negative trends for the Mangahahuru Stream, including increasing conductivity and dissolved oxygen (percentage).
Waiharakeke River at Stringer Road
The Waiharakeke River is a major tributary of the Kawakawa River, which flows into the Waikare Inlet in the Bay of Islands. The Waiharakeke River originates in the Motatau Forest and flows North through a mixture of pine forestry, pastoral land and indigenous forest, before reaching Moerewa. The underlying geology is hard sedimentary.
The results from 2007-08 for the Waiharakeke River are summarised in the table below. These include the median, range and percentage of sampling occasions that complied with the relevant guidelines. An asterisk in the table below denotes a median value outside the recommended guideline.
| Parameter | Median | Range | % comply with guideline |
| Temperature (deg. cel.) | 15.95 | 11.1 - 20.7 | - |
| Dissolved oxygen (mg/L) | 9.4 | 8.3 - 10.9 | 100 |
| Dissolved oxygen (% Sat.) | 95.0* | 91.7 - 101.3 | 8 |
| Conductivity (mSm) | 15.0 | 7.9 - 33.1 | - |
| Water clarity (m) | 0.65 | 0.27 - 1.36 | 64 |
| Turbidity (NTU) | 11.35* | 4.9 - 50 | 8 |
| E. coli (n/100mL) | 574* | 160 - 3873 | 50 |
| Dissolved reactive phosphorus (mg/L) | 0.02* | 0.01 - 0.113 | 8 |
| Total phosphorus (mg/L) | 0.06* | 0.04 - 0.115 | 0 |
| Ammoniacal nitrogen (mg/L) | 0.015 | 0.005 - 0.17 | 75 |
| Total nitrogen (mg/L) | 0.518 | 0.178 - 1.717 | 58 |
| pH | 7.3 | 6.9 - 7.7 | 75 |
The results from 2007-08 indicate that the Waiharakeke Stream is a moderately impacted waterway, with poor dissolved oxygen (%) concentrations and high phosphorus, E.coli and turbidity levels.
Total phosphorus exceeded its relevant guideline value on every sampling occasion.
Turbidity and dissolved reactive phosphorus only met their recommended guideline once. Dissolved oxygen (mg/l) was the only parameter that met its relevant guideline on all sampling occasions.
Trend analysis cannot yet be undertaken for this site as there is insufficient data.
Paparoa Stream
The Paparoa Stream is a soft sediment-bottomed stream, which is set in a catchment dominated by high production farmland, with pockets of pine forestry and native bush. The stream flows west into an arm of the Kaipara harbour. The site is located in the park in Paparoa Township.
The results from 2007-08 for Paparoa Stream are summarised in the table below. These include the median, range and percentage of sampling occasions that complied with relevant guidelines. Please note that this site was only sampled on 11 occasions in 2007-08. An asterisk in the table below denotes a median value outside the recommended guideline.
| Parameter | Median | Range | % comply with guideline |
| Temperature (deg. cel.) | 15.8 | 11.4 - 21.2 | - |
| Dissolved oxygen (mg/L) | 8.8 | 6.2 - 10.3 | 100 |
| Dissolved oxygen (% Sat.) | 88.9* | 70.2 - 96.3 | 0 |
| Conductivity (mSm) | 27.4 | 19.6 - 468.2 | - |
| Water clarity (m) | 1 | 0.3 - 1.7 | 82 |
| Turbidity (NTU) | 6* | 3.8 - 38 | 45 |
| E. coli (n/100mL) | 857* | 134 - 6131 | 27 |
| Dissolved reactive phosphorus (mg/L) | 0.03* | 0.01 - 0.051 | 18 |
| Total phosphorus (mg/L) | 0.07* | 0.05 - 0.163 | 0 |
| Ammoniacal nitrogen (mg/L) | 0.02 | 0.01 -0.05 | 64 |
| Total nitrogen (mg/L) | 0.522 | 0.194 -1.821 | 64 |
| pH | 7.4 | 6.9 -7.8 | 91 |
The results from 2007-08 indicate that the Paparoa Stream is affected by high phosphorus and E.coli concentrations. Dissolved oxygen (%) is also an issue with levels exceeding the recommended ANZECC guideline values on all sampling occasions. High algal biomass in the stream during the summer months is the most likely cause of low oxygen levels.
During 2007-08, total phosphorus also failed to comply with its relevant guidelines on all sampling occasions. Dissolved reactive phosphorus and E. coli only complied two and three times, respectively, through the year. The most likely source of E. coli and phosphorus in this catchment is run-off from pastoral land and poorly maintained septic tanks. Fencing stock out of waterways, riparian planting in the catchment and maintaining septic tanks would reduce the amount of contaminants entering the stream.
Trend analysis cannot yet be undertaken for this site as there is insufficient data.
Hakaru River
The Hakaru River originates in native bush and pine forestry in the Brynderwyn hills and flows south through farmland until it reaches the Topuni River. The Topuni River feeds into an arm of the Kaipara harbour. The underlying geology in the catchment is a mixture of volcanic acidic, and hard and soft sedimentary rock. The site is located at the bottom of the catchment, above the saline influence.
The results for 2007-08 for Hakaru River are summarised in the table below. These include the median, range and percentage of sampling occasions that complied with relevant guidelines. Please note that this site was only sampled on 10 sampling occasions in 2007-08. An asterisk in the table below denotes a median value outside the recommended guideline.
| Parameter | Median | Range | % comply with guideline |
| Temperature (deg. cel.) | 16.6 | 12.3 - 20.4 | - |
| Dissolved oxygen (mg/L) | 9.9 | 8.5 - 11.3 | 100 |
| Dissolved oxygen (% Sat.) | 101.05 | 91.8 -106 | 50 |
| Conductivity (mSm) | 18.15 | 15.1 - 18.9 | - |
| Water clarity (m) | 0.81 | 0.28 - 1.24 | 80 |
| Turbidity (NTU) | 10.75* | 7.2 - 50 | 0 |
| E. coli (n/100mL) | 384 | 134 - 7701 | 80 |
| Dissolved reactive phosphorus (mg/L) | 0.065* | 0.04 - 0.174 | 0 |
| Total phosphorus (mg/L) | 0.139* | 0.09 - 0.23 | 0 |
| Ammoniacal nitrogen (mg/L) | 0.045* | 0.01 - 0.2 | 50 |
| Total nitrogen (mg/L) | 0.759* | 0.372 - 1.791 | 30 |
| pH | 7.65 | 7.3 - 8.2 | 80 |
The results for 2007-08 indicate that water quality in the Hakaru River is highly impacted, with high levels of nutrients and turbidity. The medians for both total and ammoniacal nitrogen were also above the guideline values of 0.021mg/L and 0.614 mg/L respectively.
Turbidity, dissolved reactive and total phosphorus exceeded their respective guideline values on all sampling occasions. This relatively poor water quality can be linked to runoff from surrounding agricultural land use.
Trend analysis cannot yet be undertaken for this site as there is insufficient data.
Wairua River at Purua
The Wairua River above Whangarei flows west into the Kaipara Harbour. It is one of the major tributaries of the greater Wairoa River. The catchment upstream of the sampling site is predominantly pastoral. The river cuts through hard sediments along a low gradient. The Wairua River site at Purua is one of four sites in Northland that are part of the National River Water Quality Network administered by NIWA.
The results for 2007-08 for the Wairua River at Purua are summarised in the table below. These include the median, range and percentage of sampling occasions that complied with the relevant guidelines. Note: Dissolved reactive phosphorus and ammoniacal nitrogen results are only available for July 2007 to December 2007. An asterisk in the table below denotes a median value outside the recommended guideline.
| Parameter | Median | Range | % comply with guideline |
| Temperature (deg. cel.) | 17.7 | 12.2 - 22.9 | - |
| Dissolved oxygen (mg/L) | 8.7 | 5.2 - 9.9 | 92 |
| Dissolved oxygen (% Sat.) | 88.4* | 56.3 - 116.9 | 8 |
| Conductivity (mSm) | 12 | 10.1 - 13 | - |
| Water clarity (m) | 0.49* | 0.15 - 1.95 | 42 |
| Turbidity (NTU) | 14.5* | 5 - 33 | 8 |
| E. coli (n/100mL) | 83 | 26 - 2419 | 75 |
| Dissolved reactive phosphorus (mg/L) | 0.024* | 0.017 - 0.077 | 0 |
| Total phosphorus (mg/L) | 0.072* | 0.032 - 0.244 | 8 |
| Ammoniacal nitrogen (mg/L) | 0.061* | 0.024 - 0.203 | 0 |
| Total nitrogen (mg/L) | 0.867* | 0.172 - 2.163 | 33 |
| pH | 6.8* | 6.3 - 7.8 | 17 |
The results from 2007-08 indicate that the Wairua River is a highly impacted waterway, with poor dissolved oxygen levels, poor water clarity, elevated phosphorus and nitrogen levels and low pH. This relatively poor water quality is a result of intensive surrounding agricultural land use.
Low dissolved oxygen (% saturation) is a likely result of large macrophyte beds in the river.
Trend analysis on data from October 1996 to December 2007 indicates several positive trends, including decreasing nitrate nitrogen and total nitrogen. There is also a trend suggesting that pH is increasing. This is likely to be a beneficial trend for this site as pH is often below the optimum range for the protection of aquatic ecosystems.
Utakura River at Rangiahua Road Bridge
The Utakura River is fed by Lake Omapere, to the north of Kaikohe, and flows west into the Waihou River arm of the Hokianga Harbour. The catchment is dominated by farmland with areas of native forest, pine forest and manuka scrub.
The results from 2007-08 for the Utakura River are summarised in the table below. These include the median, range and percentage of sampling occasions that complied with relevant guidelines. Please note that this site was only sampled on 10 occasions in 2007-08. An asterisk in the table below denotes a median value outside the recommended guideline.
| Parameter | Median | Range | % comply with guideline |
| Temperature (deg. cel.) | 17.1 | 12.1 - 22.1 | - |
| Dissolved oxygen (mg/L) | 7.8 | 5.6 - 10.2 | 80 |
| Dissolved oxygen (% Sat.) | 83.9* | 53.3 - 94.9 | 0 |
| Conductivity (mSm) | 10.9 | 9.5 - 21.1 | - |
| Water clarity (m) | 0.465* | 0.37 - 0.75 | 10 |
| Turbidity (NTU) | 35.75* | 19.9 - 74 | 0 |
| E. coli (n/100mL) | 508 | 331 - 5475 | 60 |
| Dissolved reactive phosphorus (mg/L) | 0.020* | 0.01 - 0.058 | 30 |
| Total phosphorus (mg/L) | 0.096* | 0.05 - 0.17 | 0 |
| Ammoniacal nitrogen (mg/L) | 0.020* | 0.005 - 0.05 | 70 |
| Total nitrogen (mg/L) | 0.693* | 0.452 - 1.232 | 30 |
| pH | 7.0* | 6.6 - 7.2 | 10 |
The results for 2007-08 indicate that water quality in the Utakura River is severely impacted, with the medians of the majority of parameters not meeting the recommended guideline values.
In 2007-08, dissolved oxygen (%), turbidity and total phosphorus exceeded their relevant guideline values on all sampling occasions, and water clarity and pH exceeded on nine out of 10 occasions.
Trend analysis cannot yet be undertaken for this site as there is insufficient data.
Awanui River at Waihue Channel
This site is the lowest of three sites on the Awanui River system and is located directly downstream of the discharge from the Kaitaia oxidation ponds and upstream of the Waihue Channel. At this point, the Awanui River has flowed through more than 30km of agricultural land and the Kaitaia Township. The ‘River Environment Classification' identifies this site as a low elevation river with soft sediment geology and pastoral land use.
The results from 2007-08 for the Awanui River site at Waihue Channel are summarised in the table below. These include the median, range and percentage of sampling occasions that complied with the relevant guidelines. An asterisk in the table below denotes a median value outside the recommended guideline.
| Parameter | Median | Range | % comply with guideline |
| Temperature (deg. cel.) | 16.7 | 12.5 - 22.3 | - |
| Dissolved oxygen (mg/L) | 8.5 | 4.7 - 9.3 | 83 |
| Dissolved oxygen (% Sat.) | 83.3 | 50.5 - 107 | 0 |
| Conductivity (mSm) | 19.7 | 15.1 - 24.2 | - |
| Water clarity (m) | 0.50* | 0.3 - 1.2 | 10 |
| Turbidity (NTU) | 10.25* | 6.2 - 51 | 0 |
| E. coli (n/100mL) | 263 | 63 - 2613 | 75 |
| Dissolved reactive phosphorus (mg/L) | 0.050* | 0.01 - 0.12 | 9 |
| Total phosphorus (mg/L) | 0.125* | 0.08 - 0.209 | 0 |
| Ammoniacal nitrogen (mg/L) | 0.020 | 0.005 - 0.1 | 67 |
| Total nitrogen (mg/L) | 0.741* | 0.185 - 1.495 | 33 |
| pH | 7.5 | 7.1 - 8.5 | 75 |
The results from 2007-08 indicate that water quality at this site on the Awanui River is severely impacted. The medians for dissolved oxygen (% saturation), water clarity, turbidity, total nitrogen, and dissolved reactive and total phosphorus did not meet their respective guidelines.
Consistently high phosphorus levels at this site are of particular concern. The source of this phosphorus is likely to be run-off from pastoral land use within the catchment but the Kaitaia oxidation pond discharge directly upstream could also be a source.
Long term trend analysis at this site indicates that turbidity, dissolved reactive phosphorus, total phosphorus and ammoniacal nitrogen are all declining. However, there is a significant increasing trend in conductivity.
Mangere River at Knights Road
The Mangere River is a low-lying, sluggish tributary to the Wairua River, which flows through a mostly intensive agricultural catchment. The river begins as the Mangere Stream, which flows east out of the Pukenui forest near Whangarei. It becomes a river on the flats before joining the Wairoa River just west of Kokopu. For the most part, soft sedimentary rocks make up the underlying geology.
The results from 2007-08 for the Mangere River are summarised in the table below. These include the median, range and percentage of sampling occasions that complied with the relevant guidelines. An asterisk in the table below denotes a median value outside the recommended guideline.
| Parameter | Median | Range | % comply with guideline |
| Temperature (deg. cel.) | 15.15 | 11.5 - 20.2 | - |
| Dissolved oxygen (mg/L) | 8.4 | 6.4 - 9.7 | 100 |
| Dissolved oxygen (% Sat.) | 83.4* | 67.5 - 91 | 0 |
| Conductivity (mSm) | 16.65 | 15.6 - 18.2 | - |
| Water clarity (m) | 0.90 | 0.15 - 1.31 | 75 |
| Turbidity (NTU) | 7.65* | 1 - 33 | 25 |
| E. coli (n/100mL) | 876* | 435 - 24192 | 17 |
| Dissolved reactive phosphorus (mg/L) | 0.065* | 0.03 - 0.318 | 0 |
| Total phosphorus (mg/L) | 0.11* | 0.07 - 0.494 | 0 |
| Ammoniacal nitrogen (mg/L) | 0.065* | 0.01 - 0.35 | 17 |
| Total nitrogen (mg/L) | 1.200* | 0.232 - 3.062 | 8 |
| pH | 7.0* | 6.6 - 7.5 | 42 |
The Mangere River is one of the most impacted rivers in the regional network. Results from 2007-08 indicate that dissolved oxygen (%), turbidity, bacterial (E. coli), nitrogen and phosphorus levels are often above their recommended guideline values.
Dissolved oxygen is an issue at this site, as levels are consistently below the guideline range. Further investigation is due to be undertaken at this site to ascertain the diurnal oxygen patterns.
Long term trend analysis for this site indicates some positive trends. These include decreasing nitrate/nitrite nitrogen, total nitrogen, dissolved reactive phosphorus, total phosphorus and increasing water clarity. There is also an increasing trend in pH which, at this site, is likely to be beneficial as the pH is often below the optimum range for aquatic life.
Ruakaka River at Flyger Road
The Ruakaka River catchment is relatively small and runs east from Ruakaka forest to Bream Bay. The catchment is dominated by pastoral land with areas of the upper catchment native bush. The underlying geology at the site is mainly soft sediments.
The results from 2007-08 for the Ruakaka River are summarised in the table below. These include the median, range and percentage of sampling occasions that complied with the relevant guidelines. An asterisk in the table below denotes a median value outside the recommended guideline.
| Parameter | Median | Range | % comply with guideline |
| Temperature (deg. cel.) | 14.65 | 11.3 - 18.5 | |
| Dissolved oxygen (mg/L) | 8.45 | 5.9 - 9.9 | 92 |
| Dissolved oxygen (% Sat.) | 84.8* | 62.9 - 90.6 | 0 |
| Conductivity (mSm) | 22.1 | 19.8 - 24.9 | |
| Water clarity (m) | 0.57* | 0.3 - 0.76 | 42 |
| Turbidity (NTU) | 19.2* | 11.4 - 47 | 0 |
| E. coli (n/100mL) | 412 | 226 - 9804 | 67 |
| Dissolved reactive phosphorus (mg/L) | 0.103* | 0.05 - 0.14 | 0 |
| Total phosphorus (mg/L) | 0.175* | 0.11 - 0.304 | 0 |
| Ammoniacal nitrogen (mg/L) | 0.045* | 0.005 - 0.16 | 8 |
| Total nitrogen (mg/L) | 0.946* | 0.478 - 2.324 | 8 |
| pH | 7.15* | 6.7 - 7.5 | 50 |
The Ruakaka River is a highly impacted river, with poor water clarity and high nutrient levels. Results from 2007-08 indicate that dissolved oxygen (%), turbidity, water clarity, nitrogen and phosphorus levels are above their recommended guideline values on most sampling occasions.
Trend analysis cannot yet be undertaken for this site as there is insufficient data.
Manganui River at Mitaitai Road
The Manganui is a major tributary into the Wairoa River, flowing from the western fringes of the Marertu forest to join the Wairoa just east of Dargaville. The river runs through extremely low gradient, predominantly pastoral land, with some exotic forestry blocks scattered through the catchment. The underlying geology at the site is soft sediments.
The results from 2007-08 for the Manganui River are summarised in the table below. These include the median, range and percentage of sampling occasions that complied with the relevant guidelines. An asterisk in the table below denotes a median value outside the recommended guideline.
| Parameter | Median | Range | % comply with guideline |
| Temperature (deg. cel.) | 16.8 | 12.3 - 23.9 | - |
| Dissolved oxygen (mg/L) | 7.5 | 5.1 - 9 | 83 |
| Dissolved oxygen (% Sat.) | 80.6* | 51 - 101 | 8 |
| Conductivity (mSm) | 21.0 | 12.4 - 23.3 | - |
| Water clarity (m) | 0.6* | 0.2 - 0.97 | 50 |
| Turbidity (NTU) | 10.7* | 6 - 114 | 0 |
| E. coli (n/100mL) | 833* | 20 - 11199 | 45 |
| Dissolved reactive phosphorus (mg/L) | 0.05* | 0.03 - 0.075 | 0 |
| Total phosphorus (mg/L) | 0.109* | 0.05 - 0.21 | 0 |
| Ammoniacal nitrogen (mg/L) | 0.04* | 0.005 - 0.08 | 42 |
| Total nitrogen (mg/L) | 0.62* | 0.118 - 2.01 | 42 |
| pH | 7.2 | 6.8 - 8.2 | 50 |
Water quality in the Manganui River has been heavily impacted by surrounding land use. The Manganui River is the worst river in the network based on water quality. In 2007-08, the medians of eight parameters did not meet their respective guideline values.
High levels of all nutrients, in particular dissolved reactive and total phosphorus, indicate that agricultural run-off is the source of contamination in the Manganui catchment. In 2007-08, the median for both dissolved and total phosphorus was above the respective guideline trigger values.
Elevated levels of phosphorus are usually a sign that fertiliser, which has been applied to land, is not being absorbed by the soil but is being washing off the land during rainfall events and entering waterways. Another possible source of phosphorus is soil erosion in the riparian management zone. Better riparian management and more efficient fertiliser application would reduce the amount of phosphorus in waterways.
During 2007-08, dissolved oxygen (%) was not within the optimum range for the protection of aquatic ecosystems on 11 out of the 12 sampling occasions. These levels of dissolved oxygen are to be expected in a slow moving water body with a low gradient, such as the Manganui River.
Trend analysis on seven years of data for this site indicates that there are positive decreasing trends in nitrite/nitrate nitrogen (NNN) and ammoniacal nitrogen levels. However, there are negative increasing trends in dissolved reactive phosphorus and temperature. Temperature is increasing at a rate of 0.44 Degrees Celsius per year.
Trends in Water Quality
Long-term trend analysis was carried out using a Seasonal Kendall test, which eliminates any seasonal influence on the results. The table below shows water quality trends for 18 of the RWQMN sites that have five or more years data. The start of the dataset for trend analysis for each site is shown in brackets under the site name. The end date for the four NIWA sites is December 2007.
Only significant trends are shown. Significant trends are those with at least a 95% confidence level i.e. 95% likelihood that the trend is "real". It must be highlighted that 5 years data is a minimum for carrying out long term trend analysis and that these trends are likely to change as more data becomes available.
In the table below, an ‘up' arrow indicates an increasing trend, a ‘down' arrow indicates a decreasing trend; a green arrow indicates a positive trend and a red arrow indicates a negative trend. A blue arrow has been used where it is not yet known if the trend is positive or negative.
There were no significant trends at a 95% confidence level for E. coli at any of the sites. Many of the sites could not have trend analysis done for ammoniacal nitrogen, as too many results were found to be below detection limits. These are shown as NA in the table below. Some sites had insufficient data for certain parameters to carry out trend analysis. These are shown as ID in the table.
Note: the decreasing trend marked with an asterisk for the four NIWA sites is for nitrate (NO3) only, not NNN.
***
Conductivity
Conductivity (COND) is a measure of the amount of ions in the water column and can be used as in indicator of nutrient enrichment. There is an increasing trend in conductivity at three sites; Awanui River at Waihue channel, Mangahahuru at Apotu Road and Waipapa at Forest Ranger. Although this is usually an indication of increasing nutrient enrichment in a water body, most of these sites have a positive downward trend in nutrient levels. These results will therefore require further analysis and investigation.
Dissolved Oxygen
There is an increasing trend in dissolved oxygen (DO) at Mangahahuru at Apotu Road, Whakapara River and Victoria River and a decreasing trend at Kaihu River and Waipoua River. The decreasing trend in the Waipoua and Kaihu River is likely to be a negative trend as the DO at these sites is below the optimum range for aquatic ecosystem health.
The increasing trend at Mangahahuru, Whakapara and Victoria could also be a negative trend as although DO is required for freshwater fauna to survive, an extremely high DO during the day could indicate that DO lags during the night or early morning. Mangahahuru at Apotu Road and Whakapara River sites are both dominated by Egeria densa (oxygen weed), which produces copious amounts of oxygen during the day whilst photosynthesising but not at night, which leads to huge diurnal variations in oxygen levels.
Water Clarity
Trend analysis indicates that water clarity has increased (improved) at six sites; Kaihu River, Mangahahuru Stream, Mangere River, Waipapa River, Waitangi at Waimate and Whakapara River. Water clarity in the Kaihu River has had a significant change of 18 cm per year. The improvement in water clarity at these sites could be a result of increased riparian planting or better land management in the surrounding catchments, which would both result in decreased run-off entering rivers and streams. An improvement in the quality of point-source discharges in these catchments may also be a factor. Water clarity at the Victoria River has a decreasing trend of 5 cm per year, which may be due to land use changes in the catchment.
Bacterial Contamination
No sites have a significant trend in bacterial levels (E. coli). This is an improvement as historically, the Mangere River had an increasing (negative) trend in E. coli.
Nutrients
In general, nutrient levels are showing decreasing trends at the majority of sites, including decreasing dissolved reactive phosphorus, ammoniacal nitrogen, nitrite/nitrate nitrogen and, in turn, total nitrogen and phosphorus. This could be as a result of improving farm management practices throughout the region, including increased stock exclusion from waterways, riparian planting and better fertiliser application. It also could be as a result of better quality point source discharges, for example, discharges of farm dairy effluent or those from oxidation ponds. However, many of the sites with decreasing trends still have very high nutrient levels and there is therefore still a long way to go before desirable levels are met.
Nutrient levels are of concern in the Waipoua River as both dissolved reactive and total phosphorus levels are increasing. This could be as a result of land movement activity in the catchment.
PH
Trend analysis shows an increasing trend in pH at eight of the 18 sites analysed. This trend is beneficial at the majority of sites as pH is generally below the optimum range of 7.2 to 7.8 for aquatic life. An increase in pH should therefore be of benefit to aquatic ecosystems.