Macroinvertebrate Monitoring
Within this section…
Different stream macroinvertebrates show different responses to changes in their environment such as water quality or low flows and different species show different tolerances to pollution. Macroinvertebrates are good indicators of local conditions because they tend to stay in one place and are affected by the environmental conditions over an extended period of time, unlike water quality results, which tend to be spot measurements, i.e. that exact point in time. Also stream macroinvertebrates are the best indicator of the life supporting capacity of a stream or river, as they are usually near the middle of the food web and an important component of stream ecosystems.
This report summarises the results from the February/March 2006 round of macroinvertebrate monitoring carried out at four Waiarohia Stream sites, the 19 River Water Quality Monitoring Network sites, four Otarao catchment sites and six rivers both upstream and downstream of different resource consent activities throughout Northland.
The monitoring was carried out following the standard protocols developed by the NZ Macroinvertebrate working group in 2001; ‘Protocols for sampling macroinvertebrates in Wadeable streams' (Stark et al. 20011). Four standard biotic indices were calculated to assess water quality and biological health at the sites;
- Species richness
- Macroinvertebrate Community Index (MCI)
- Semi Quantitative Macroinvertebrate Community Index (SQMCI)
- The percentage of Ephemeroptera (mayflies), Plecoptera (stoneflies) and Trichoptera (caddisflies) taxa (%EPT taxa)
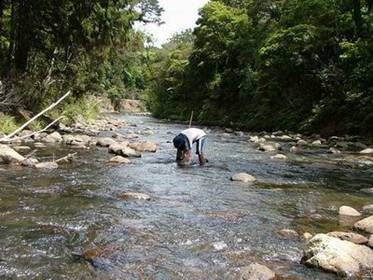 Staff carrying out macroinvertebrate monitoring.
For more information on sampling methods and biotic indices check out the detailed macroinvertebrate monitoring report for 2006 on the Regional Council website.
Biotic indices results
The table below shows the four biotic index scores for all sites monitored in 2006. MCI, SQMCI and %EPT taxa have been colour coded to show the range in water quality or degradation at each site. For example, red indicates poor water quality and a severely degraded site, through orange and yellow which indicate moderate water quality, to green which indicates good water quality or a stream still in a relatively ‘pristine' state (very little impact from humans).
Waiarohia sites
| Site description | Species richness | MCI | SQMCI | %EPT taxa |
| Rust Ave Bridge | 18 | 79 | 4.45 | 16.7 |
| Russell Road Bridge North | 17 | 85 | 4.64 | 23.5 |
| Kamo tributary | 14 | 70 | 2.82 | 14.3 |
| Whau Valley Road | 19 | 86 | 4.16 | 26.3 |
RWQMN sites
| Site description | Species richness | MCI | SQMCI | %EPT taxa |
| Awanui @ Waihue channel | 18 | 77 | 4.11 | 22.2 |
| Awanui @ FNDC water take | 17 | 92 | 4.52 | 47.1 |
| Victoria @ Thompsons Bridge | 18 | 78 | 3.99 | 22.2 |
| Waipapa @ Forest Ranger | 29 | 125 | 6.04 | 55.2 |
| Waitangi @ Waimate North | 24 | 108 | 5.83 | 45.8 |
| Waitangi @ Watea | 16 | 69 | 3.89 | 6.3 |
| Whakapara @ Cableway | 11 | 80 | 4.35 | 36.4 |
| Mangahahuru @ Apotu Road | 10 | 78 | 3.47 | 20 |
| Mangahahuru @ Main Road | 22 | 86 | 5.08 | 31.8 |
| Wairua @ Purua | 11 | 66 | 3.99 | 0 |
| Mangere @ Knights Road | 23 | 80 | 4.36 | 13.0 |
| Mangakahia @ Titoki | 11 | 89 | 4.10 | 27.3 |
| Opouteke @ Suspension Bridge | 14 | 77 | 2.68 | 35.7 |
| Mangakahia @ Twin bridges | 16 | 78 | 3.14 | 12.5 |
| Punakitere @ Taheke Recorder | 19 | 98 | 4.49 | 47.4 |
| Waiotu @ SH1 | 15 | 80 | 3.98 | 33.3 |
| Kaihu @ gorge | 20 | 79 | 4.04 | 20.0 |
| Waipoua @ SH12 Rest area | 20 | 136 | 8.11 | 65.0 |
| Manganui @ Permanent station | 13 | 80 | 4.22 | 7.7 |
Otarao catchment sites
| Site description | Species richness | MCI | SQMCI | %EPT taxa |
| Otarao near Mangakahia River | 11 | 70 | 4.14 | 0 |
| Ruahuia at Viaduct | 20 | 133 | 7.39 | 60 |
| Otarao at Norvil Road | 10 | 78 | 4.18 | 0 |
| Otarao above Mangakahia Road | 15 | 83 | 4.36 | 13.3 |
Resource consent sites
| Site description | Species richness | MCI | SQMCI | %EPT taxa |
| Dam B downstream | 17 | 89 | 3.69 | 29.4 |
| Dam B upstream | 31 | 123 | 5.11 | 54.8 |
| Dam C downstream | 15 | 89 | 3.83 | 20 |
| Dam C upstream | 13 | 128 | 7.23 | 53.8 |
| Oxidation pond A downstream | 12 | 71 | 3.06 | 0 |
| Oxidation pond A upstream | 8 | 57 | 3.82 | 0 |
| Meat works downstream | 10 | 69 | 4.28 | 10 |
| Meat works upstream | 8 | 80 | 4.00 | 25 |
| Oxidation pond B downstream | 22 | 98 | 4.54 | 40.9 |
| Oxidation pond B upstream | 18 | 101 | 6.66 | 50.0 |
| Quarry downstream | 22 | 112 | 6.65 | 36.4 |
| Quarry upstream | 15 | 100 | 4.07 | 33.3 |
Interpretation of MCI & SQMCI (Boothroyd & Stark 2000[2])
| Interpretation | MCI score | SQMCI score |
| Clean water | >120 | >6.0 |
| Doubtful quality or possible mild pollution | 100-119 | 5.0-5.99 |
| Probable moderate pollution | 80-99 | 4.0-4.99 |
| Probable severe pollution | <80 | <4.0 |
Colour codes for %EPT taxa
| >60% EPT taxa |
| 40 – 59.9% EPT taxa |
| 20 – 39.9 % EPT taxa |
| Less than 20% EPT taxa |
1 Stark, J.D.; Boothroyd, I.K.G.; Harding, J.S.; Maxted, J.R. and Scarsbrook, M.R. (2001). Protocols for sampling macroinvertebrates in wadeable streams. New Zealand Macroinvertebrate Working group Report No. 1. Prepared for the Ministry for the Environment. Sustainable Management Fund Project No. 5103, 57p.