Particulate Matter
Within this section…
Particulate matter is a collective term used to describe very small solid or liquid particles such as dust, fume, smoke and mist or fog. PM10 is particulate matter that is less than 10 microns in diameter. PM10 originates from both natural (wind blown dust, forest fires, volcanic emissions, sea spray or pollen) and anthropogenic activities including automobile exhausts, solid fuel burning, and industrial emissions.
Smoke has high levels of PM10, which is easily inhaled and can harm people's health. People most susceptible to the effects of inhaling PM10 include the elderly; those with existing respiratory disease; those with cardiovascular disease; those with infections such as pneumonia; and children.
Sampling PM10
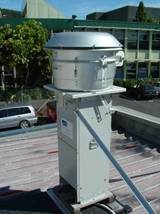 A high volume sampler.
Particulate matter is sampled at three locations in Northland, Water Street and Robert Street in Whangarei City and at Donald Road in Kaitaia. PM10 levels at Water Street, Whangarei and Donald Road, Kaitaia are monitored using a high volume sampler as shown in the photograph. The sampler collects inhaleable particulate matter on a glass fibre filter over a 24 hour period. At the end of the sampling period, the filter is carefully removed, placed in a conditioning chamber and then weighed. A sample is collected every 3 to 6 days.
While PM10 levels at Robert Street are monitored using a Beta Attenuation Monitor (BAM), which continuously samples the air onto a specially prepared filter tape. The BAM is connected to a computer which records a result every 10 minutes. The data is periodically downloaded and converted to 24 hour averages (midnight – midnight).
The results are compared to the National Environmental Standard for PM10, which is no more than one exceedance in a 12-month period of the limit of 50 mg/m3. Another method of reviewing the results is to compare them to the environmental performance criteria developed by the Ministry for the Environment shown in the table below.
| Category | Value relative to guideline | Comment |
| Excellent | Less than 10% of the guideline | Of little concern, if maximum values are less than a tenth of the guideline, average values are likely to be much less |
| Good | Between 10% and 33% of the guideline | Peak measurements in this range are unlikely to affect air quality |
| Acceptable | Between 33% and 66% of the guideline | A broad category, where maximum values might be of concern in some sensitive locations but generally they are at a level which does not warrant dramatic action |
| Alert | Between 66% and 100% of the guideline | A warning level, which can lead to the guideline being exceeded if trends are not curbed |
| Action | More than 100% of the guideline | Exceeding the guideline is a cause for concern and warrants action if it occurs regularly |
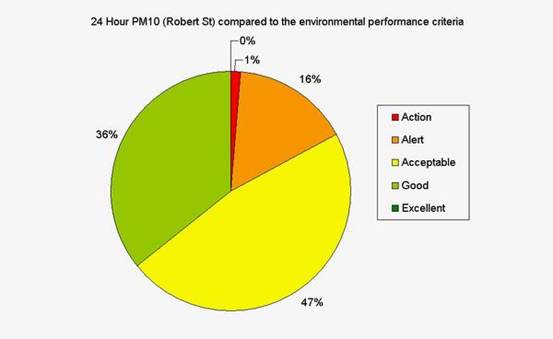
The results are presented in pie graphs where each segment represents the percentage of time that air pollution levels fall into the categories above. As an example, the more green there is in the pie graph, the better the overall air quality with respect to that pollutant. Our aim is that air quality in the region does not fall into the ‘Action' (red) category at any time and that pollution levels rarely fall into the ‘Alert' (orange) category.
Results for Water Street
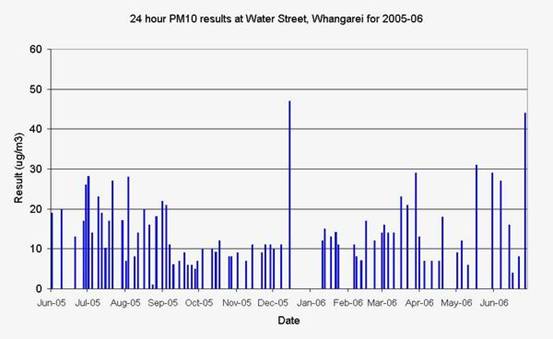
Monitoring results from the PM10 high volume sampler indicate that the standard was not exceeded at the Water Street site during 2005-06, although one result in December 2005 (47 mg/m3) and another in June 2006 (44 mg/m3) came reasonably close to the limit. The 24 hour period results are shown in the graph below.
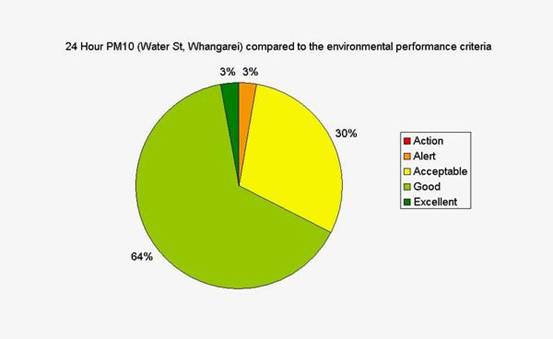
When compared to the environmental performance criteria developed by the Ministry for the Environment the results indicate that air quality in relation to PM10 at Water street in Whangarei is (on average) good or excellent for two out of every three days. This is shown in the pie graph below.
Results for Robert Street
Results from the Robert Street site indicate occasional elevated readings and one exceedance of the National Environmental Standard of 50 mg/m3 on 27 June 2006, reaching 52 mg/m3 (shown in the graph below). The standard allows one such exceedance in a 12 month period. This means if the air quality exceeds the standard again before 27 June 2007, the Northland Regional Council will need to formally notify the public about the details of the exceedance, in a local paper.
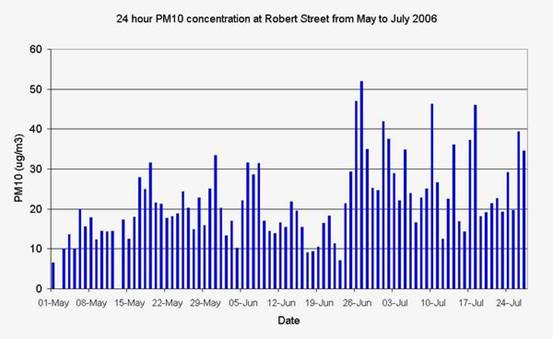
While the air quality within the central Whangarei city area is acceptable or good more than 80% of the time, there can be periods where cool calm conditions enable the concentration of air pollution to build up.
During cool calm inversion conditions smoke becomes trapped in a layer above the ground. Previous studies (2001) have revealed that the majority of winter time PM10 in Whangarei city is sourced from domestic fires. The photograph below shows an inversion layer over Whangarei city formed from cool calm weather conditions, allowing the build up of air pollution.
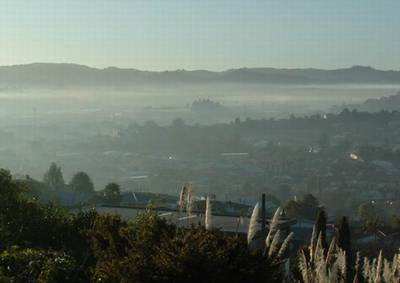 Whangarei city with an inversion layer above it.
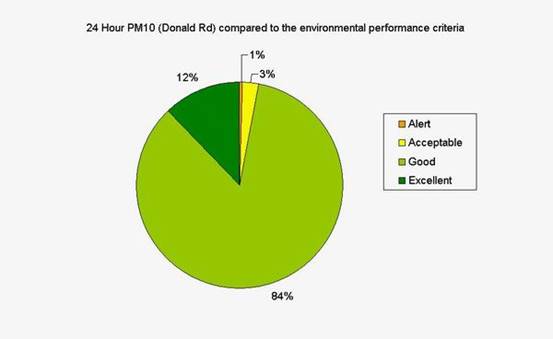
Results for Donald Road
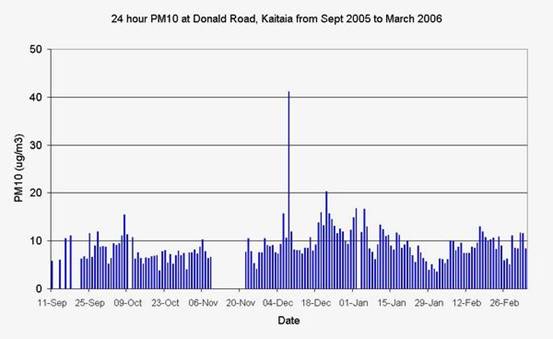
The results at Donald Road, show that the PM10 results for the Kaitaia airshed are much lower compared to Whangarei. This is reflected in the annual average PM10 results, with a much lower 9 mg/m3 in Kaitaia compared to 21 mg/m3 in Whangarei city. There is one elevated result as shown on the graph below, which occurred on 8 December 2005. This resulted from the burning of waste vegetation on a nearby property.
The sampler at Donald Road also measures PM2.5 and PM1.0 (2.5 and 1 microns diameter respectively). The impact of the fire on the concentrations of different sized particulate matter is shown in the graph below.
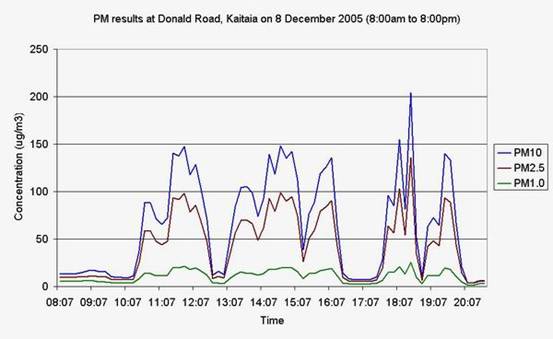
Both PM10 and PM2.5 display significant increases while the fire was burning, while PM1.0 shows some variation, but not to the same order of magnitude. Despite the impact of the nearby fire, the average 24 hour PM10 was 41 mg/m3, still below the National Environmental Standard of 50 mg/m3.
The better air quality in Kaitaia is apparent in the pie graph below, where PM10 levels are good or excellent for approximately 96% of the time.