Update to river flood maps
In late November 2021 we released a new update to Northland’s region-wide river flood maps, to help us all better understand the risks and plan for the future.
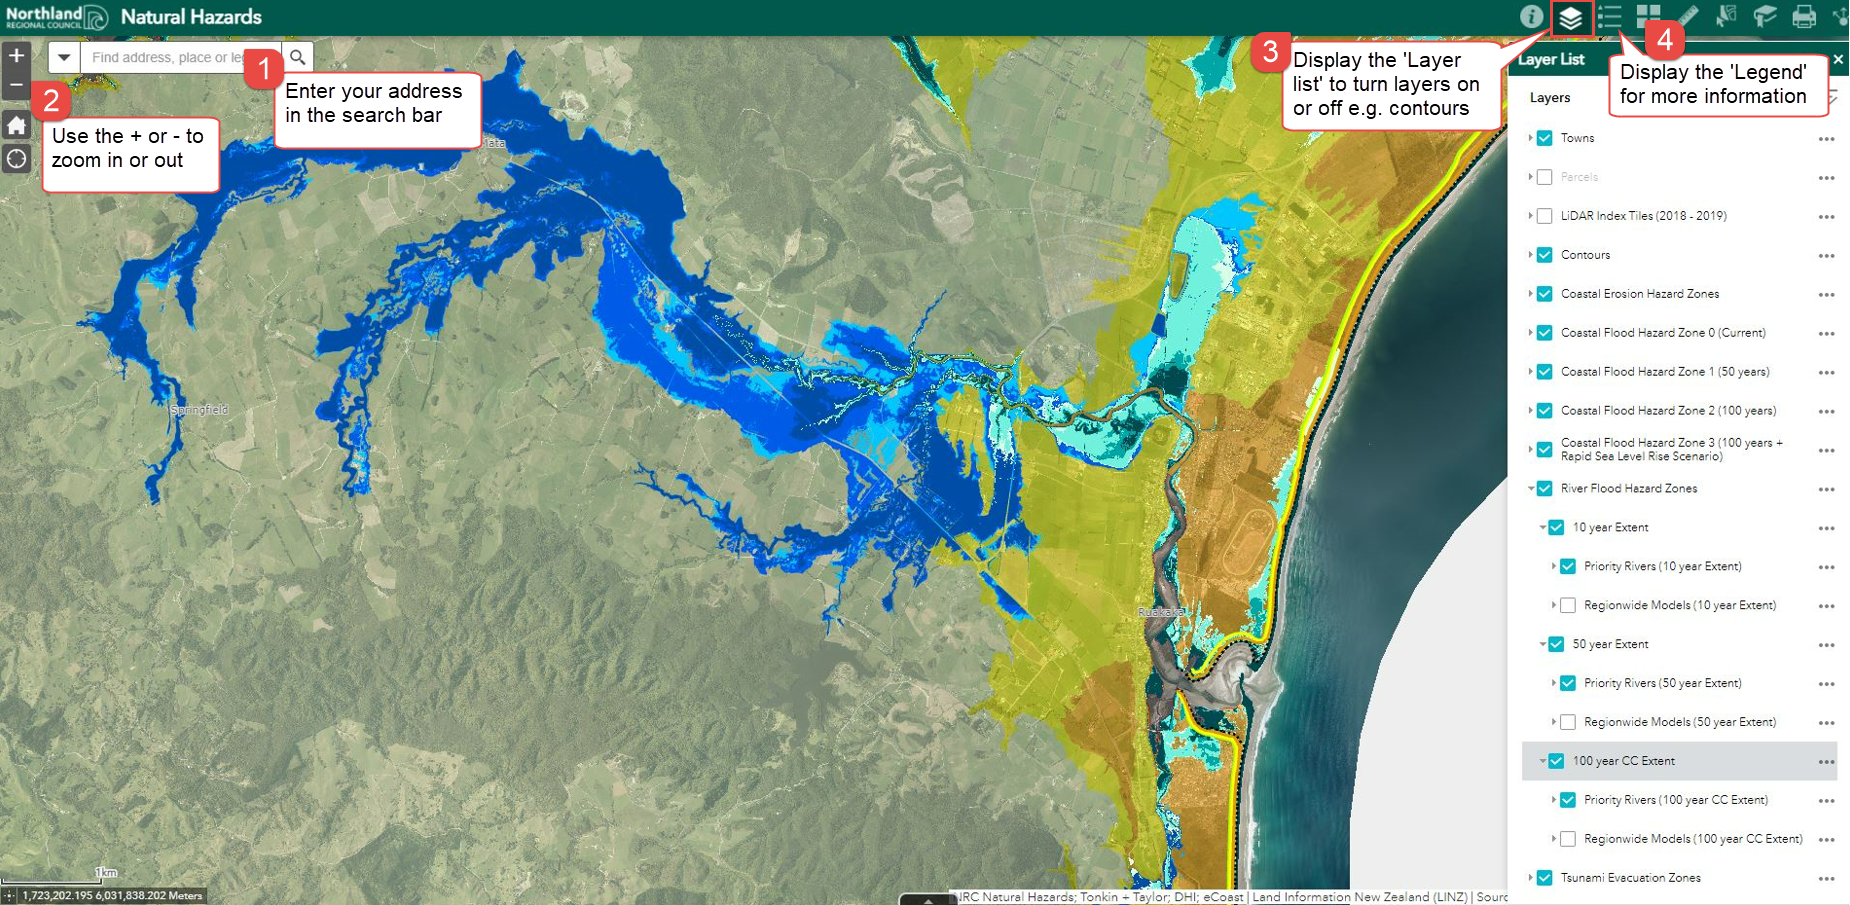
How to access the river flood maps
Disclaimer
Read the Flood Maps disclaimer (PDF, 263KB)
The updated river flooding maps are all available on our river flood (natural hazards) map viewer. You will need to select the layers on the side to see each one.
We recommend using Firefox or Google Chrome to view these maps on desktop or tablets. The maps are not optimised for viewing on mobile phones and may not load properly.
Find your way around the maps
About the maps
These new maps allow council, hapū and iwi, and the community to better understand the risk areas and potential impact on Northland communities.
The maps show the likely extent of river flooding during significant flooding events. They replace the previous flood susceptible layers in our online mapping and are in addition to the ‘Priority Rivers’ flood maps we already have.
The maps are developed in line with best practice and modern techniques, using expert practitioners and the best information available.
Frequently asked questions
These questions and answers explain what the river flood hazard maps contain, how they were developed and what they might mean for you.
Is river flood mapping a new thing?
No. River flooding is the most common natural hazard we face in Te Taitokerau, and we’ve been working for many years to understand and reduce the risks to life and property.
We already have river flood hazard maps for 28 Northland catchments (Priority Rivers) identified as having the highest level of potential flood risk, and have developed flood risk management plans for some of our catchments together with the communities, tangata whenua, district councils and other agencies.
These latest maps cover the region’s remaining river catchments. Once you open the maps on the viewer you will see that certain catchments are covered by the ‘Priority Rivers’ and the new “Regionwide” flood maps. The Priority Rivers flood maps take precedence in these cases. However, a few of these Priority River maps have been replaced by the Regionwide maps. The listing of these can be found by downloading: Regionwide River Catchments Modelling Listing (PDF, 335KB)
How many properties are in the mapped areas?
The new regionwide river flood maps show just over 40,000 affected properties in total, with varying degrees of flood susceptibility. The new maps have identified an additional 17,000 affected properties (there were just under 23,000 properties identified in previous mapping).
What do the river flood maps show?
Three different zones show the potential extent of river flooding under four scenarios:
- Zone 1: The size of flood extent that has a 10% annual probability of happening.
- Zone 2: The size of flood extent that has a 2% annual probability of happening.
- Zone 3: The size of flood extent that has a 1% annual probability of happening and takes into account climate change effects.
The lower the probability, the bigger the flood. Find out more about how the flood maps were developed: Fact sheet - River flood map development (PDF, 154KB)
How are the river flood maps developed?
Flood maps are developed using computer models taking into consideration historic flood levels, topography, rainfall and river flows to provide an indication of areas potentially exposed flood risk.
The new maps are more accurate and take into account climate change impacts.
Find out more about how the flood maps were developed: Fact sheet - River flood map development (PDF, 154KB)
What is “Annual Exceedance Probability” and “Average Recurrence Interval”?
They’re effectively just different ways to describe the same thing – the size of a flood event.
Annual Exceedance Probability (AEP) is the probability that a flood of a certain size will happen in any given year. Average Recurrence Interval (ARI) is the average time period between floods of a different size.
An AEP of 10% and an ARI of 10 years describes a flood event of the same size.
Can a 100-year Average Recurrence Interval flood happen more than once in 100 years?
Yes – it’s just a statistical average. You could have a 100-year period with more than one flood of this size, or no floods at all of this size.
How are the maps used?
The maps are used as part of decision-making to avoid, minimise or mitigate the risks of river flooding.
For example, district councils will use the maps to manage where and how development occurs in areas at risk, through updated rules in district plans. This must be in line with Northland Regional Council’s Regional Policy Statement (RPS), which sets the direction on how natural hazards are to be managed in district plans (and gives effect to central government policy) – see section 7 of the RPS on our website: www.nrc.govt.nz/newRPS
District councils should also use the maps in resource consent and building consent processes to manage risk in relation to specific projects.
These maps are also used by Northland Regional Council to plan for emergencies and adaptation to climate change risks.
When /how do district councils incorporate these maps into their district plans?
District councils will be required to incorporate the region-wide flood maps into their district plans and to develop associated rules. The process will likely be different for each district council as their district plans are at different stages, however this is likely to be either via a ‘plan change’ to their current district plan or via the full district plan review process. Whangarei District Council will notify the new regionwide flood maps as part of a future Natural Hazards plan change, as required under the Regional Policy Statement (RPS). The regionwide river flood hazard maps will seek to replace the operative Flood Susceptible Area overlay. Along with the new flood hazard maps, a future Natural Hazards plan change will seek to include provisions that manage subdivision, land use and development within the Flood Hazard Areas, in line with the directives of the RPS.
Far North District Council’s proposed District Plan, when notified in 2022, will incorporate the new maps developed by Northland Regional Council.
Kaipara District Council plans to release its draft District Plan for feedback in May 2022. The intention is that the region-wide river flooding maps will inform the natural hazards chapter of the draft plan.
Will this information go on my property file?
Like regional council, district councils are legally obliged to make hazard information available, so it will become part of the property information record including LIMs and PIMs.
What does it mean for my house insurance?
We can’t advise you about what effect this new river flood information may have on your insurance. Different insurance providers will have different policies, and we suggest you contact your insurer directly to discuss your specific policy.
I’ve never experienced flooding before – why is my property affected?
The mapped areas are not necessarily a record of where land has flooded in the past. They are a result of an assessment where land may flood during a large or extreme flood event in the future. While you may not have experienced flooding before, there is no guarantee it won't happen in the future.
What if I want to provide feedback or I disagree with the mapped area on my property?
Council welcomes any information that helps build our knowledge of flood history and flood behaviour in the region. If you have information that you feel should be considered, please get in touch with us at Northland Regional Council: P 0800 002 004 | E info@nrc.govt.nz
How can flooding affect my property? What does “at risk” mean?
Flood behaviour can be complex, but generally flooding happens due to high-intensity rain causing run-off, the overflowing of streams and rivers, or a combination of the two.
The modelling and mapping doesn’t provide detailed information on exactly how your property is affected (e.g. the impact of flooding on your home or other structures). A property identified as ‘at risk’ means it sits within the area mapped as being affected by water in a modelled flood event.
My home is on a hill – why am I affected?
Significant rain at the top of a hill will flow over the ground and concentrate in low lying gullies, channels, roads and surface depressions. The speed and depth of floodwater may still be significant enough to cause damage.
My property’s not in a mapped area – is it safe from flooding?
While the mapping is based on the best information and modelling we have available, it’s always possible that flooding may affect an area of the region not currently identified in the flooding mapping.
What’s the difference between flood hazard and flood risk?
A flood hazard relates to the flood itself – things like its speed and depth. A flood risk is potential consequences of flooding for people, property and infrastructure – the risk will change depending on the land use exposed to the hazard.
Who can I contact for more information?
Northland Regional Council: P 0800 002 004 | E info@nrc.govt.nz
Technical reports