August 2025 climate report
23 Sep 2025, 11:00 AM
Key take away from this report
Spring temperature and rainfall amounts are expected to be near average for Northland.
Summary
- Northland region averaged 94.3% of normal expected rainfall for August, with the highest rainfall around Kaikohe and the Eastern Hills.
- River flows in the Far North are lower than expected for this time of year but are “above average” throughout the rest of the region.
- Groundwater levels are generally higher than expected at the end of winter across the region.
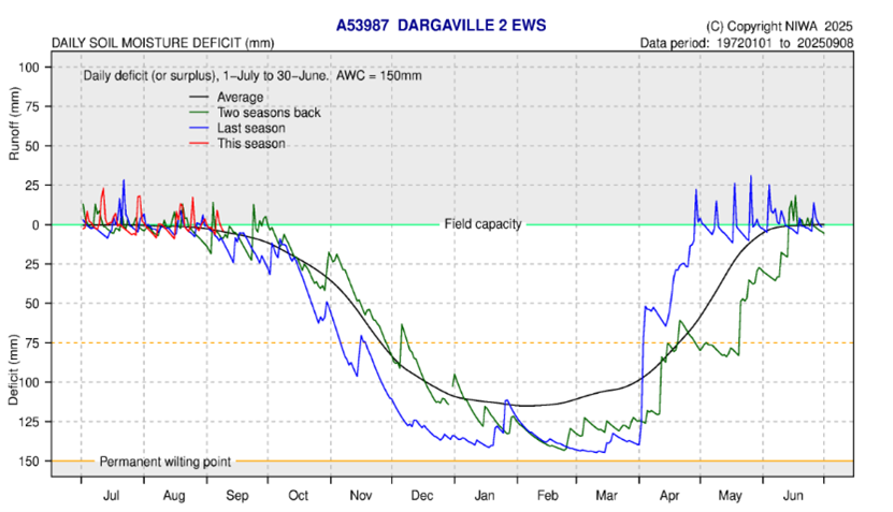
- Soil moisture in Northland is at field capacity, with rainfall events causing run off, of varying significance depending on rainfall totals.
- Spring is expected to be “near average” or “above average” in Northland in relation to expected temperature and rainfall.
Rainfall
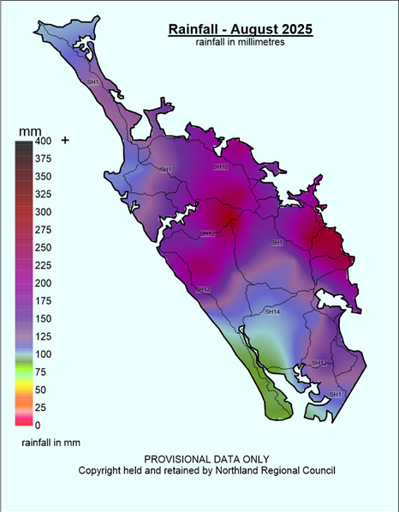
Northland region averaged 139.5 mm of rainfall for August, which is 94.3% of normal expected (long term median) for the month. The highest rainfall totals were in the center of the region and across to the east with the maximum recorded in Kaikohe, with 313.7 mm, 184.5% of normal expected, followed by 280 mm in Whakapara (Figure 1).
The lowest rainfall totals were recorded in Ruawai with 89mm, 60% of normal expected, and the Poutō peninsular with 92.5 mm.
For the Winter months (June – August), Northland has recorded average rainfall, with a median for the season of 106% of expected. The highest amounts were in Kaikohe with 177% and eastern hills Waitangi 151%, Otiria 147% and Ngunguru 144%. While the far north (Kaitaia 78%, Cape Reinga 82%) and lower west coast across to the east between Dargaville (91%) and Bream Bay (88%) had the lowest percentage’s of normal rainfall for winter (Figure 3).
Figure 1, 2 and 3: August 2025 rainfall distribution for Northland in mm, and in percentage of median. Along with Winter 2025 rainfall percentage of median.
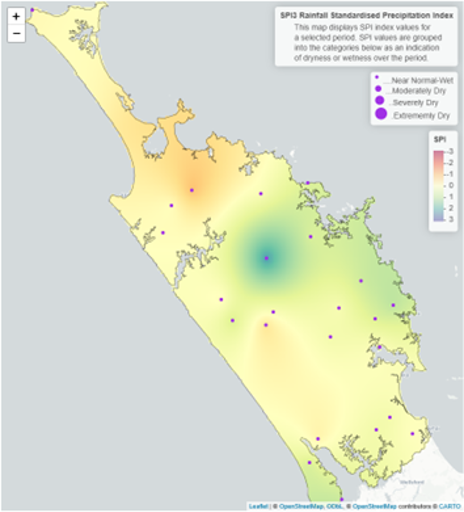
The standardized rainfall map for winter (3 months scale) shows the far north is drier than expected, however the region is near normal, with only the area around Kaikohe being “wet”. On a six-month scale from March the region is generally wet, with only areas in southern Northland being “near normal” (Figure 4 and 5).
Figure 4 and 5: Standardised rainfall for Northland on a 3-month scale (June - August) and a 6-month scale (March - August).
River Flows
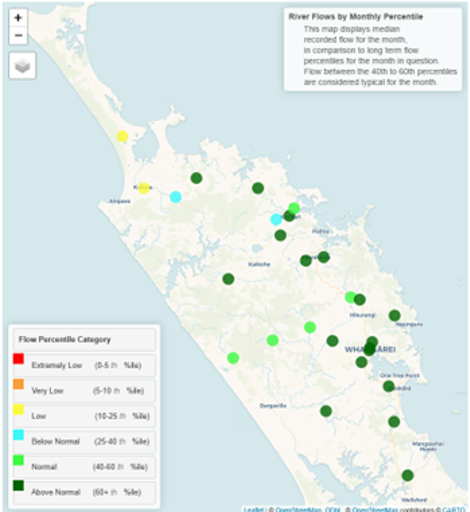
Reflecting the rainfall distribution through August, and most of Winter, flows in far north catchments of Northland are currently lower than expected. While the east coast is recording above normal flows (Figure 6). There have been several rainfall events that have caused low levels of flooding in Northland during the winter, these were concentrated around the Kerikeri and Whangārei areas.
Figure 6: River flows in Northland for August 2025.
Groundwater
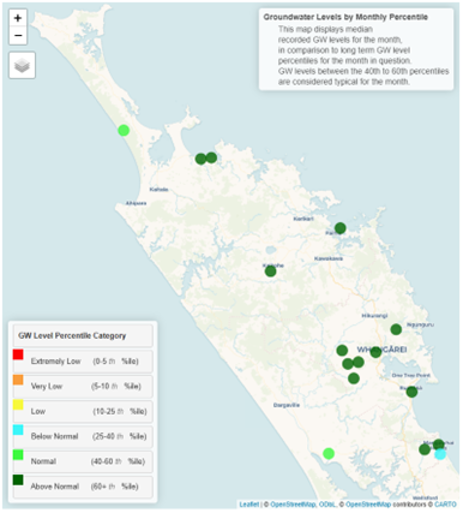
In general Ground water levels are high across Northland. With Key aquifers all “Above Normal” except in the Aupōuri and Ruawai which are currently at “Normal” August water levels and one area in Mangawhai which is “Below Normal” (Figure 7).
Figure 7: Groundwater levels in Northland’s primary monitored aquifers for August 2025.
Soil moisture
Summary of modelled soil moisture data from NIWA
Soil moisture levels in Northland are at Field capacity in mid-September and have been all winter. The level of run off has varied between monitoring sites depending on rainfall levels. Soil moisture deficit is calculated based on incoming daily rainfall (mm), outgoing daily potential evapotranspiration (mm), and a fixed available water capacity (the amount of water in the soil 'reservoir' that plants can use) of 150 mm”.
Figure 7: Calculated daily soil moisture values at key areas around Northland, courtesy of NIWA, data ending 11th September 2025
Climate Outlook for September – November 2025
Summary of climate forecasts from NIWA
At the end of August La Niña patterns became established around New Zealand, however the wider Pacific is still being driven by neutral ENSO and Southern Oscillation conditions. It is expected that La Niña conditions will be favored in spring and early summer (60% likelihood) before returning to neutral. The outlook is for higher than normal pressure to the south and east, with most weather events coming from the northeast. In Northland these weather patterns are likely to result in “near average” or “above average” temperatures and rainfall throughout spring. While river flows and soil moisture levels are expected to be “near average”.
NIWA’s full outlook can be found at: Seasonal Climate Outlook (NIWA)
Table 1: Forecasted likelihood of above, near or below average climate conditions for Northland from September – November 2025
(Expressed as % likelihood).
| Temperature | Rainfall | Soil moisture | River flows | |
| Above average | 45• | 40• | 25 | 25 |
| Near average | 40• | 35• | 40• | 40• |
| Below average | 15 | 25 | 35 | 35 |

