Hydrological Climate Report for September 2025
10 Oct 2025, 9:21 AM
Key take away from this report
The Northland Region experienced near normal rainfall during September, and most river flows and groundwater levels are close to average for the month.
Summary
- Rainfall recorded in Northland was average for September.
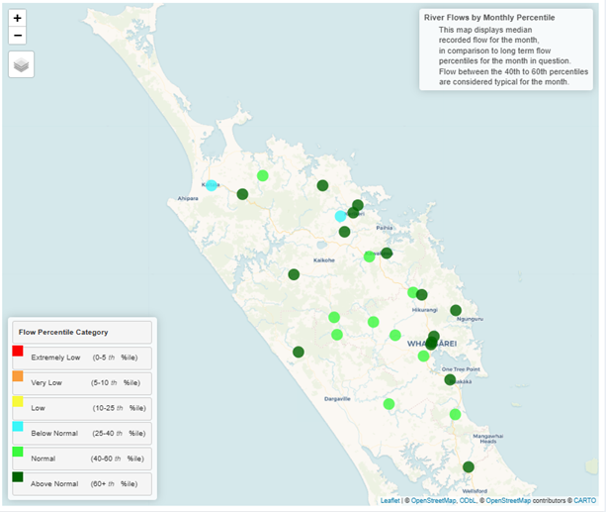
- Most of Northland’s rivers have flows “near normal” or “above normal”.
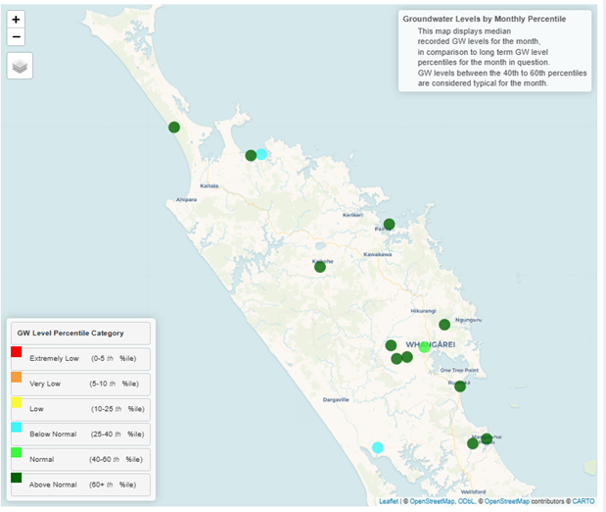
- Regional groundwater levels are “near normal”, or “above normal”, apart from two sites at Coopers Beach and Ruawai.
- Soil moisture through the region is near field capacity, and two rainfall events caused minor run-off.
- Earth Sciences New Zealand (ex-NIWA) climate outlook suggests rain will be “near normal” in Northland for the next three months, October to December.
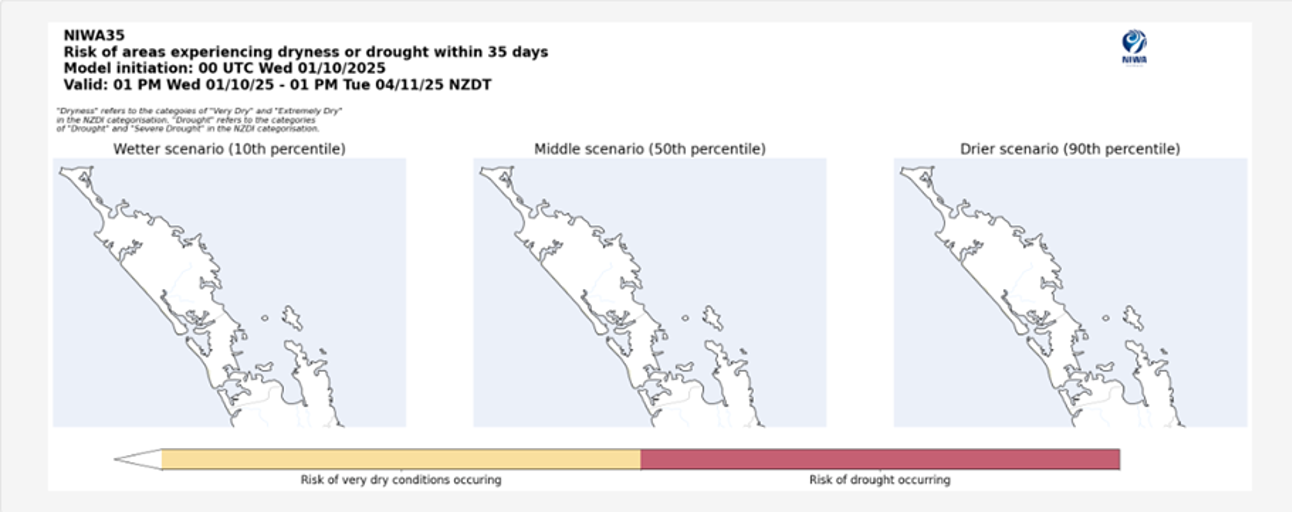
- The NIWA35 drought prediction tool indicates no expectation of drought in the next 35 days.
- There is currently low risk of drought developing in Northland over the next three months.
- On average at least one ex-tropical cyclone (TC) passes within 550km of New Zealand (NZ) each year.
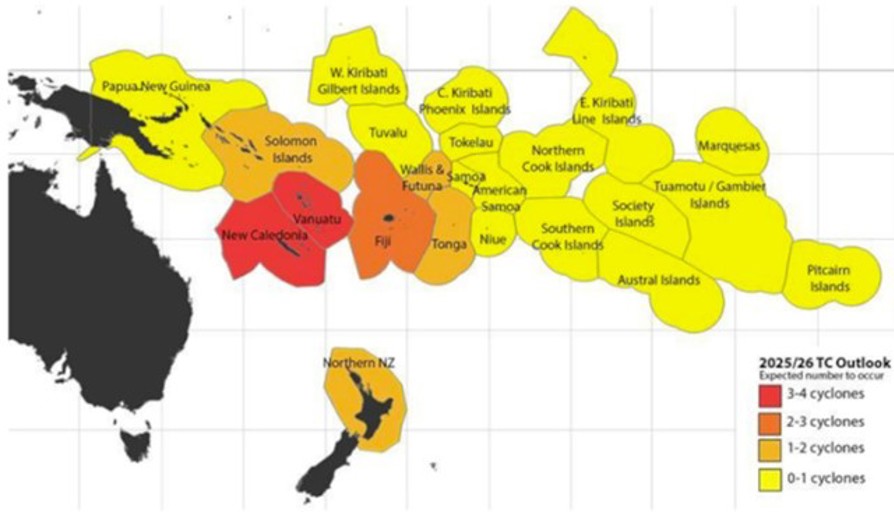
- The Earth Sciences NZ/Metservice tropical cyclone outlook forecasts a normal to elevated risk for Northern NZ for the 2025-2026 season (November to April) which means that one to two ex-tropical cyclones are likely.
Rainfall
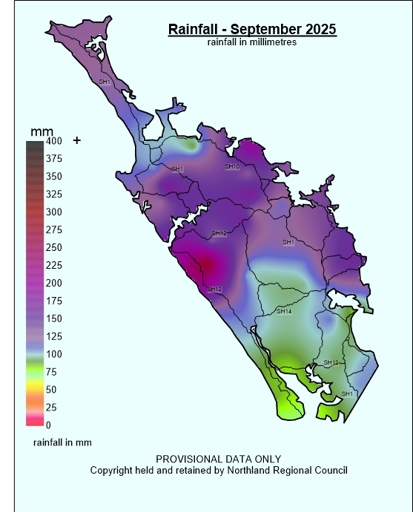
Northland region averaged 124mm, 96% of the expected (long-term median) rainfall in September. The highest rainfall total for the month was recorded in Waimamaku at Wekaweka Rd with 276.5mm, 112% of normal expected, while the highest percentage rainfall was Cape Reinga with 130mm, 139% of normal expected. The lowest rainfall total was recorded at Pouto Point with 72.5mm, 80% of normal expected, and the lowest percentage rainfall was recorded at Marsden Point and in Oruru (inland Doubtless Bay), both with 75% of normal expected, with totals of 84.5mm and 91mm respectively.
Figure 1 and 2: September 2025 rainfall distribution for Northland in mm, and in percentage of median. Showing an average of 124mm (96% of expected) rainfall for the region.
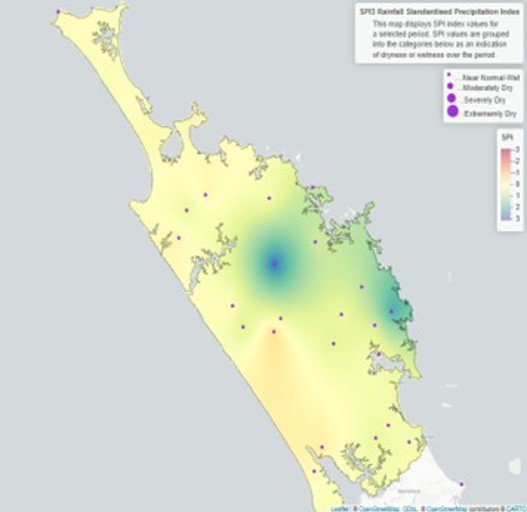
Both SPI 3 and SPI 6 maps show all sites to be at a “Near-Normal – Wet” state.
Figure 3 and 4: Standardised rainfall for Northland on a 3-month scale (July to September 2025) and a 6-month scale (April to September 2025)
River Flows
Most of Northland’s primary monitored rivers had “normal”, or “above normal” flows in September. The Awanui River in Kaitaia and the Mangaparerua in Waipapa both averaged “below normal” flow for September.
Groundwater
Groundwater levels in northlands key aquifers were primarily “above normal” for September. Coopers Beach at Kanekane Stream Bore and the Awaroa at Wallace Road bore in Ruawai were “below normal” for the month, due to lower rainfall in these areas.
Figure 6: Groundwater levels in Northland’s primary monitored aquifers for September 2025
Soil Moisture
Summary of modelled soil moisture data from Earth Sciences New Zealand (ex-NIWA)
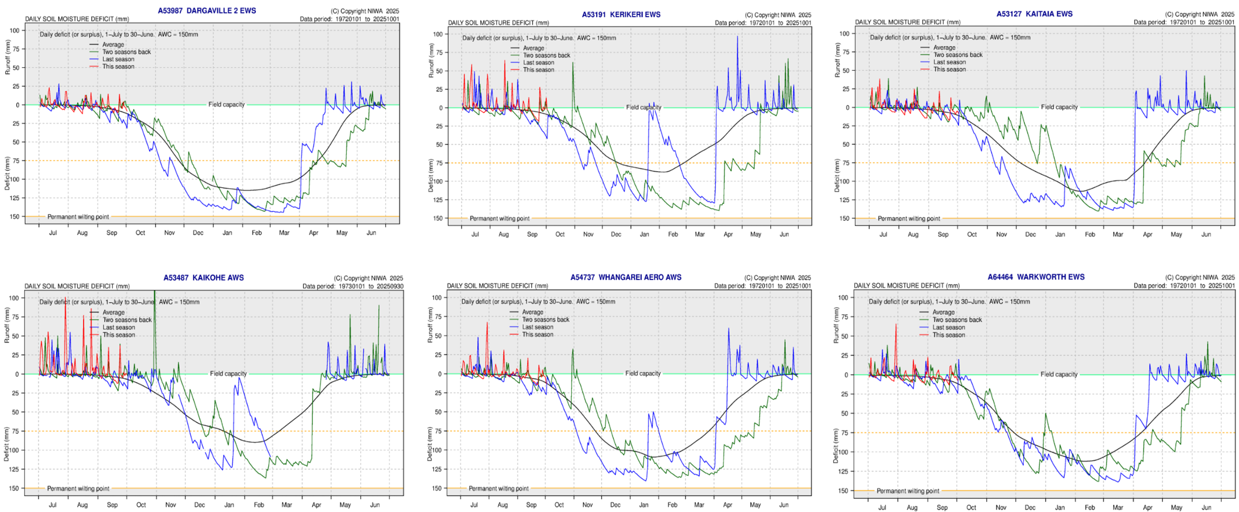
All monitored soil moisture sites show levels near field capacity. Kaikohe had the most run off recorded with approximitly 30 to 40mm of rainfall on two separate occasions, but all other sites had run off around 25mm or less.
Earth Sciences NZ’s climate forecasting predicts Northland to have “average” - “above average” rainfall for October and, if so, the soil moisture levels will likely only show a minor deficit, if any. The soil moisture deficit is calculated based on incoming daily rainfall (mm), outgoing daily potential evapotranspiration (mm), and a fixed available water capacity (the amount of water in the soil 'reservoir' that plants can use) of 150 mm”.
Figure 7: Calculated daily soil moisture values at key areas around Northland, courtesy of Earth Sciences NZ, data ending September 2025
Climate Outlook for October – December 2025
Summary of climate forecasts from Earth Sciences New Zealand (ex-NIWA) International guidance suggests there is a 60% chance La Niña conditions become established
before the end of the calendar year, potentially bringing higher sea surface temperatures as well as more easterly winds. Air temperatures are likely to be above average (50%), and rainfall are predicted to be either above (40% chance) or near normal (35%). Intense short duration rainfall events are likely, with the possibility for atmospheric rivers or ex-tropical cyclone. Soil moisture levels and river flows are predicted to be equally likely to be near normal (40% chance) or below normal (35% chance).
| Temperature | Rainfall | Soil moisture | River flows | |
| Above average | 50 | 40 | 25 | 25 |
| Near average | 40 | 35 | 40 | 40 |
| Below average | 10 | 25 | 35 | 35 |
NIWA35 Forecasting Tool
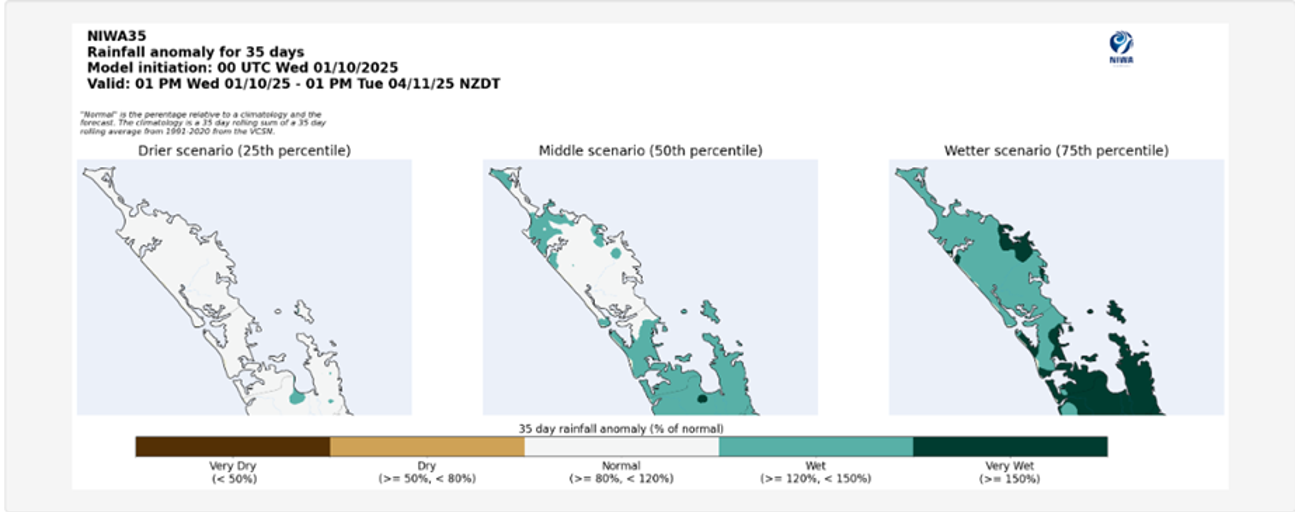
Earth Sciences NZ’s drought prediction tool combines rainfall, soil moisture, and evapotranspiration to estimate the risk of meteorological drought, over the next 35 days. Both forecasting models were run on 1 October 2025, and no indication of dryness or drought is expected. In terms of rainfall the model’s middle scenario predicts the most likely scenario is near normal amounts of rainfall for the next 35 days.
Figure 10: Drought risk assessment for Northland from NIWA35 from 1 October 2025
For more information visit https://niwa.co.nz/climate-and-weather/seasonal-climate-outlook
Northland Drought Risk Assessment
The drought risk assessment (Table 2) provides a visual summary of the current conditions of Northlands rainfall, river flows, and groundwater levels and the current state of water resources. It also incorporates Earth Sciences NZ’s Climate Outlook, NIWA35 Drought forecasting tool, and the NIWA Drought Index.
Northland has recorded normal to above normal rainfall through the winter months and into Spring and river flows are primarily normal to above normal for this time of year. Regional groundwater levels are normal to above normal in most key aquifers and soil moisture levels are close to field capacity.
Earth Sciences New Zealand (ex-NIWA) climate outlook suggests rain will be “near normal” in Northland for the next three months, October to December and the NIWA35 drought prediction tool indicates no expectation of drought in the next 35 days.
There is currently low risk of drought developing in Northland over the next three months.
| Current conditions Rainfall |
Extreme | Very low | Normal | High | Very high | Extreme |
| Rainfall | ||||||
| SPI Maps | ||||||
| River flows | ||||||
| Groundwater levels | ||||||
| Soil Moisture | ||||||
| Water resources current state | ||||||
| NIWA 3 -month outlook | ||||||
| NIWA Drought Index |
Tropical Cyclone Outlook
Late summer through early autumn is considered to be the peak of the tropical cyclone season. On average at least one ex-tropical cyclone (TC) passes within 550km of New Zealand (NZ) each year. If an ex-TC tracks close to NZ, there is a near equal probability of it tracking to the east or west of the North Island. An ex-TC entering the NZ region could produce significant rainfall, severe winds, hazardous marine conditions and coastal damage.
Figure 12: Earth Sciences/MetService Tropical cyclone outlook for the 2025-2026 season
The Earth Sciences NZ/Metservice tropical cyclone outlook forecasts a normal to elevated risk for Northern NZ for the 2025-2026 season (November to April) which means that one to two ex-tropical cyclones are likely.

