October 2025 climate report
7 Nov 2025, 3:21 PM
Key take away from this report
Rainfall between November – January is predicted to be “near average” or “elevated”, with a 65 – 70% chance of La Nina developing.
Summary
- Northland region averaged 77.4mm of rainfall in October which is 84.6% of the long-term median or normal expected.
- Rainfall distribution was clearly divided between the west and east coasts, with the west receiving more than average while the east coast had a significantly drier month.
- River flows varied across the region with catchments generally “Normal” through October.
- Ground Water levels in Northland’s key aquifers were primarily “Above Normal” to “Normal” for October.
- Soil moisture levels are about normal for this time of year.
- The ESNZ Climate Outlook for November to January forecasts “above average” or “average” temperatures and rainfall, and “average” to “below average” river flows and soil moisture levels.
- There is currently a low risk of drought conditions developing in Northland over the next three months.
- On average at least one ex-tropical cyclone (TC) passes within 550km of New Zealand (NZ) each year.
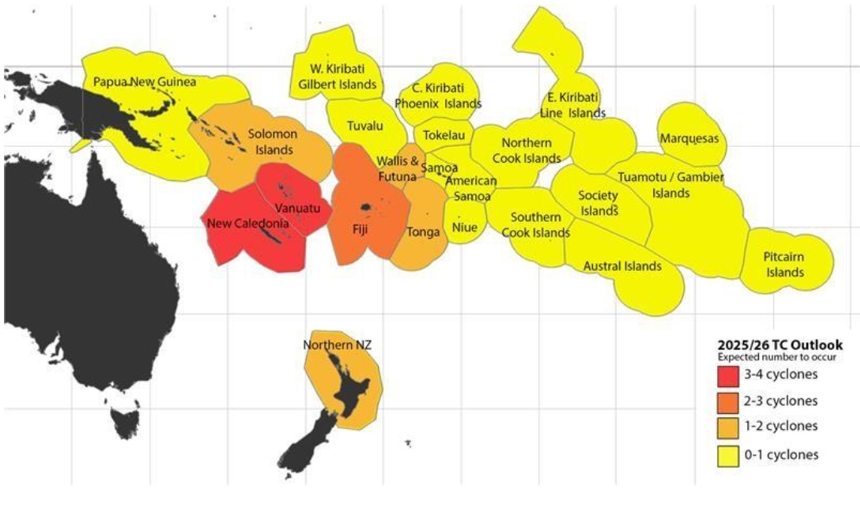
- The Earth Sciences NZ/Metservice tropical cyclone outlook forecasts a normal to elevated risk for Northern NZ for the 2025-2026 season (November to April) which means that one to two ex-tropical cyclones are likely.
Rainfall
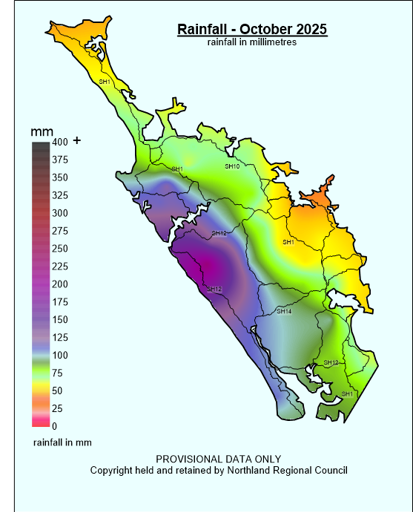
Northland region averaged 77.4 mm of rainfall in October, which is 84.6% of the long-term median or normal expected. Rainfall distribution was clearly divided with more in the west and less in the east.
The highest rainfall was recorded at Waimamaku with 220.5 mm, 98% of normal expected. The highest percentage rainfall was recorded at Kai iwi Lakes station with 142% of normal expected, 129mm (Figure 1).
The lowest rainfall for October was recorded at the Opua at Veronica Channel station with 43.5mm, 62% of normal expected. The lowest percentage rainfall was recorded at the Whakapara at Puhipuhi station with 42% of normal expected, 60mm (Figure 2).
Figure 1 and 2: October 2025 rainfall distribution for Northland in mm, and in percentage of median. Showing an average of 77.4 mm (84.6% of expected) rainfall for the region.
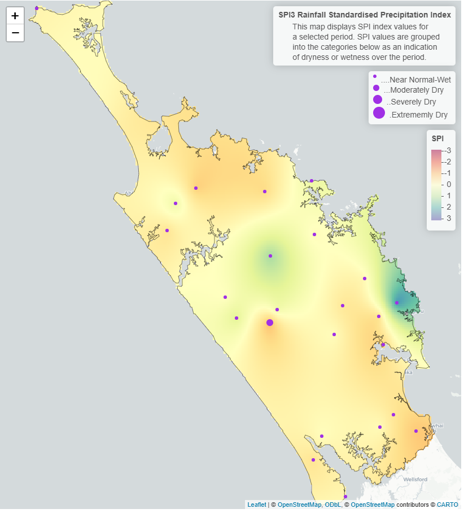
The standardized precipitation index utilises the recorded total against the sites average to group the rainfall on an indexed scale of -3 to 3. This allows individual sites to be compared to each other over different time scales. On a three-month scale (Figure 3), from August to October, and a six-month scale (Figure 4) from May – October, the Northland region was close to normal for rainfall totals. (Note: The Tutukaka coast area is incorrectly indicating wet conditions due to a sensor malfunction).
Figure 3 and 4: Standardised rainfall for Northland on a 3-month scale August – October 2025 and a 6-month scale (May – October).
River Flows
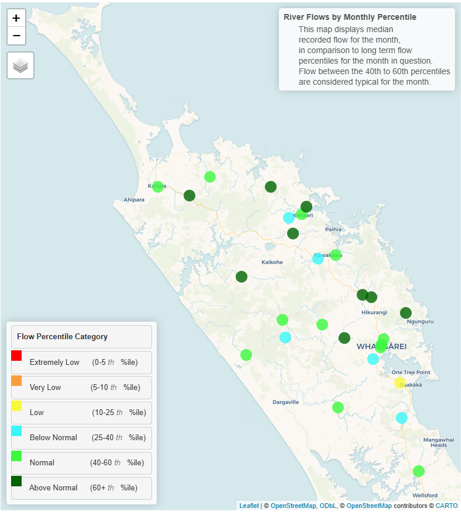
River flows in Northlands primary monitored catchments were mostly “Normal” to “Above Normal” for October. Some River flows were “Below Normal”. The variation is primarily due to catchment storage capacity and rainfall distribution.
Figure 5: River flows in Northland for October 2025.
Groundwater
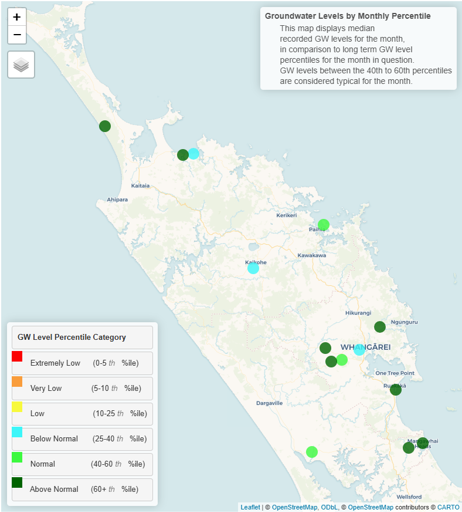
Groundwater levels in most of Northlands key monitored aquifers were generally “Normal” or “Above Normal” for October. Several monitoring bore groundwater levels were “Below Normal” for October. Variation is due to a number of factors, including rainfall distribution, and differences in aquifer geology, storage and recharge characteristics.
Figure 6: Groundwater levels in Northland’s primary monitored aquifers for October 2025.
Soil moisture
Summary of modelled soil moisture data from NIWA
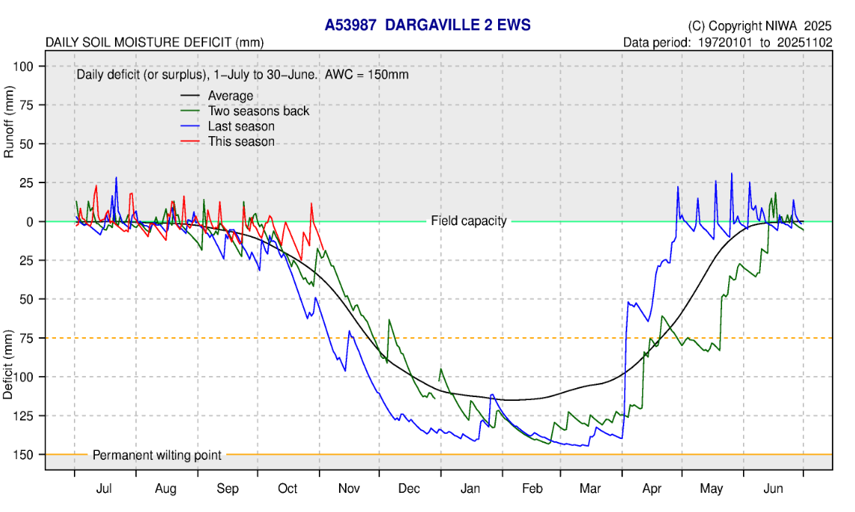
Regional soil mositure levels are about normal for this time of year. Throughout October soil moisture gradually declined in response to lower rainfall totals and increasing temperatures, which drove higher amounts of evaporation (Figure 7). Some recharge was seen at the end of the month when a small westerly rain event passed over the region and Dargaville returned to field capacity. The soil moisture deficit is calculated based on incoming daily rainfall (mm), outgoing daily potential evapotranspiration (mm), and a fixed available water capacity (the amount of water in the soil 'reservoir' that plants can use) of 150 mm”.
Figure 7: Calculated daily soil moisture values at key areas around Northland, courtesy of NIWA, data ending 5th November 2025.
Climate Outlook for November 2025 – January 2026
Summary of climate forecasts from NIWA
During November to January there is moderate to high likelihood of La Nina conditions developing over New Zealand. With both the Southern Oscillation Index, and the Relative Oceanic Nino Index exceeding their respective thresholds for La Nina conditions during October. November is likely to be dominated by high pressure systems in the beginning of the month before north and westerly weather systems move across Northland, potentially bringing normal to above normal rainfall for the month. During December and January, easterly weather systems are expected to be the dominant climate driver. Ongoing marine heat wave conditions are continuing to persist around Northland and are expected to remain or increase throughout the summer particularly off the east coast. This can cause intensification of any rain events if they pass through. In Northland we can expect “above average” or “average” temperatures and rainfall between November and January, while river flows and soil moisture levels are likely to be “average” to “below average”.
NIWA’s full outlook can be found at: Seasonal Climate Outlook (NIWA)
Table 1: Forecasted likelihood of above, near or below average climate conditions for Northland from November 2025 – January 2026.
(Expressed as % likelihood).
| Temperature | Rainfall | Soil moisture | River flows | |
| Above average | 50 | 45 | 25 | 25 |
| Near average | 45 | 40 | 40 | 40 |
| Below average | 5 | 15 | 35 | 35 |
ESNZ NZ Drought Index
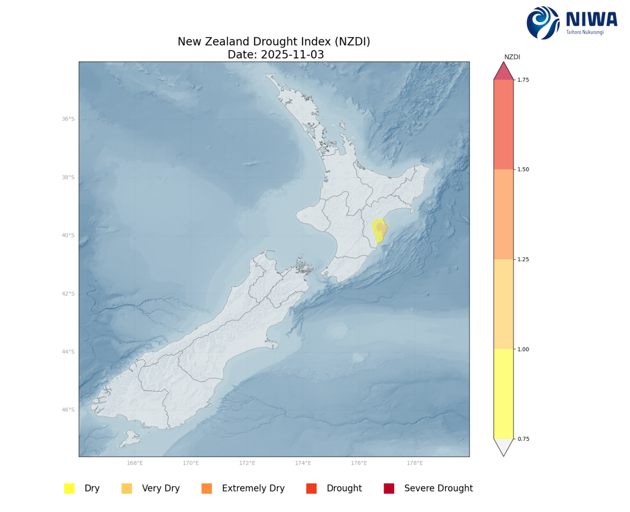
The ESNZ NZ Drought Index currently indicates normal conditions for Northland.
Earth Sciences NZ’s drought prediction tool combines rainfall, soil moisture, and evapotranspiration to estimate the risk of meteorological drought, over the next 35 days. This shows a low chance, 25th percentile, of dry conditions in the southeast of Northland, normal conditions are most likely, 50th percentile, and a low chance of wet to very wet conditions, 75th percentile.
Figure 8: ESNZ’s New Zealand Drought Index, 3 November 2025.
Figure 9: ESNZ, NIWA35 Rainfall anomaly model showing low risk of very dry conditions developing between November and December 2025.
Northland Drought Risk Assessment
The drought risk assessment (Table 2) provides a visual summary of the current conditions of Northland’s rainfall, river flows, and groundwater levels and the current state of water resources. It also incorporates ESNZ’s Climate Outlook and Drought Index.
Northland region averaged 84.6% of normal expected rainfall for the month. The SPI scores, river flows, groundwater levels and soil moisture levels for October are all close to normal. Water resource availability is about normal for this time of year. The ESNZ Climate Outlook for November – January predicts conditions to be close to “Normal” with a low risk of Drought conditions developing.
Table 2: Drought Risk assessment matrix.
|
Current conditions |
Extreme |
Very low |
Low |
Normal |
High |
Very high |
Extreme |
|
|
Rainfall |
|
|
|
|
|
|
|
|
|
SPI Maps |
|
|
|
|
|
|
|
|
|
River flows |
|
|
|
|
|
|
|
|
|
Groundwater levels |
|
|
|
|
|
|
|
|
|
Soil Moisture |
|
|
|
|
|
|
|
|
|
Water resources current state |
|
|
|
|
|
|
|
|
|
NIWA 3 -month outlook |
|
|
|
|
|
|
|
|
|
NIWA Drought Index |
|
|
|
|
|
|
|
|
Tropical Cyclone Outlook
Summary of ESNZs outlook
Tropical cyclones are likely to occur from mid-summer to early autumn. On average at least one ex-tropical cyclone (TC) passes within 550km of New Zealand (NZ) each year. For the 2025 – 2026 season ESNZ predicts that northern New Zealand has a Normal to Elevated risk with 1 to 2 cyclones possibly interacting with the North Island. An ex-TC entering the NZ region could produce significant rainfall, severe winds, hazardous marine conditions and coastal damage.
Visit the NIWA website for a more detailed outlook
Figure 12: Number of predicted named tropical cyclones interacting with an island group for the 2025 - 2026 season.

