May 2025 climate report
6 Jun 2025, 11:59 AM
Key take away from this report
Northland region experienced average rainfall for May. River flows and groundwater levels are "Above Normal" across most of the region. Soil moisture is at or near field capacity, leading to runoff. The climate outlook for June-August 2025 predicts "Above average" temperatures and rainfall, with "Near average" soil moisture and river flows, and a persistence of neutral El Niño conditions.
Summary
- Northland experienced widespread average rainfall in May, largely due to four storm events, with the highest amounts in the northwest and eastern hills, averaging 134 mm across the region (97% of expected rainfall)
- On a three-month scale, Northland has been wetter than "Normal," while on a six-month scale, it has generally been "near normal" in the south and central parts with some wetter areas.
- Due to sustained wet conditions in April and May and ongoing weather events, river flows across Northland are "Above Normal," posing a risk of flooding in low-lying areas with significant rainfall.
- Following a wet autumn, groundwater levels in all key aquifers across Northland have significantly risen to "Above Normal," except for Mangawhai, which is at "Normal" levels for May.
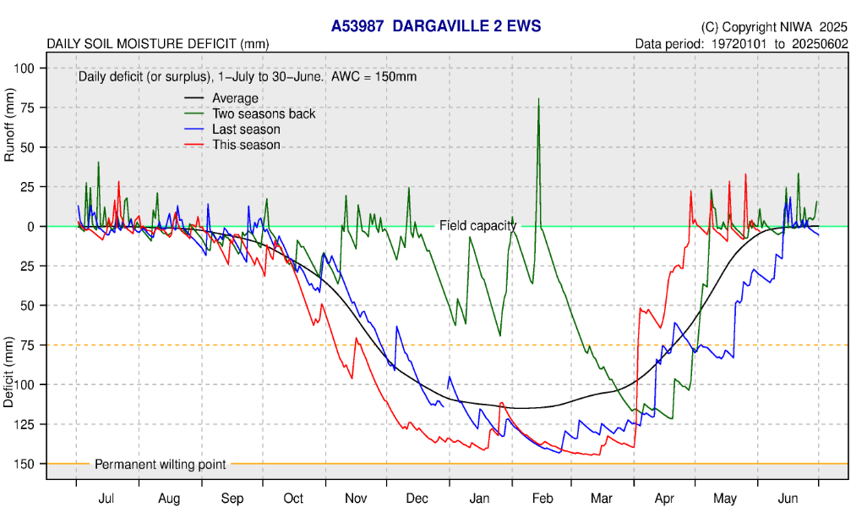
- After a significant recovery in April, soil moisture across Northland remained at or just below field capacity throughout May, leading to approximately 25 mm of runoff from the four significant rain events.
- Winter is anticipated to be like autumn, with a 70% chance of neutral El Niño conditions persisting, leading to "Above average" temperatures and rainfall for Northland, while soil moisture and river flows are expected to be "near average".
Rainfall
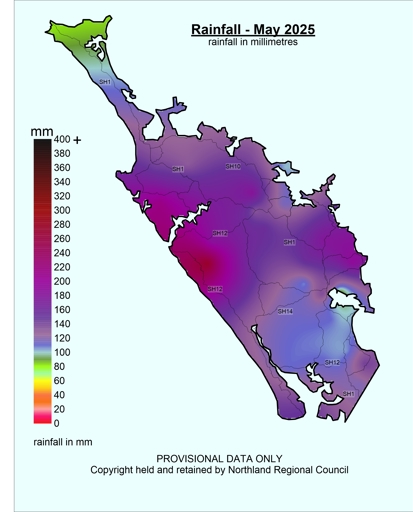
Most days in May saw rainfall somewhere in the Northland Region. Four storm events passed through the region, which produced the majority of the rainfall for the month. The highest rainfall was in the northwest of the region and spread into the eastern hills (Figure 1). On average the region recorded 134 mm of rainfall, which is 97% of the expected rainfall for May. The Highest rainfall was 274 mm in Waimamaku, followed by Tutamoe and Rotokakahi with 220 and 214 mm respectively.
At the other end of the scale the lowest rainfall was at Cape Reinga with 83 mm, followed by Bream Bay and the Brynderwyns with 103 mm and 105.5 mm. Percentage wise Rotokakahi recorded the highest with 157% of its May average, followed by the Hikurangi swamp with 128%, and 125% at Kerikeri Airport. The lowest percentage was 72% both at Cape Reinga and in Paparoa, followed by 74% inland of Marsden Point (Figure 2).
Figures 1 and 2: May rainfall distribution for Northland in mm, and in percentage of median. Showing an average of 20 mm (22% of expected) rainfall for the region.
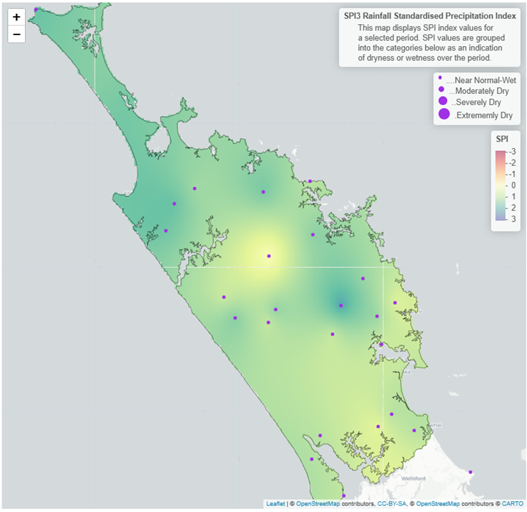
On a longer time scale the standardised precipitation index, over three months (Figure 3) shows that the region has been wetter than “Normal”, while over six months the region has been “near normal” for most of Northland.
River Flows
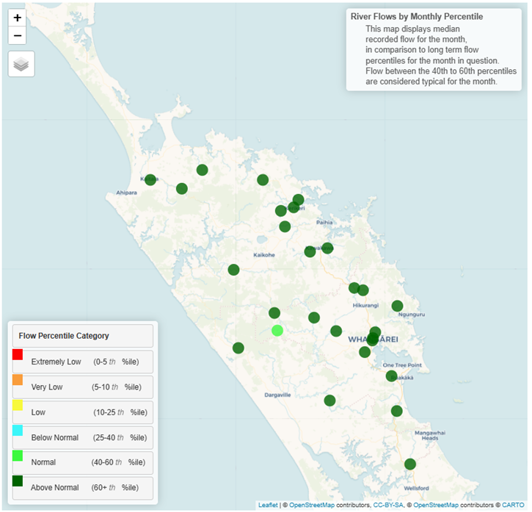
River flows in May are “Above Normal” across the region (Figure 5), which reflects the high rainfall experienced over the last two months, particularly April. There is still some capacity in the rivers, however along with wet soils, significant rainfall is likely to result in flooding in low lying areas.
Figure 5: River flows in Northland for May 2025.
Groundwater
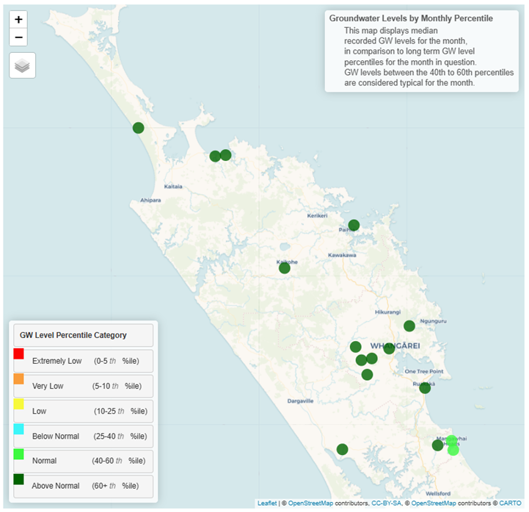
Groundwater levels in all key aquifers have risen significantly, following a sustained wet autumn and are now “Above Normal” across Northland, in all areas except Mangawhai where the water levels are recording “Normal” for May (Figure 6).
Figure 6: Groundwater levels in Northland’s primary monitored aquifers for May 2025.
Soil moisture
After significant recovery in soil moisture in April, soil moisture levels across Northland have been at, or just below, field capacity for all of May (Figure 7). Four significant rain events during May resulted in rainfall run off of approximately 25 mm at all monitoring sites in the region. The soil moisture deficit is calculated based on incoming daily rainfall (mm), outgoing daily potential evapotranspiration (mm), and a fixed available water capacity (the amount of water in the soil 'reservoir' that plants can use) of 150 mm”.
Figure 7: Calculated daily soil moisture values at key areas around Northland, courtesy of NIWA.
Climate Outlook for June - August 2025
Summary of climate forecasts from NIWA and MetService
Following a wet autumn, winter is set to be similar. Neutral El Nino conditions have a 70% chance of persisting between June and August, however some weak La Nina conditions, northerly and easterly weather systems are mostly likely to dominate through winter. Northland can expect “Above average” temperatures and rainfall, while soil moisture and river flows are expected to be “near average”. Sea surface temperatures are currently higher than normal and are expected to continue to be elevated throughout winter, this could possibly intensify rainfall amounts when storms develop. Cold snaps will occur as southerly systems come though periodically, but these will be less common than Normal.
Table 1: Forecasted likelihood of above, near or below average climate conditions for Northland from May – July 2025, courtesy of NIWA.
(Expressed as % likelihood).
| Temperature | Rainfall | Soil moisture | River flows | |
| Above average | 65 | 45 | 25 | 35 |
| Near average | 15 | 35 | 50 | 45 |
| Below average | 5 | 20 | 25 | 20 |
The first week of June is set to be warm and wet. While the second week of June is set to be cold, drier and possibly some frosts could occur, before more rainfall, and warm conditions return. The NIWA35 models are useful to look at the next 35 days of forecasted rainfall and are updated daily. The NIWA35 can be found, along with a detailed three month outlook, at: https://niwa.co.nz/climate-and-weather/seasonal-climate-outlook/seasonal-climate-outlook-june-august-2025

