April 2023 climate report
8 May 2023, 1:34 PM
Summary
- El Niño Southern Oscillation (ENSO) neutral conditions have driven conditions in April, with weather events being driven by Northerly atmospheric rivers, which are carrying on into the start of May.
- Conditions into the onset of winter are expected to change towards southerly wind flows with El Niño conditions developing in July.
- Temperatures are likely to be “above average”, while rainfall is likely to be “near average” to “above average”.
- April was again wetter than expected with Northland having 177% of the rain expected for the region.
- Groundwater and river flows are “above average” for aquifers and catchments in Northland.
- Soil moisture at the end of April is above field capacity for most of Northland, except in Dargaville which is in deficit but rising.
Climate Outlook
May to July 2023
ENSO conditions throughout April have remained in neutral conditions as expected. Through May weather patterns are expected to vary, but tend towards southerlies with the onset with winter, consistent with the development of El Niño. Between May – July rainfall is likely to be “average” to “above average” in Northland. While temperatures are likely to be “above average”. Soil moisture and river flows are likely to be “near average” to “below average”. If El Niño conditions develop July could be drier than “normal”.
For more details, please refer to NIWA’s seasonal climate outlook for May - July 2023:
See the seasonal climate outlook on NIWA's website: niwa.co.nz
NIWA Temperature, Rainfall, Soil Moisture and River Flows probabilities for the period of May to July 2023
(Expressed as % likelihood for either Above Average, Near Average or Below Average conditions).
| Temperature | Rainfall | Soil moisture | River flows | |
| Above average | 50• | 40 | 15 | 15 |
| Near average | 35 | 45• | 40• | 45• |
| Below average | 15 | 15 | 45• | 40• |
Rainfall
Throughout April there were only a few regionally dry days although temperatures have remained higher than normal for this time of year. The month ended with an “atmospheric river” streaming out of the tropics fed by a low-pressure system in the Tasman that had nowhere to go while a large blocking high pressure system remained stationary out to the east.
The most rain recorded for the month was 362.6mm at Kaikohe with over half of that in the last day of the month. Waitangi at Wiroa Road wasn’t far behind on 354mm. The south-west was relatively sheltered from the east and north-east rains. All sites on the Poutō Peninsula had less than 100mm with Poutō Point only recording 30mm for the month. Region-wide, however, we averaged 180mm.
Regionally we would expect about 101mm in April. This April with 180mm we had a regional percentage of 177% of the expected falls. The lowest percentages were in the south-east with Poutō point on 55%. Highest percentages were concentrated around the eastern and central hills. Kaikohe had 330% of expected, Whangārei had 326%, and Waitangi at Wiroa Road 301%.
Rainfall (% of Median) for April 2023 across Northland with a range of 330% to 55%
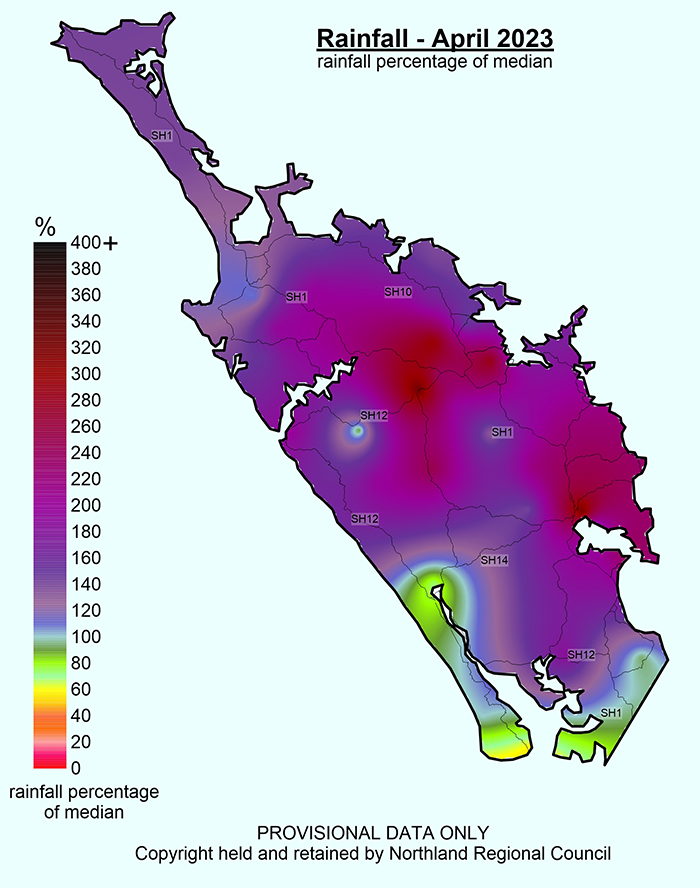
Rainfall (% of Median) for April 2023 across Northland with a range of 330% to 55%.
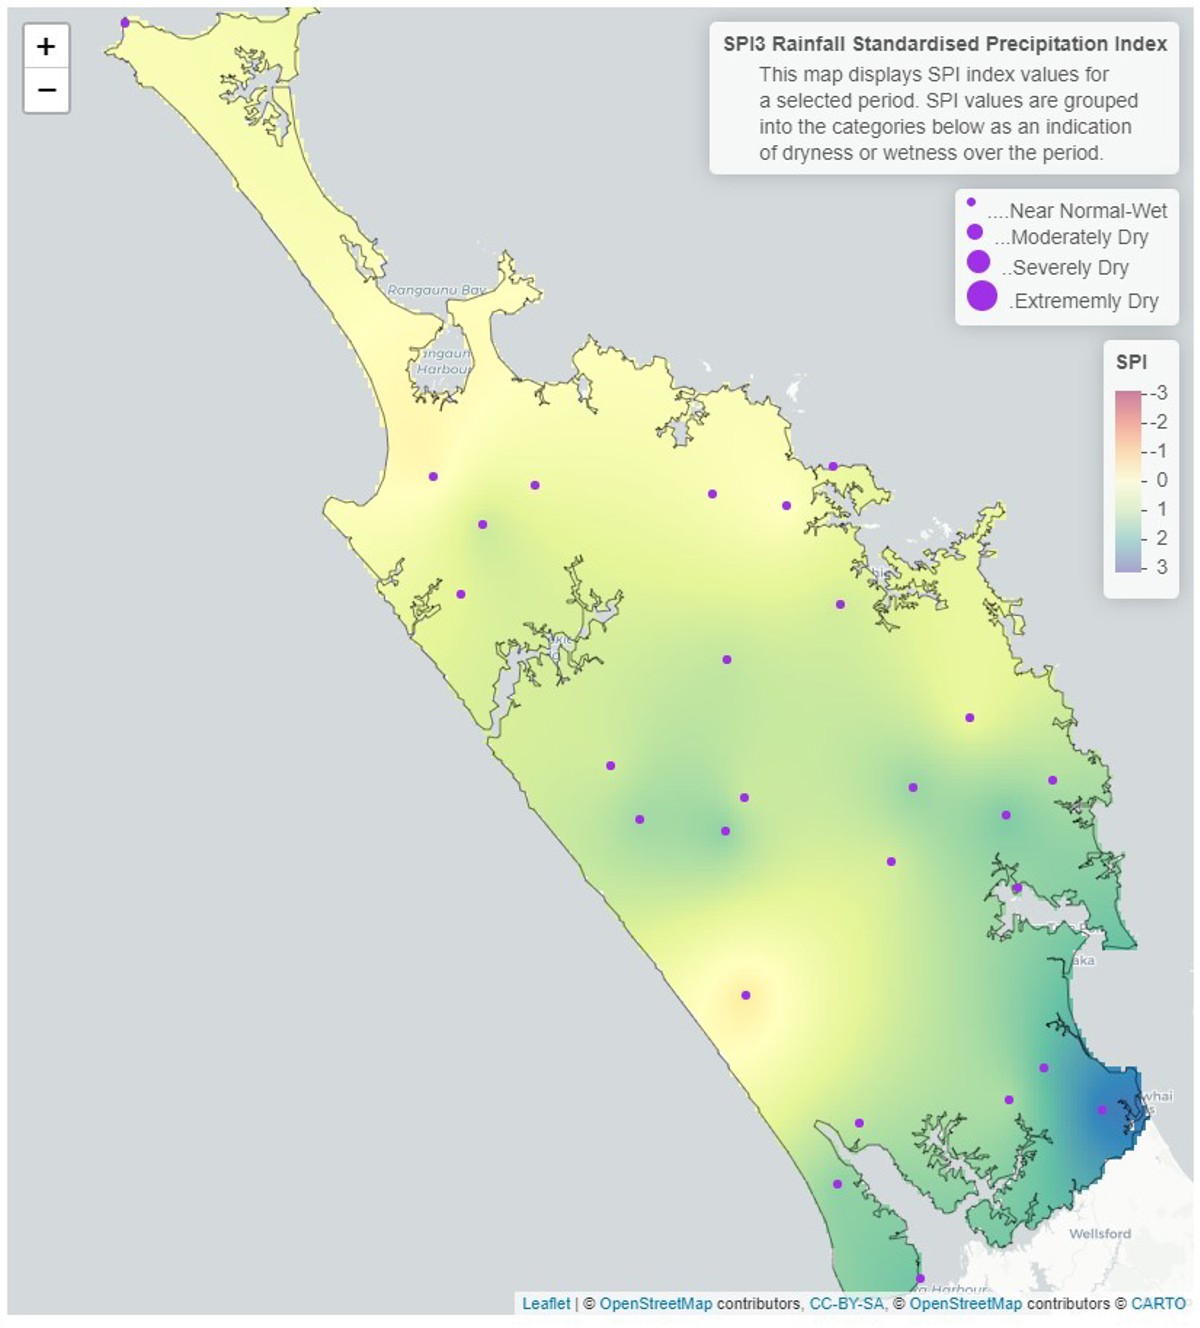
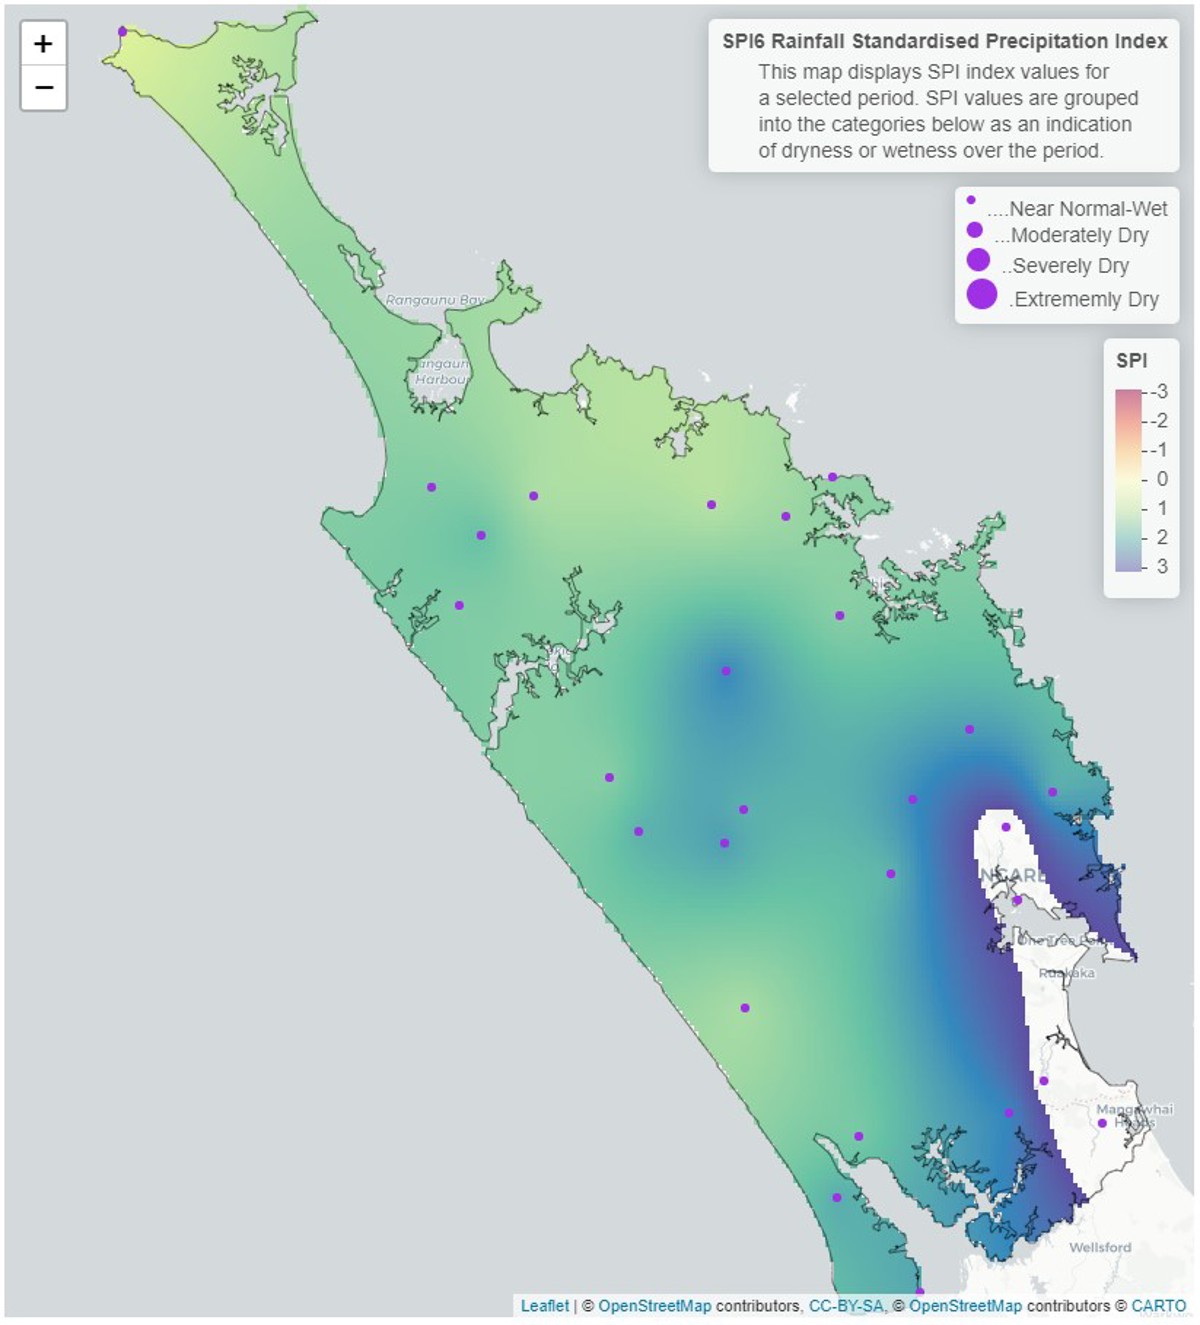
Standardised Precipitation index (SPI)
The Standardised Precipitation Index (SPI) on a three-month scale shows that all of Northland has been “near normal or wet”, March was drier than usual so over a three-month period the rainfall for most of Northland has been as expected.
On a six month scale the SPI map shows conditions that are “near normal or wet” with most of the southern areas of Northland being extremely wet. The southeast corner of Northland appears to have no data on the 6-month scale, due to the SPI value for this area being greater than the standardised scale of -3 to 3 allows. This means that these areas have experienced an unprecedented amount of rainfall and are extremely wet. This has been caused by extreme rain events in November, January, February, and April.
3 and 6-Month SPI (Standardised Precipitation Index) maps
River flow
During April flows across Northland were generally “above normal” or “normal”. The Mangakahia river was “below normal” for what was expected in April, possibly due to lower than expected rainfalls in March, and the large events in April only affecting this catchment at the end of the month and into May. The Kaeo and south of Kaitaia catchment data has been removed due to the data failing at these sites.
Monthly percentile River Flows for April 2023
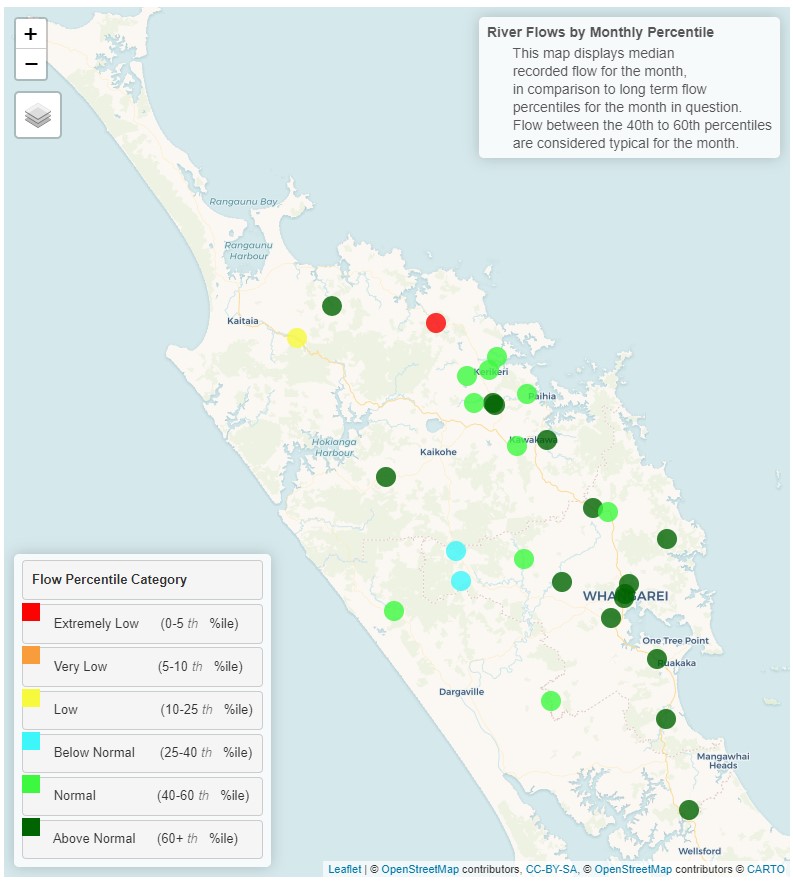
Monthly percentile river flows for April 2023.
Groundwater
All key aquifers in Northland are currently recording “Above Normal” water levels for April, except for Taipā, which is at Normal levels for April.
| Aquifer | Status | Percentile |
| Aupōuri | Above normal | 60th+ |
| Taipā | Normal | 40-60th |
| Russell | Above normal | 60th+ |
| Kaikohe | Above normal | 60th+ |
| Poroti | Above normal | 60th+ |
| Whangārei | Above normal | 60th+ |
| Mangawhai | Above normal | 60th+ |
| Marsden - Ruakākā | Above normal | 60th+ |
| Ruawai | Above normal | 60th+ |
Groundwater map for April 2023
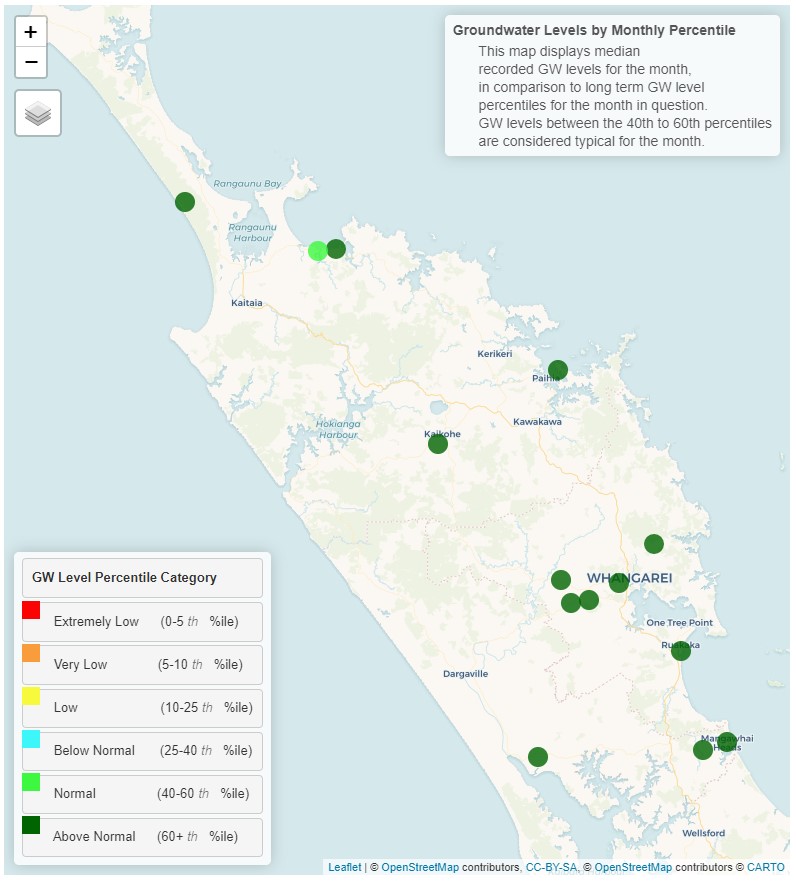
Groundwater map for April 2023.
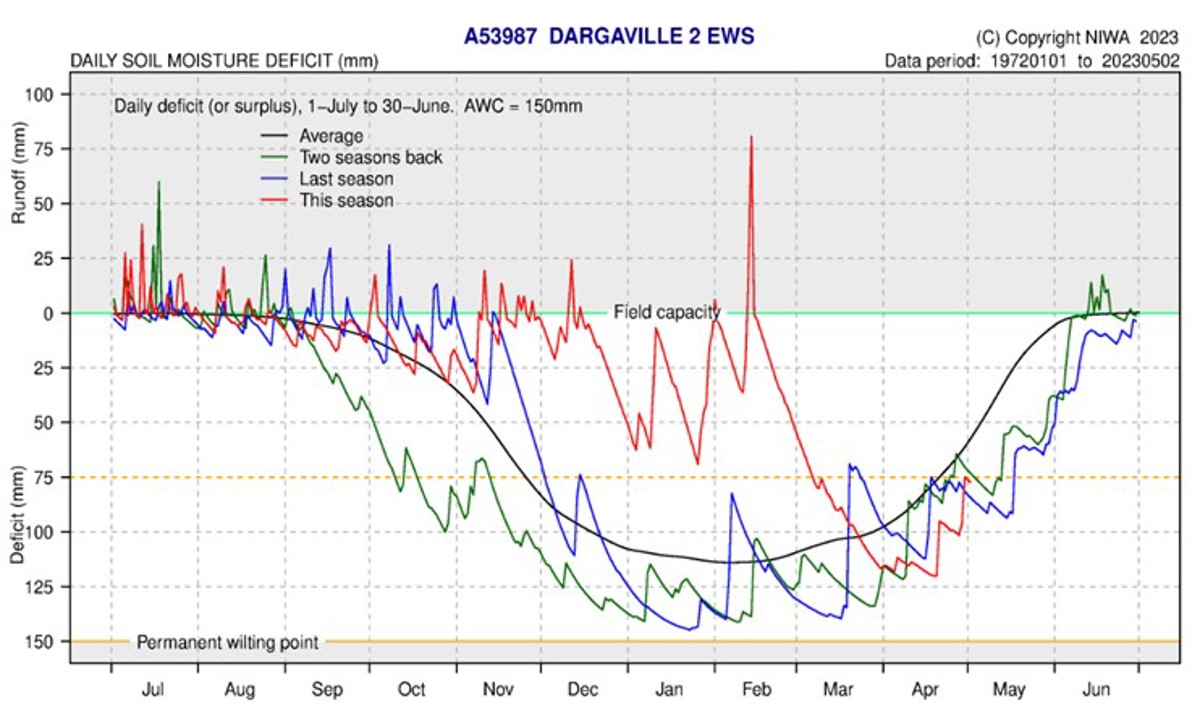
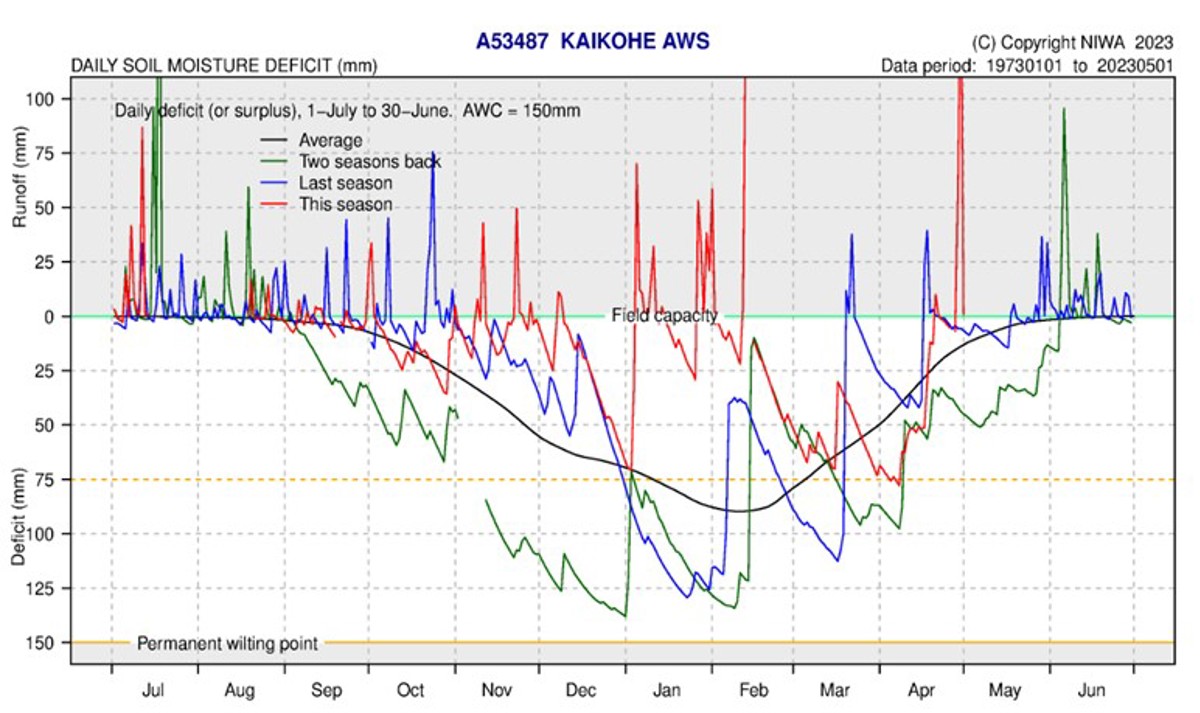
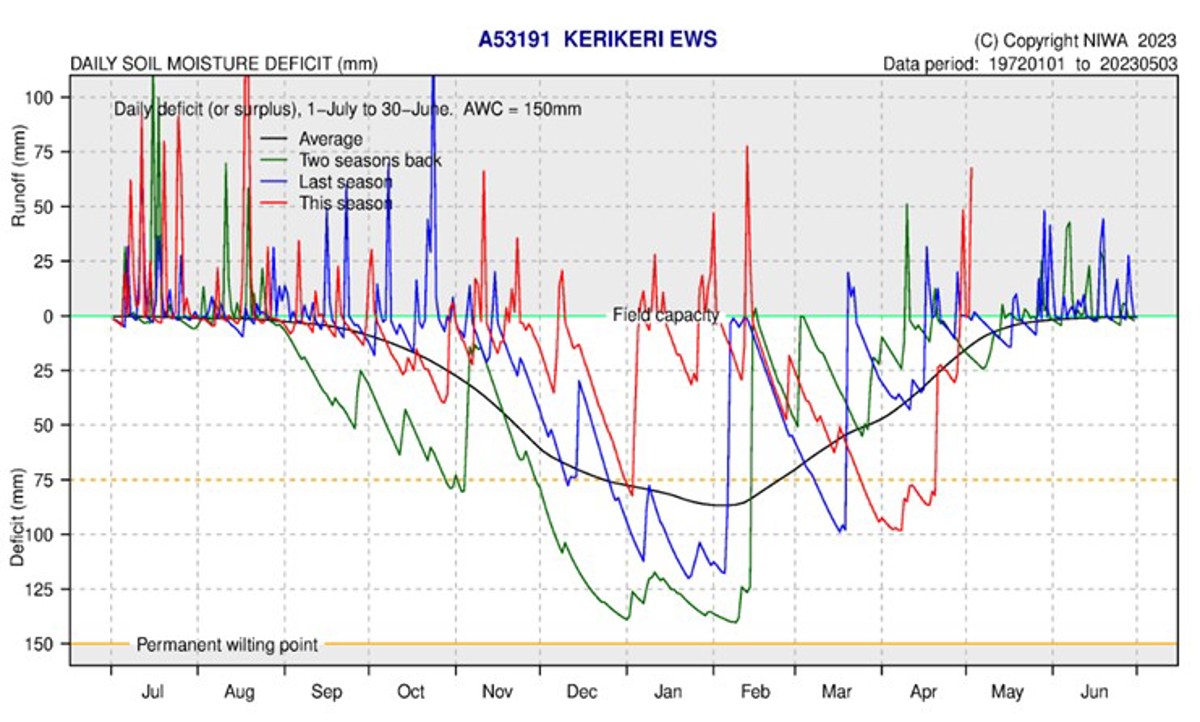
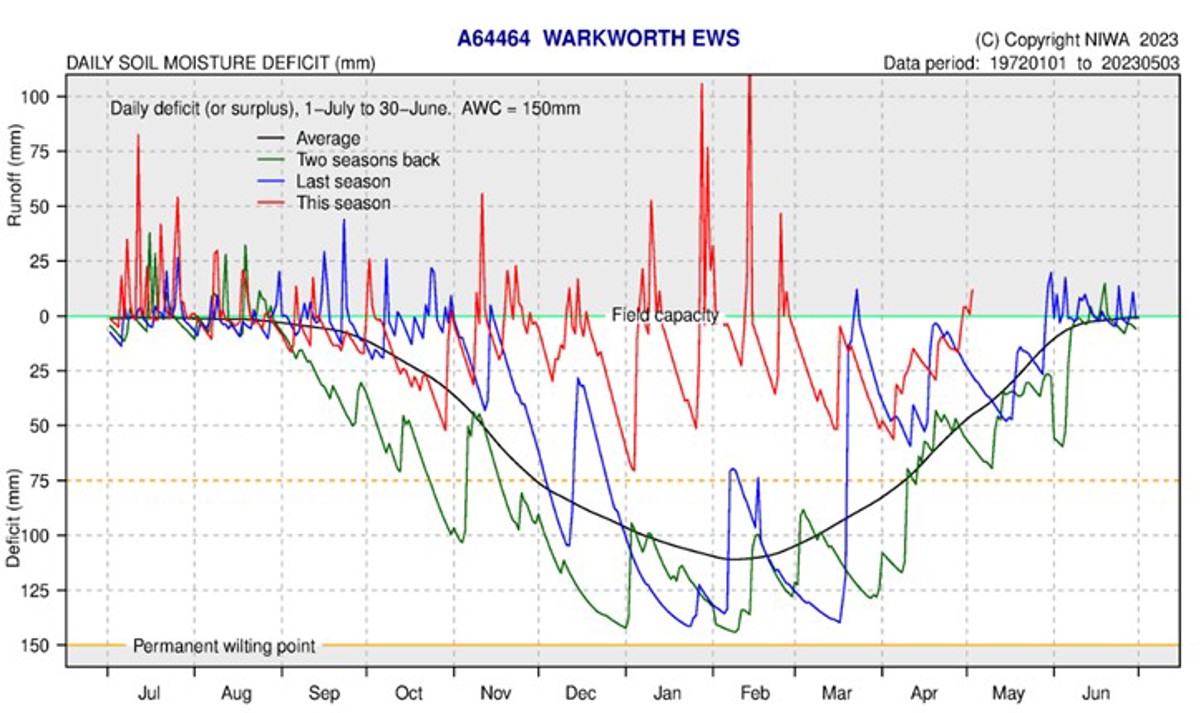
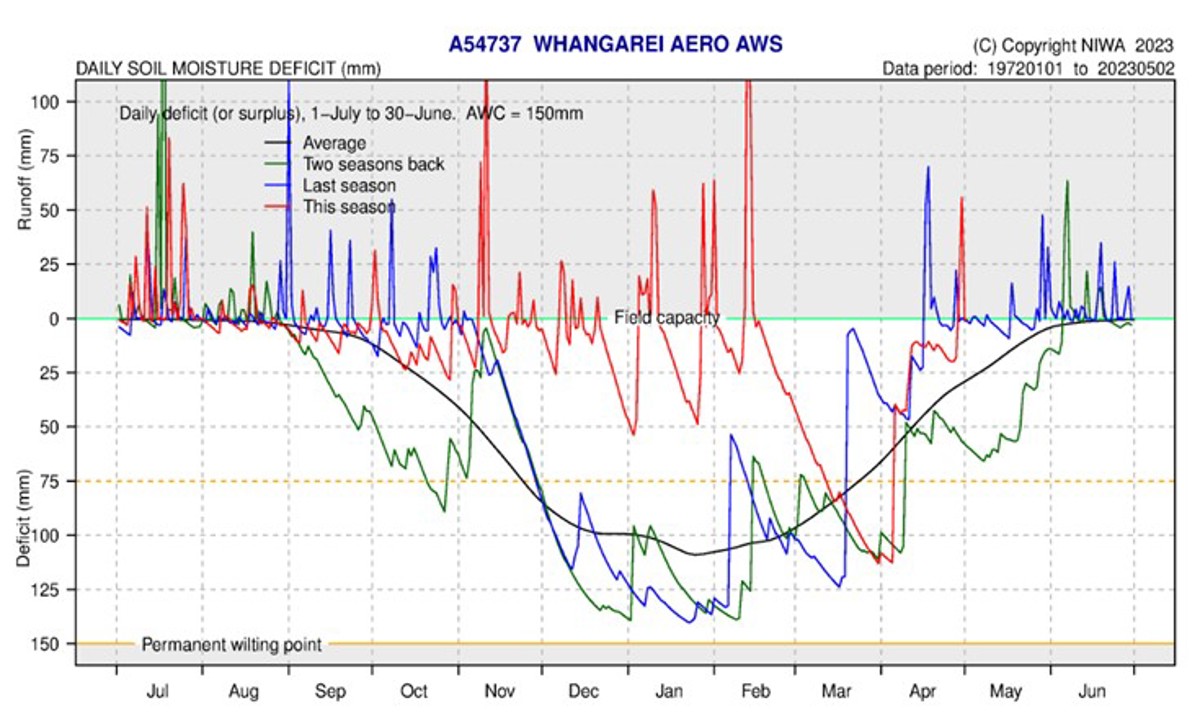
Soil moisture
While April was wetter than expected, with some large rain events, the effects of this took some time to be detected in the soil moisture across Northland.
In the West, soils ended in April with a deficit though this is beginning to improve. All other sites in Northland have recovered, with a number of sharp rises. The rain event at end of the month and moving into May has resulted in most sites in Northland being past field capacity and run off occurring. In Dargaville soil moisture levels were near average, while all other sites started below average after a dry March, then moved to above average as progressively more rain came through.
The soil moisture deficit is calculated based on incoming daily rainfall (mm), outgoing daily potential evapotranspiration (mm), and a fixed available water capacity (the amount of water in the soil 'reservoir' that plants can use) of 150 mm” (NIWA).