February 2023 climate report
6 Mar 2023, 11:30 AM
Summary
- La Niña conditions are expected to transition to neutral in April bringing drier conditions to Northland.
- Remnants of La Niña however could result in heavy rain events.
- The Northland region received 336% of the expected rainfall for February, with a range of 976% in the south and 123% in the north.
- Looking at both a 3- and 6-month scale of standardised rainfall, Northland has experienced “near normal to wet” conditions.
- River levels and ground water levels are both “above average” for February.
- Soil moisture at the end of February is in a mild deficit or at field capacity for the whole region.
Outlook
March to May 2023
The La Niña conditions that New Zealand’s weather has been driven by throughout summer are expected to transition to neutral during March. The result of the transition is that weather conditions in Northland are likely to be drier than the previous few months, however the remnants of La Niña could result in the development of significant low-pressure systems which would potentially bring heavy rain. Temperatures for March - May are likely to be “near average” for autumn, or “above average”, along with river flows. While rainfall and soil moisture are likely to be “near average” for autumn.
For more details, please refer to NIWA’s seasonal climate outlook for March - May 2023:
See the seasonal climate outlook on NIWA's website: niwa.co.nz
NIWA Temperature, Rainfall, Soil Moisture and River Flows probabilities for the period of March to May 2023
(Expressed as % likelihood for either Above Average, Near Average or Below Average conditions).
| Temperature | Rainfall | Soil moisture | River flows | |
| Above average | 45• | 30 | 50• | 50• |
| Near average | 45• | 45• | 45• | 40 |
| Below average | 10 | 25 | 05 | 10 |
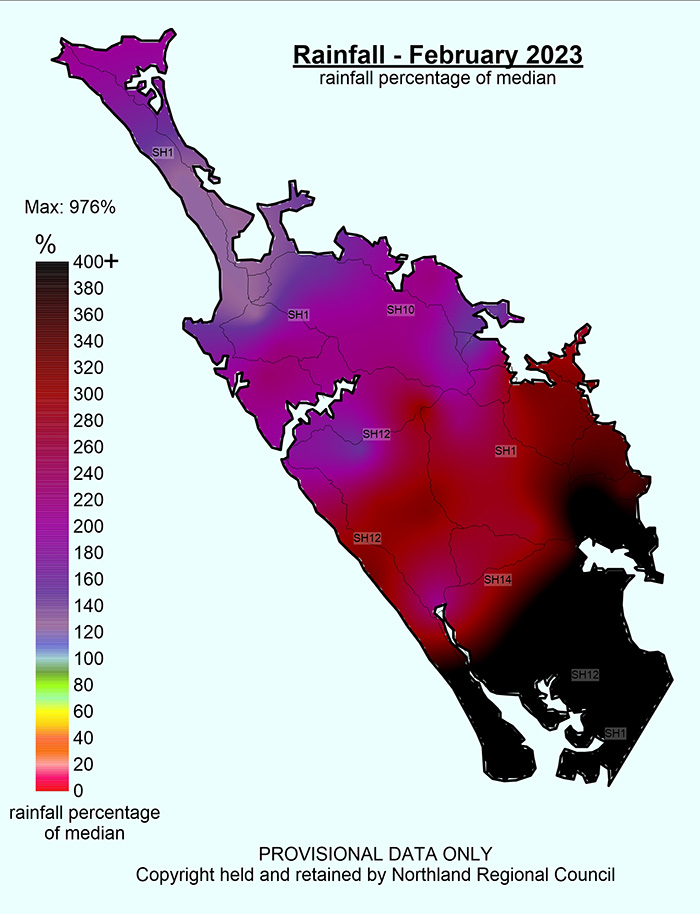
Rainfall
February was another exceptional month for rainfall, bringing with it exceptional river flows and destruction.
Majority of the rainfall came from Cyclone Gabrielle between the 12 – 15 February, then the south of the region was hit on the 24 February with a spectacular thunderstorm. Both events exceeded a 1 in 100-year recurrence probability, which means there is less than 1% chance for an event of this size to occur in a given year.
During February, Northland received on average 257 mm, which is 336% of the expected rainfall for the month. The region however had significant variation, with the south recording significantly more rainfall compared to the rest of the region. Mangawhai recorded the maximum rainfall for the month of 653 mm, while the far north recorded the least with 80 mm recorded at Waihopo at Kimberly Road.
Compared to the average of what is expected in February the southern reaches of Northland had significantly more rainfall than expected, Mangawhai recorded 976% while the Brynderwyns and Paparoa received 662% and 654% respectively. At the other end of the spectrum the Far North was drier, however still wetter than expected with Waihopo recording 123% of its expected rainfall.
Rainfall (% of Median) for February 2023 across Northland with a range of 976% to 123%
Standardised Precipitation index (SPI)
The Standardised Precipitation Index (SPI) on a three-month scale shows that all of Northland has been “near normal or wet” between December 2022 and February 2023, following on from a very wet January and February particularly in the south and east.
The six-month SPI shows “near normal or wet” conditions for Northland from September to February.
3 and 6-Month SPI (Standardised Precipitation Index) maps to February 2023


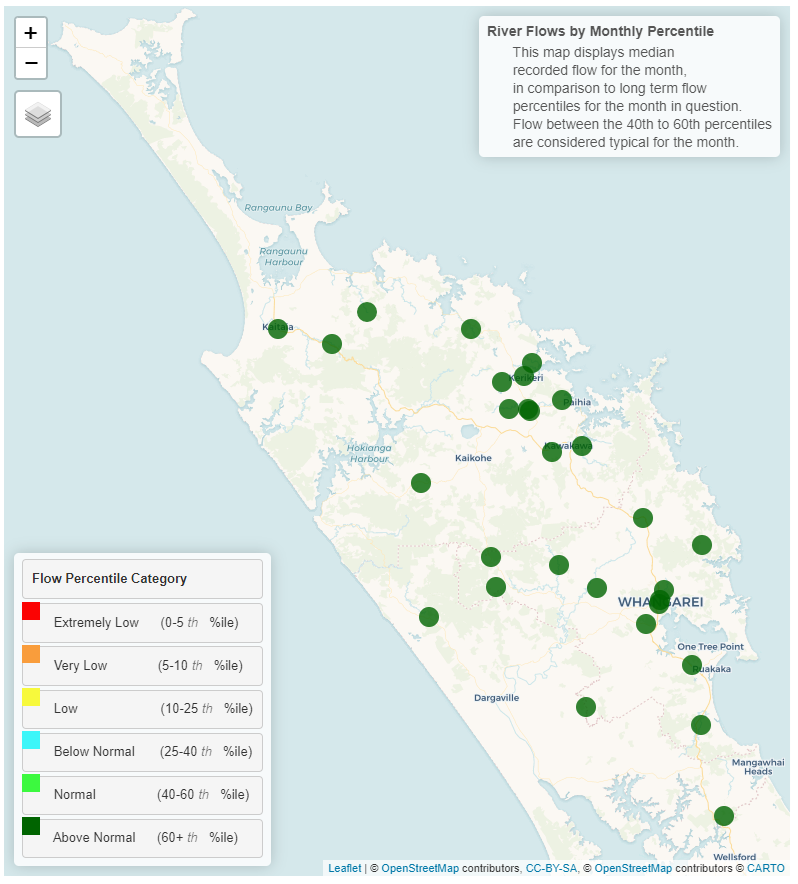
River flow
Continuing from a substantially wet January, high river flows were maintained by the two large events in February, with substantial flood events observed across Northland. All key catchments recorded “above normal” flows for February.
Monthly percentile River Flows for February 2023
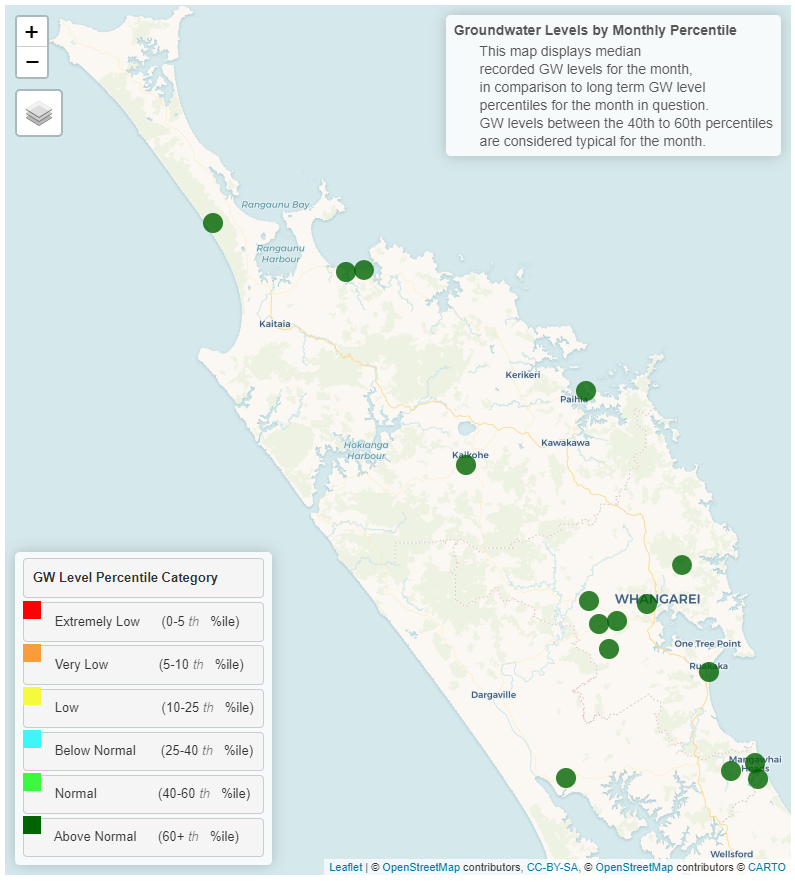
Groundwater
All key aquifers in Northland are currently recording “Above Normal” water levels for February. With substantial recharge occurring during the cyclone across Northland, and in the Mangawhai aquifer during the thunderstorm.
| Aquifer | Status | Percentile |
| Aupōuri | Above normal | 60th+ |
| Taipā | Above normal | 60th+ |
| Russell | Above normal | 60th+ |
| Kaikohe | Above normal | 60th+ |
| Poroti | Above normal | 60th+ |
| Whangārei | Above normal | 60th+ |
| Mangawhai | Above normal | 60th+ |
| Marsden - Ruakākā | Above normal | 60th+ |
| Ruawai | Above normal | 60th+ |
Groundwater map for February 2023
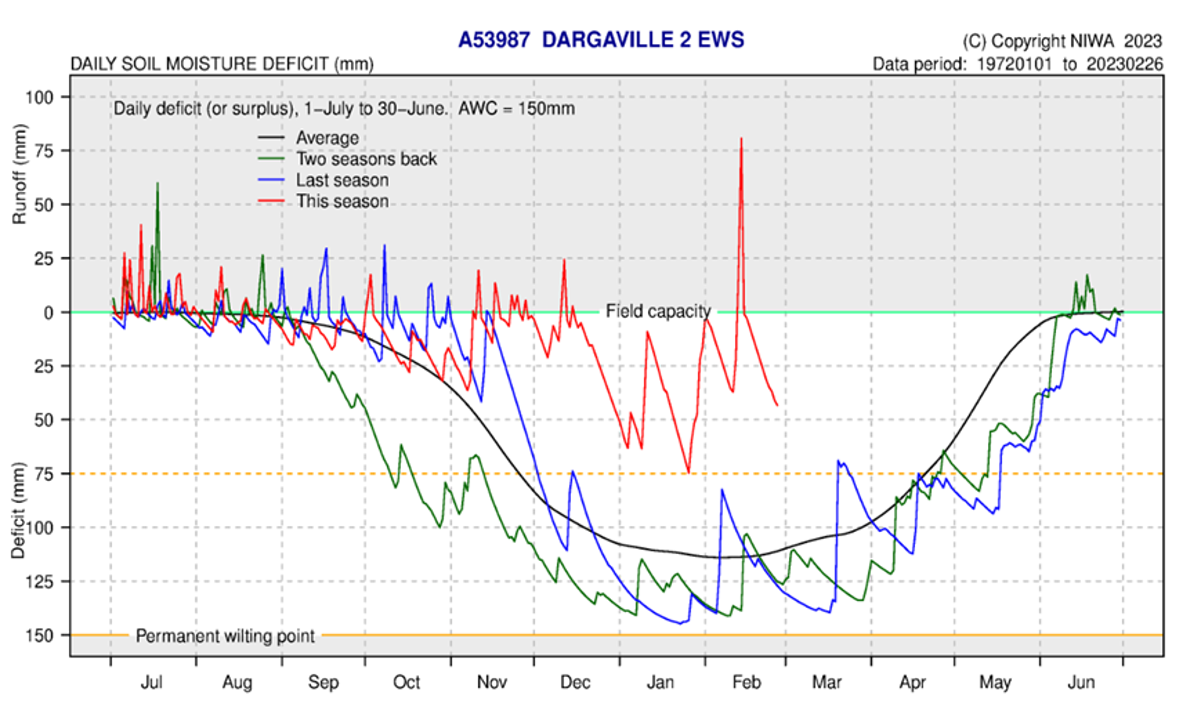
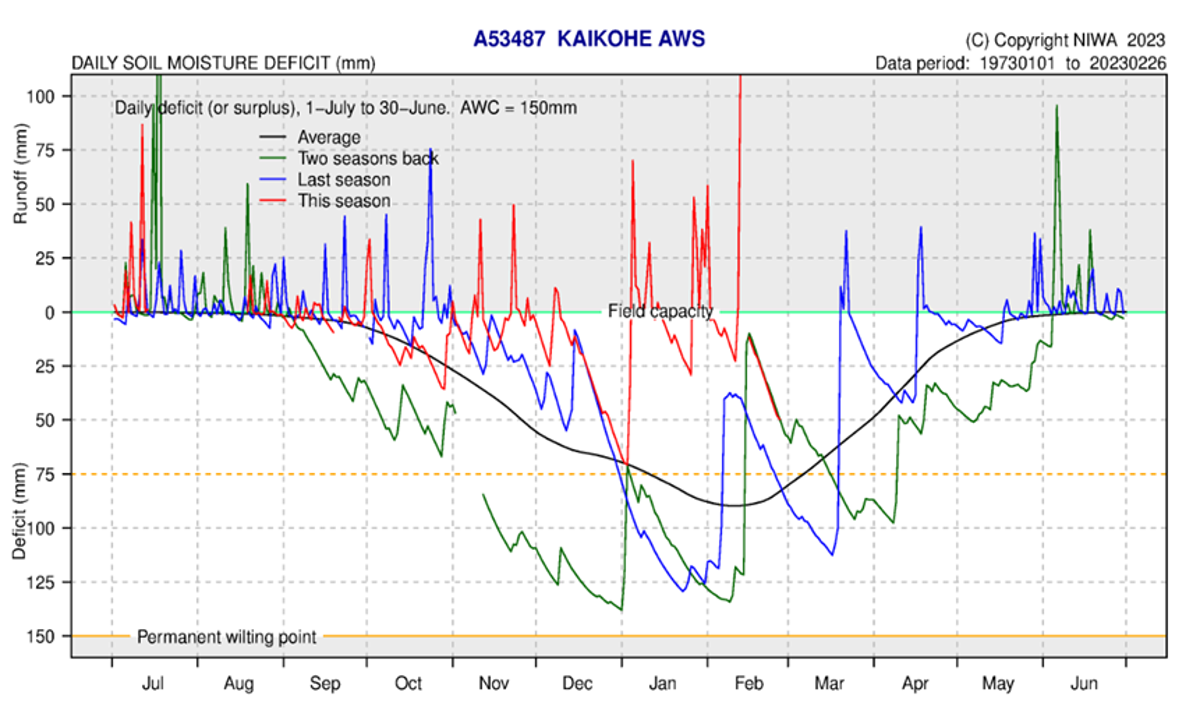
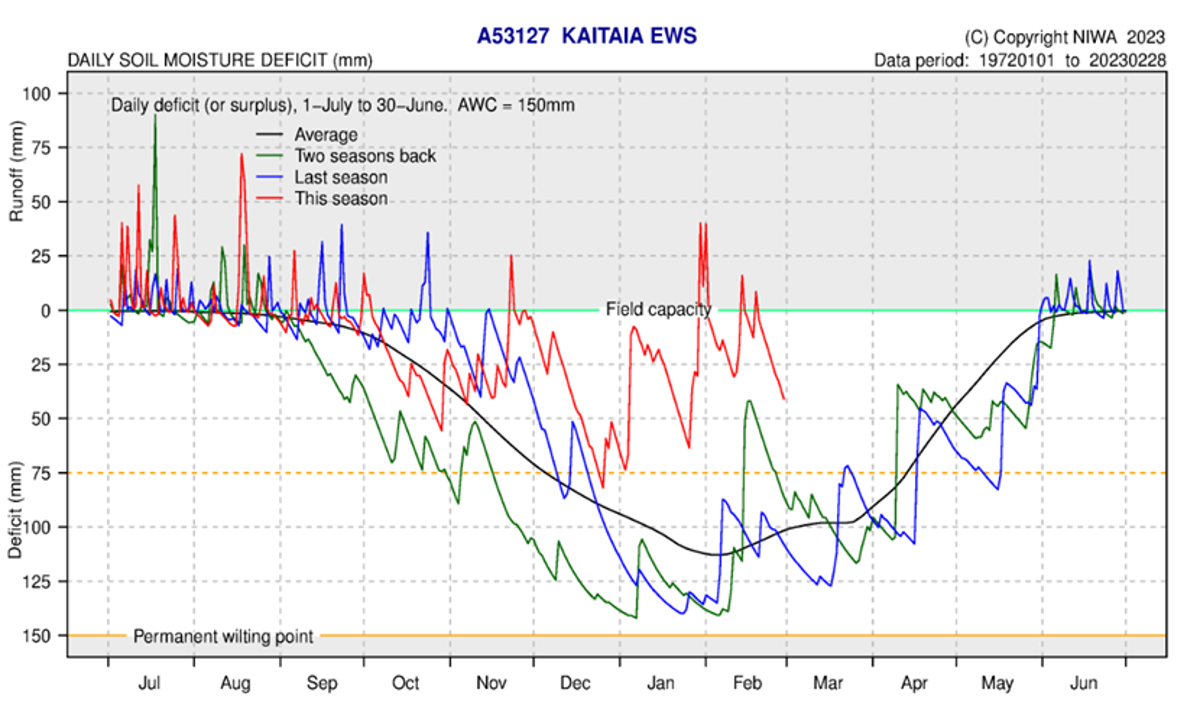
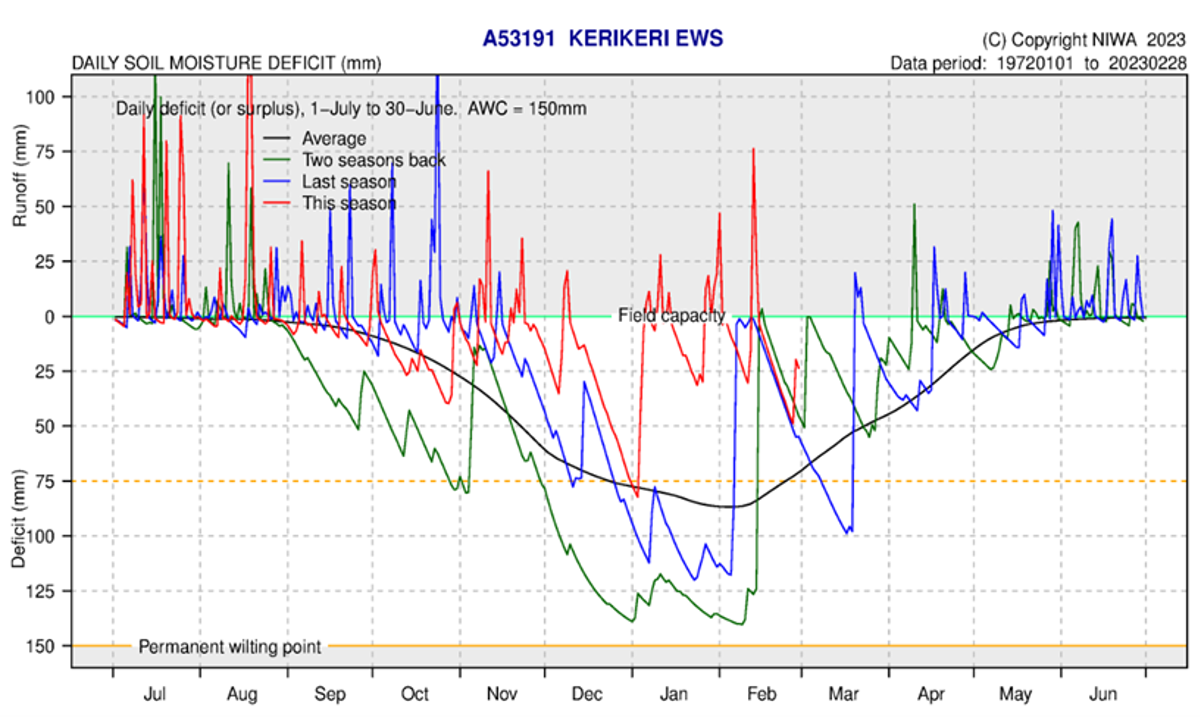
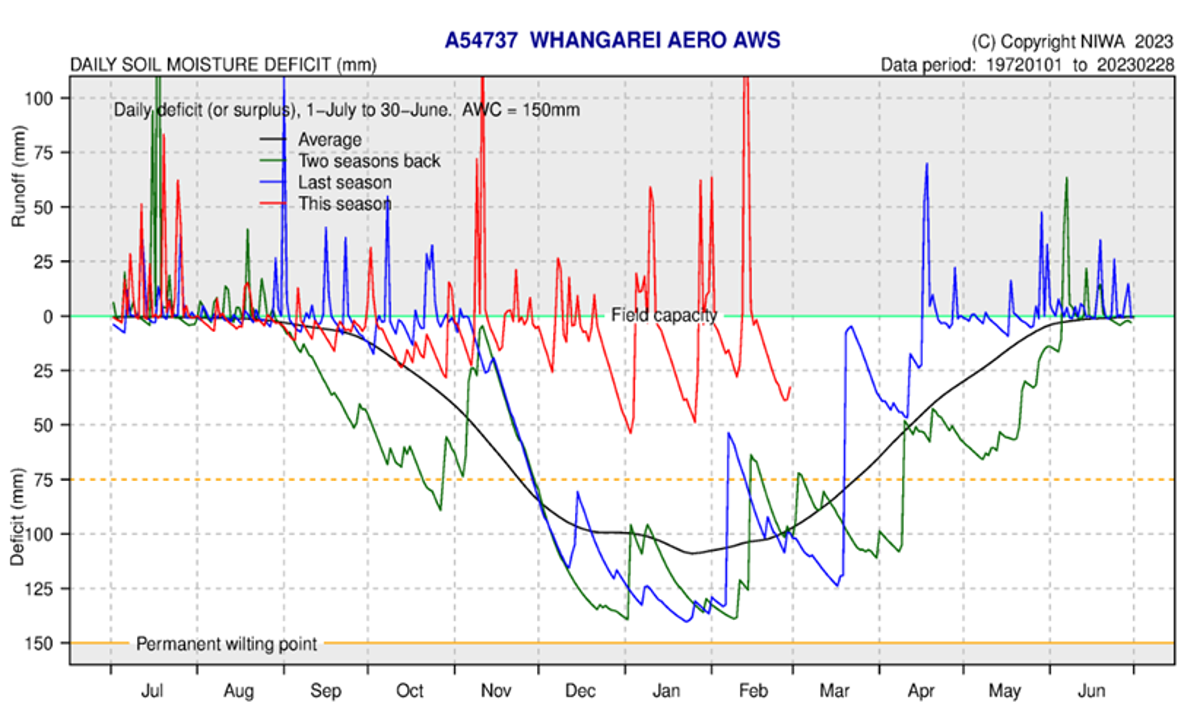
Soil moisture
Northland has experienced a far wetter than usual summer, this has resulted in higher-than-average soil moisture across Northland.
February began with soils at or above field capacity, with the fine weather for the first 10 days of the month allowing moisture levels to begin to dry out. All sites where soil moisture is calculated saw a sharp increase, with substantial run off during cyclone Gabrielle. At the end of the month Warkworth received rainfall in a second event and experienced a further run off.
Moving into March, the whole region currently has a mild deficit of 25 - 50 mm, other than Warkworth which is at field capacity. Any large rainfall events are likely to result in surface runoff.
The soil moisture deficit is calculated based on incoming daily rainfall (mm), outgoing daily potential evapotranspiration (mm), and a fixed available water capacity (the amount of water in the soil 'reservoir' that plants can use) of 150 mm” (NIWA).