Ex Tropical Cyclone Gabrielle - Hydrology report 20 February 2023
20 Feb 2023, 2:07 PM
Please note this report is based on provisional data, that has yet to be checked and processed in accordance with our quality system.
Rainfall map for the region, showing accumulated rainfall totals from 11 February 12:00 to 14 February 12:00 (72 hours).
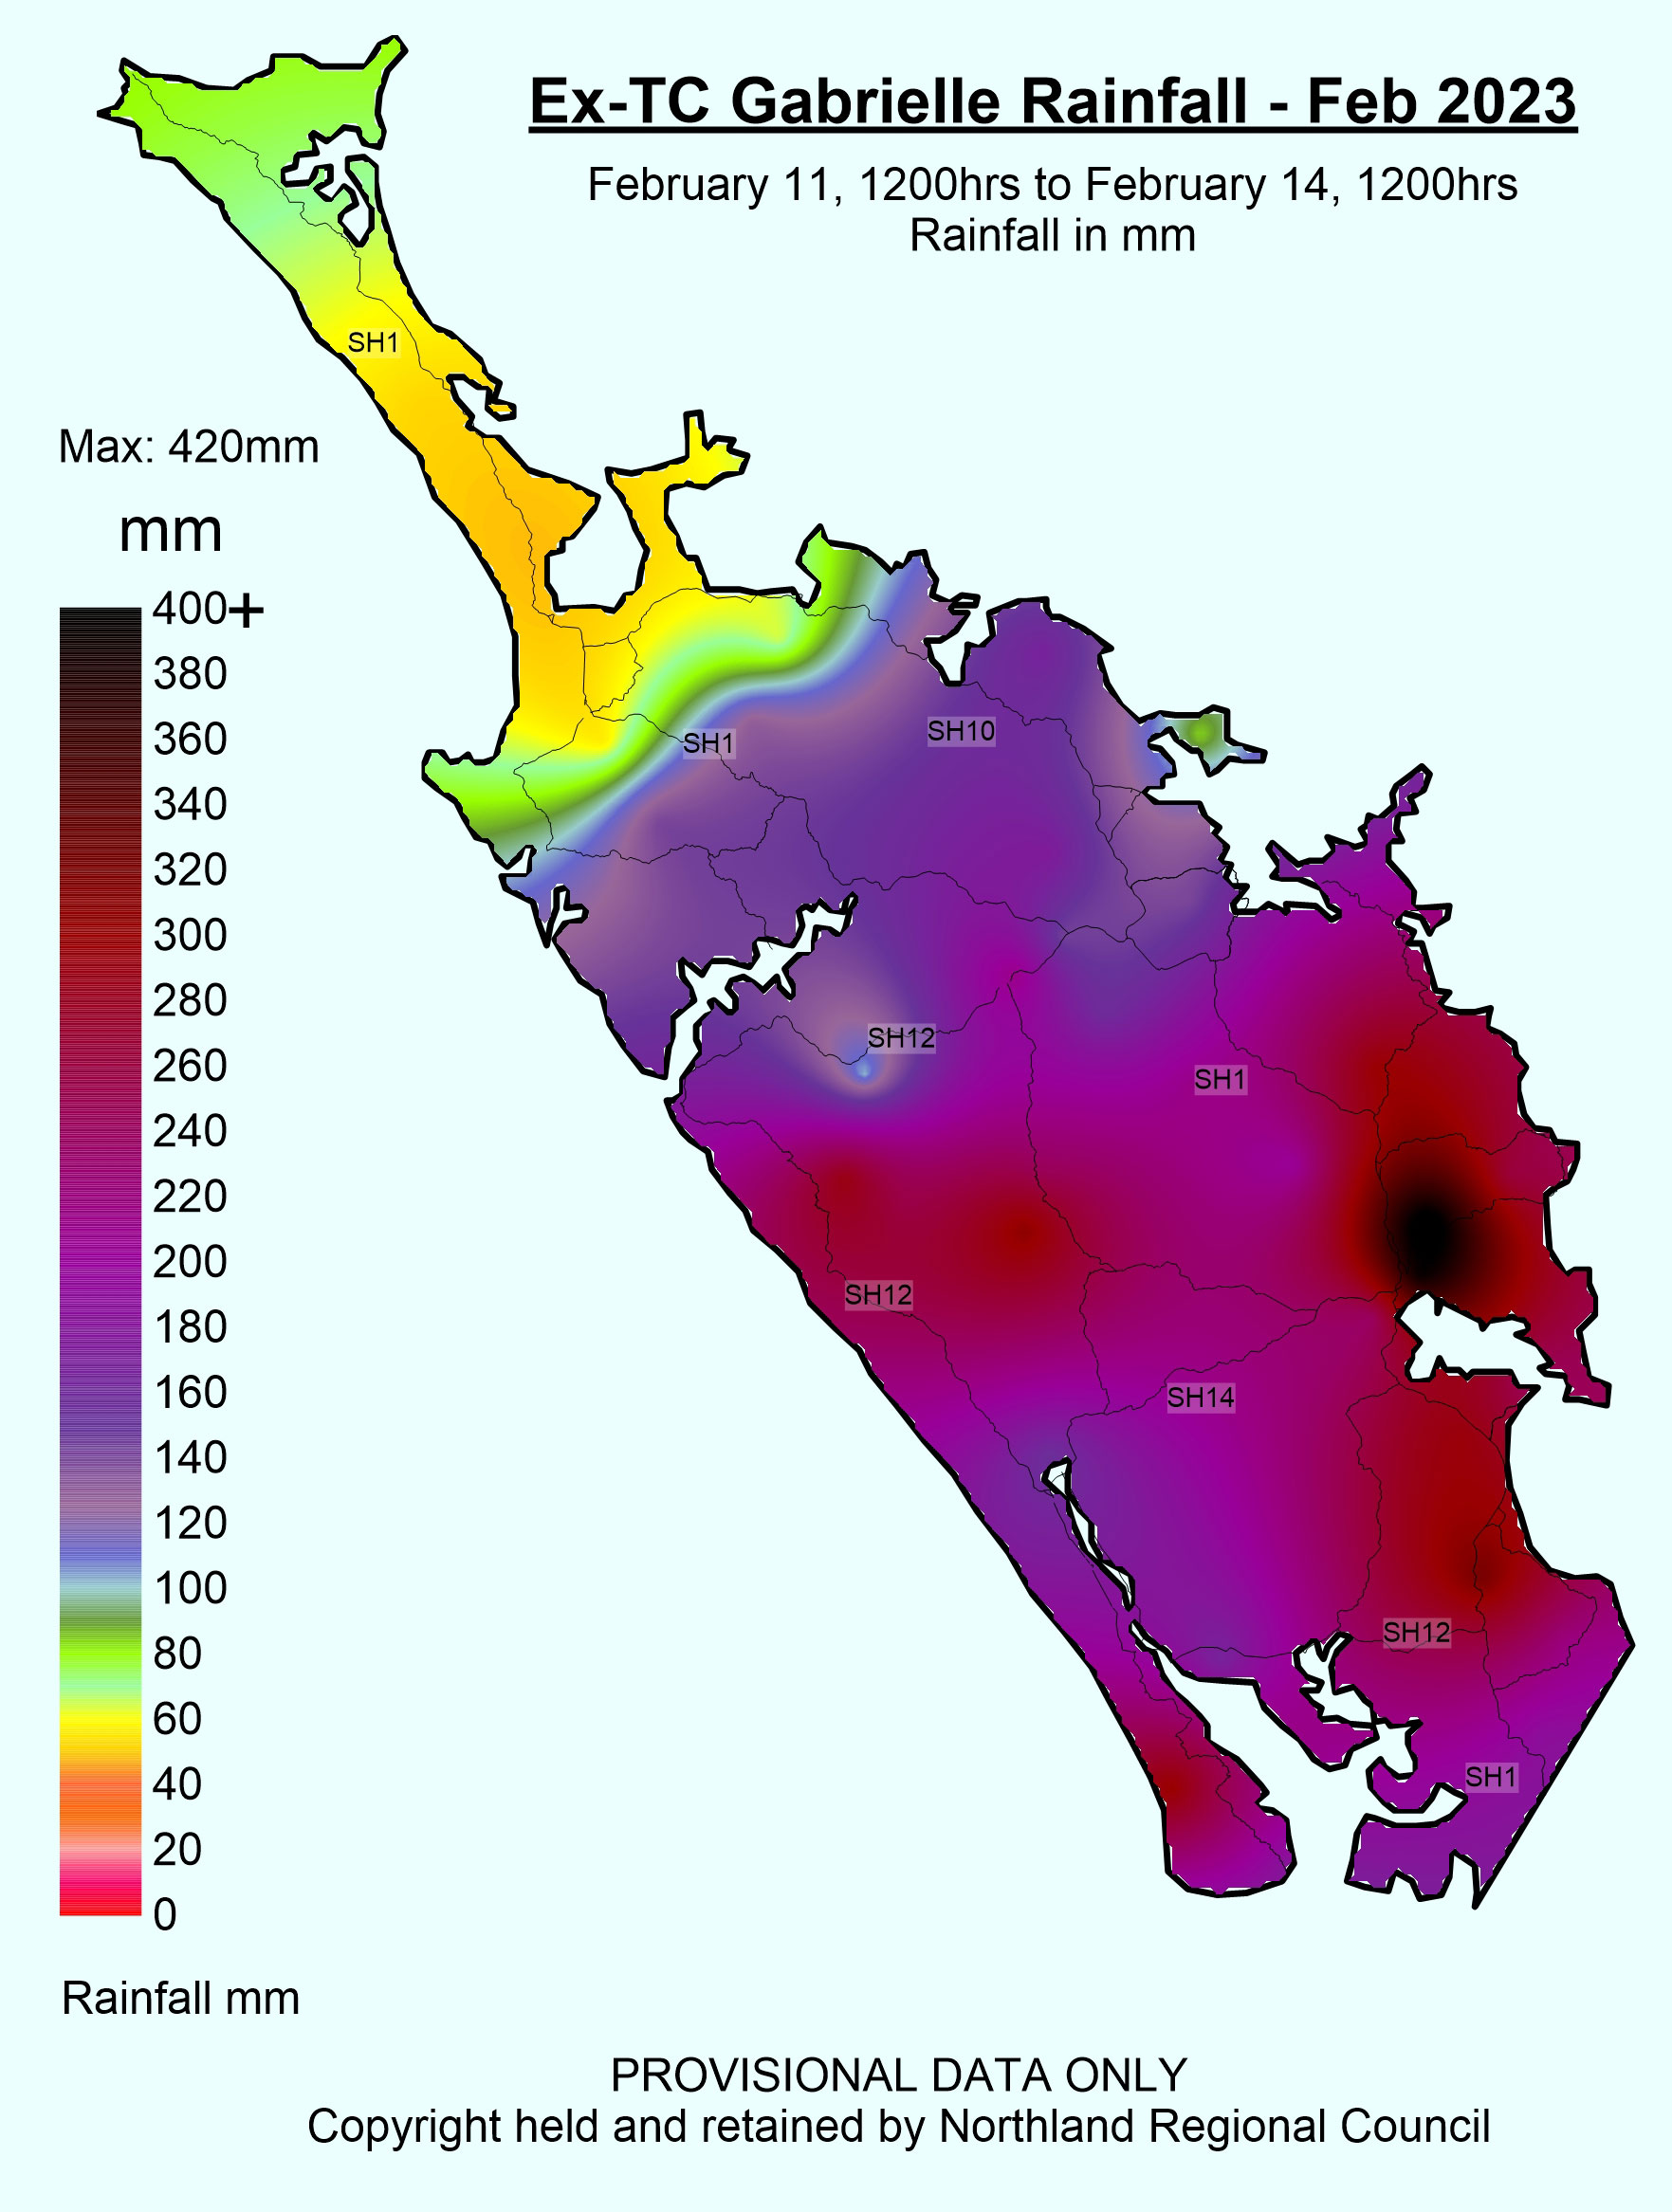
The heaviest rainfall was initially concentrated along the East Coast from Whangaroa Harbour Southwards, driven in by strong Easterly winds. As the centre of the storm moved Southwards, winds changed to the South-West bringing heavy rain into the South and West of the region.
The highest rainfall totals were recorded near Whangarei with 420mm recorded in the Hatea at Glenbervie Forest, and 396mm recorded at the Waiarohia at NRC Water Street.
Below is a list of rainfall recording stations that recorded 1 in 100 year return period rainfall totals over 48 hours:
- Waihoihoi at Brynderwyns
- Hātea at Glenbervie Forest
- Okoraka at Ngatawhiti Road
- Waiwarawara at Wilson’s Dam
- Kaipara Harbour at Poutō Point
The Waiarohia at NRC Water Street exceeded the 1 in 100 year return period for 48 hours, and further analysis will be required to determine this.
The heavy rain led to very high river levels and flows. Some river level recording stations recorded new maximums during this event, as shown in the table below:
| Site name | Previous maximum | New maximum |
| Mangakahia at Titoki Bridge | 14.685m (2011) | 4.626m (2014) |
| Wairua at Wairua Bridge | 5.6m (1966) | 5.655m |
| Manganui at Permanent Station | 8.505m (1976) | 8.927m |
| Hakaru at Topuni Creek Farm | 4.626m (2014) | 5.186m |
As the centre of Ex-Tropical Cyclone Gabrielle moved past Northland our network recorded some very low barometric air pressures. These pressures are displayed over the time of the event on the graph below. The lowest pressure recorded was 964 hPa. (Standard Atmospheric pressure is 1013 hPa).
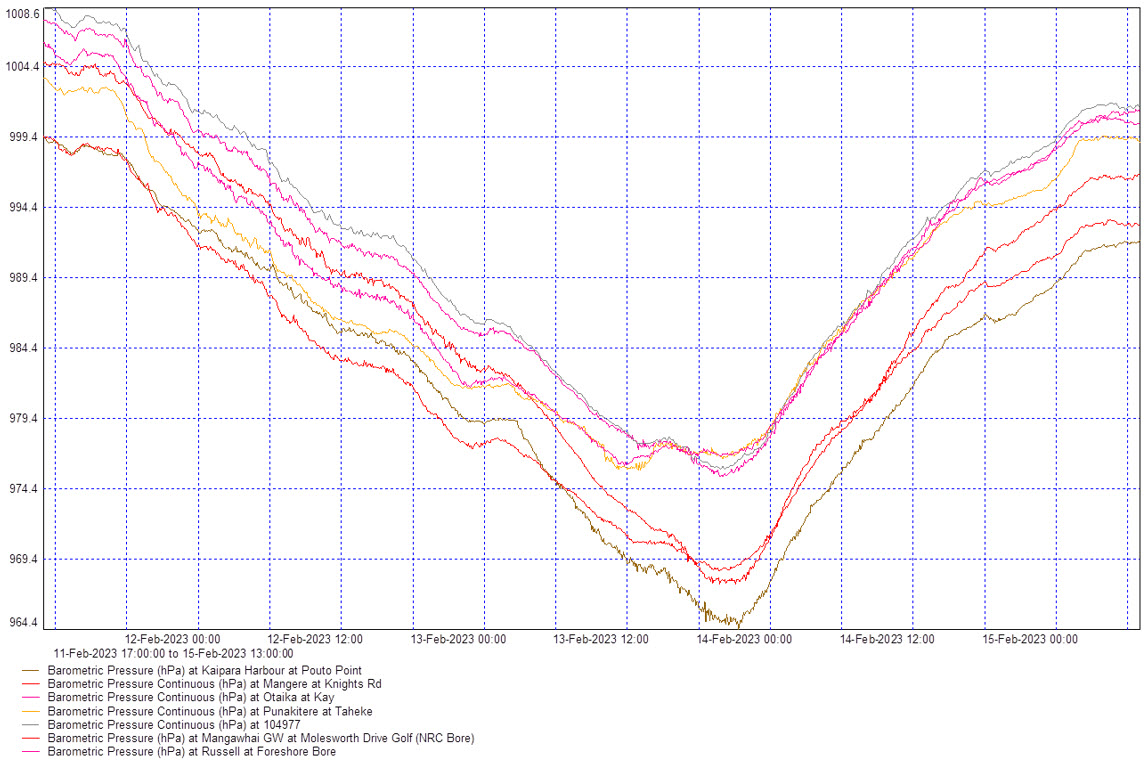
Barometric air pressures graph for Ex-Tropical Cyclone Gabrielle.
Disclaimer:
Users are reminded that Northland Regional Council data is provided in good faith and is valid at the date of publication. However, data may change as additional information becomes available. For this reason, information provided here is intended for short-term use only. Users are advised to check figures are still valid for any future projects and should carefully consider the accuracy/quality of information provided before using it for decisions that concern personal or public safety. Similar caution should be applied for the conduct of business that involves monetary or operational consequences. The Northland Regional Council, its employees and external suppliers of data, while providing this information in good faith, accept no responsibility for any loss, damage, injury in value to any person, service or otherwise resulting from its use. All data provided is in NZ Standard Time. During daylight saving, data is one hour behind NZ Daylight Time.