March 2023 climate report
11 Apr 2023, 3:09 PM
Summary
- La Niña conditions have ended with the ENSO climate driver now being in neutral conditions.
- El Niño could develop in early winter and spring.
- Temperatures and rainfall are likely to be “near average” for the rest of autumn and the start of winter.
- Rainfall in March was below average, with Northland receiving only 47 % of the expected rainfall for March.
- Most rivers recorded “above normal” or “normal” flows in March.
- All key aquifers in Northland recorded “above normal” water levels for March.
- Soil moisture levels in March receded quickly, with all of Northland in a deficit at the end of the month, most sites are around average for March.
Climate Outlook
April to June 2023
The La Niña conditions have ended in March, with the ENSO has moved into neutral conditions, it is likely that these conditions will continue though out autumn, with there being a 65 - 70% of El Niño developing during winter. It is not likely a predominate wind direction will form during autumn, but through winter this will turn more southerly. It is likely that temperatures will be “near average” or “above average”. Rainfall, river flows and soil moisture are likely to be “near average” between April and the end of June. If El Niño conditions develop June could be drier than “normal”.
For more details, please refer to NIWA’s seasonal climate outlook for March - May 2023:
See the seasonal climate outlook on NIWA's website: niwa.co.nz
NIWA Temperature, Rainfall, Soil Moisture and River Flows probabilities for the period of March - May 2023
(Expressed as % likelihood for either Above Average, Near Average or Below Average conditions).
| Temperature | Rainfall | Soil moisture | River flows | |
| Above average | 45• | 20 | 10 | 15 |
| Near average | 45• | 45• | 45• | 45• |
| Below average | 10 | 35 | 45 | 40 |
Rainfall
What a difference a month makes! March across Northland was particularly dry and after a very wet start to the year was a welcome relief to majority of people.
Several small thunderstorm events passed through which is where majority of the rain came from for the region. On average Northland had 42 mm, with the Otaika Valley southwest of Whangārei having the lowest total with 13 mm recorded, while the highest totals were recorded in Kaikohe with 78.4 mm, and Tutamoe recording 72 mm, most of this rainfall came from thunderstorms on 18 March.
Compared to the average expected rainfall for the month, Northland received only 47%. In the southwest on the Pouto Peninsula 90 – 100% of the expected was recorded, while in the east around Whangārei recorded only 12 - 14% of each sites respective average.
Rainfall (% of Median) for February 2023 across Northland with a range of 100% to 12%
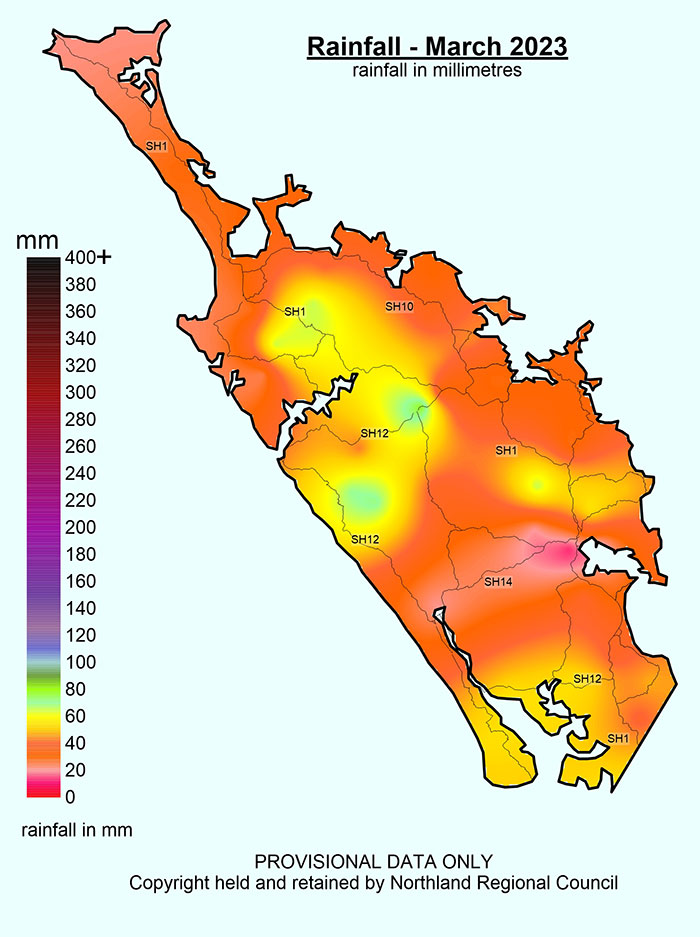
Rainfall (% of Median) for February 2023 across Northland with a range of 100% to 12%.
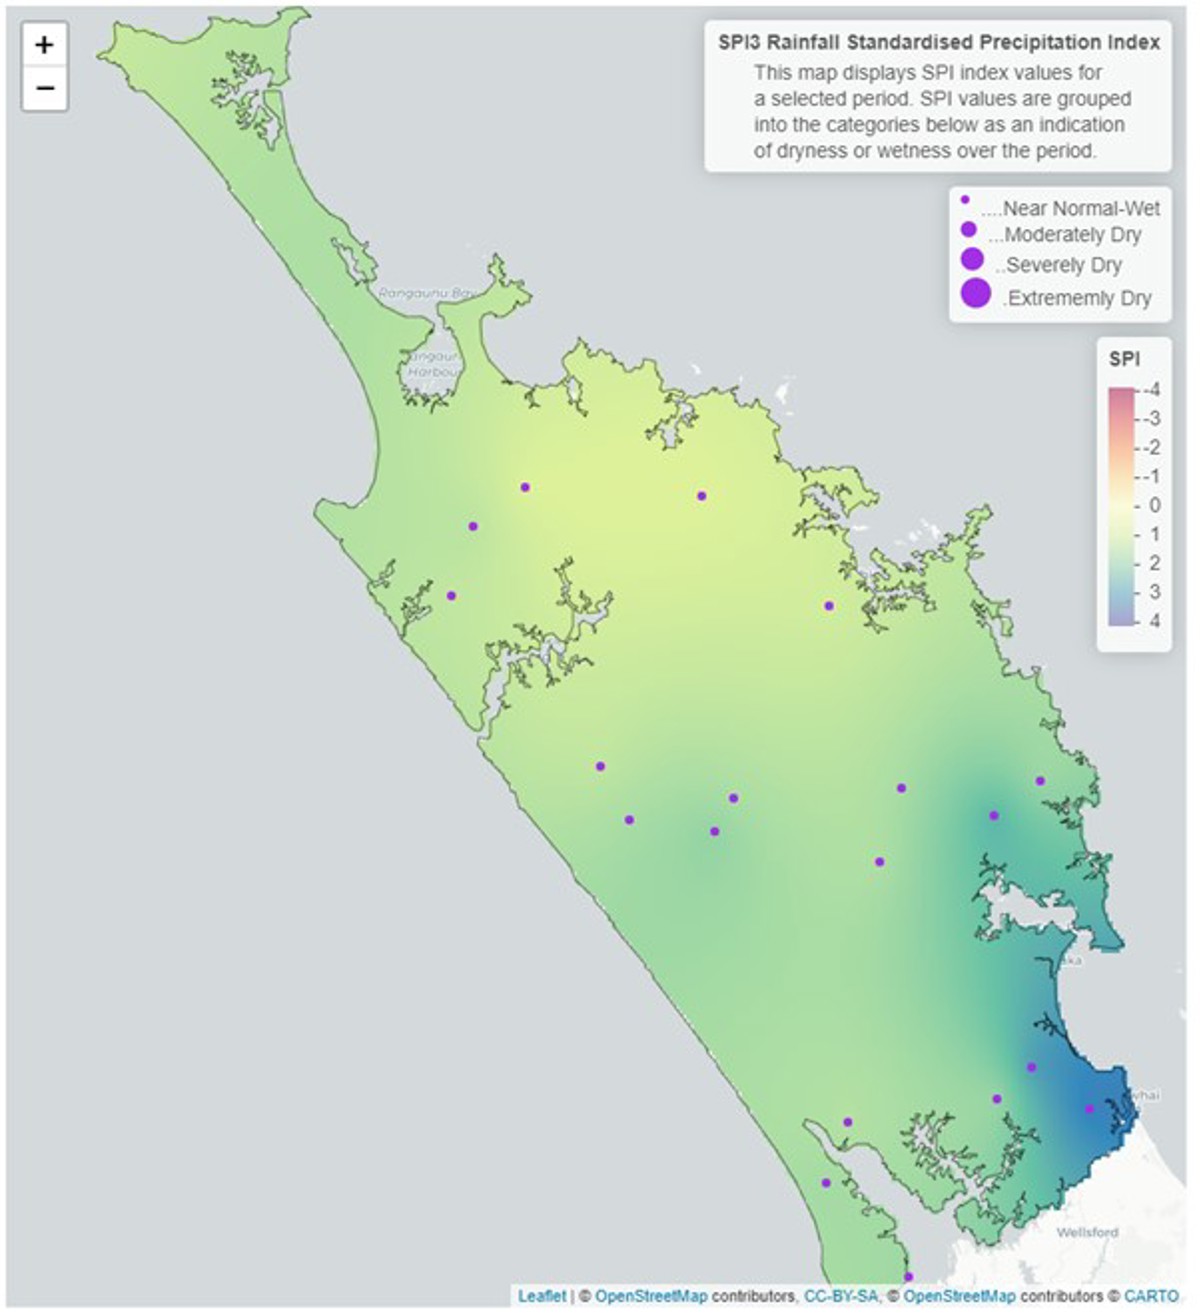
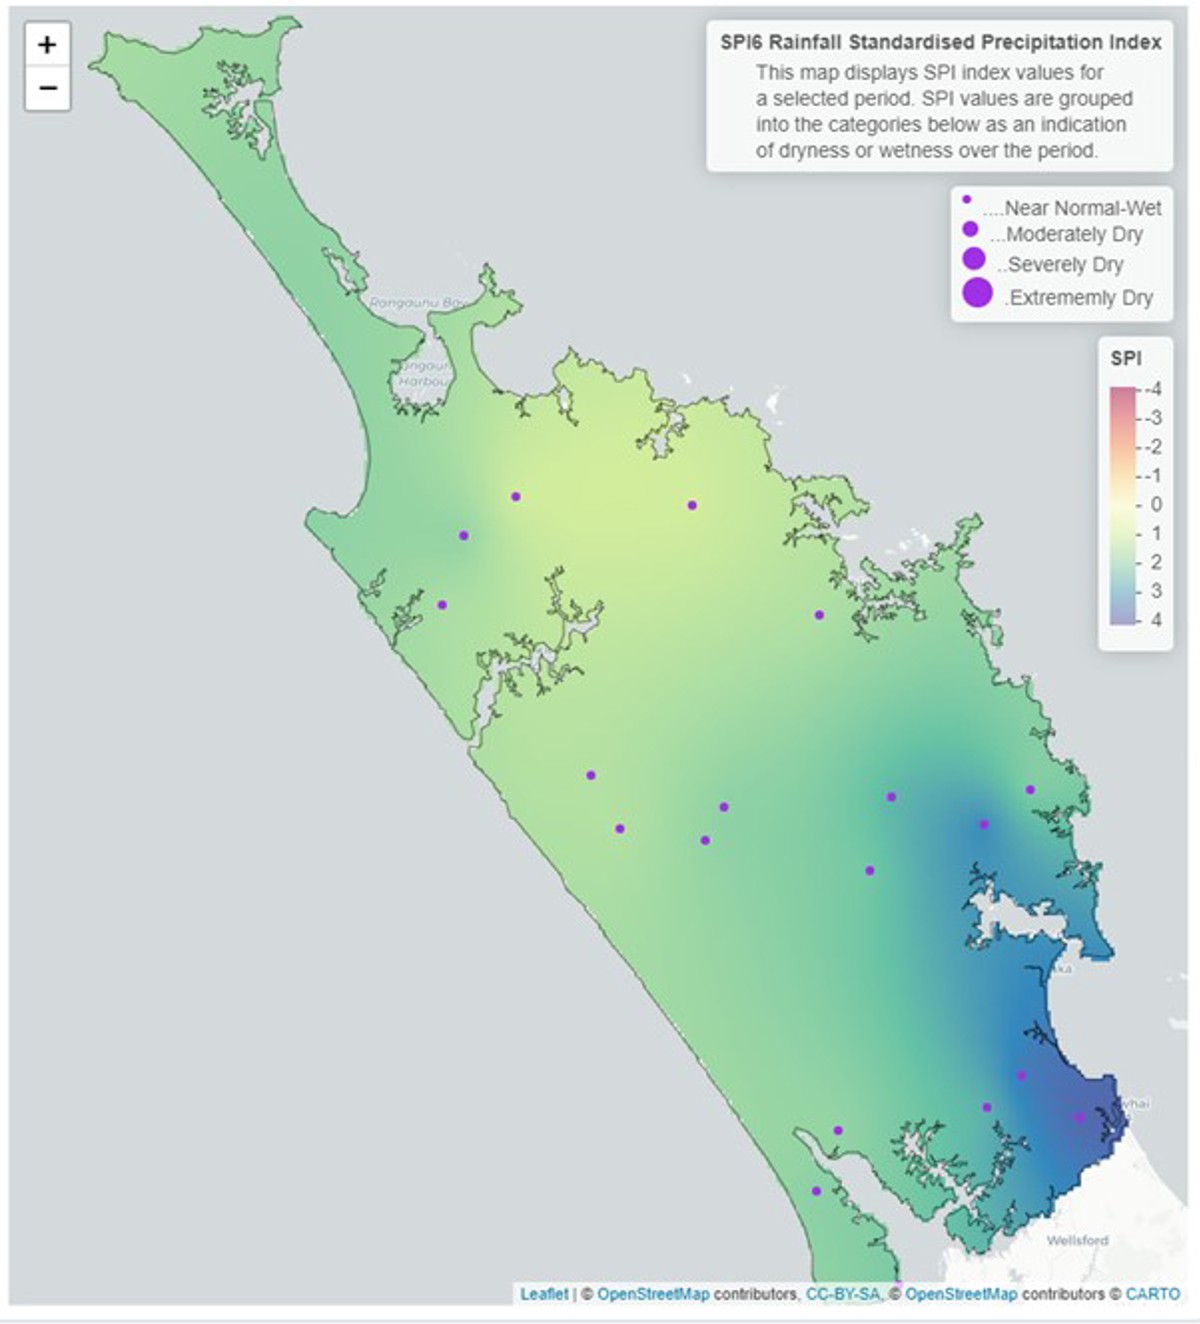
Standardised Precipitation index (SPI)
The Standardised Precipitation Index (SPI) on a three-month scale shows that all of Northland has been “near normal or wet” between January to March 2023, following from a very wet January and February particularly in the south and east.
The six-month SPI shows “near normal or wet” conditions for Northland from October to March. Note that these maps are not comparable to previous maps due to the change in scale, previously the SPI maps have plotted between -3 to 3, the maps in this report are using a scale of -4 to 4 due to the unprecedented amount of rain in February.
3 and 6-Month SPI (Standardised Precipitation Index) maps.
River flow
After a wet January and February most river levels are still “above normal” for March, while levels have begun to drop to “normal” in some areas and were “below normal” in Kaeo. The low river levels recorded south of Kaitaia are due to data being recorded from a different area of the river and should be used with caution.
Monthly percentile River Flows for March 2023
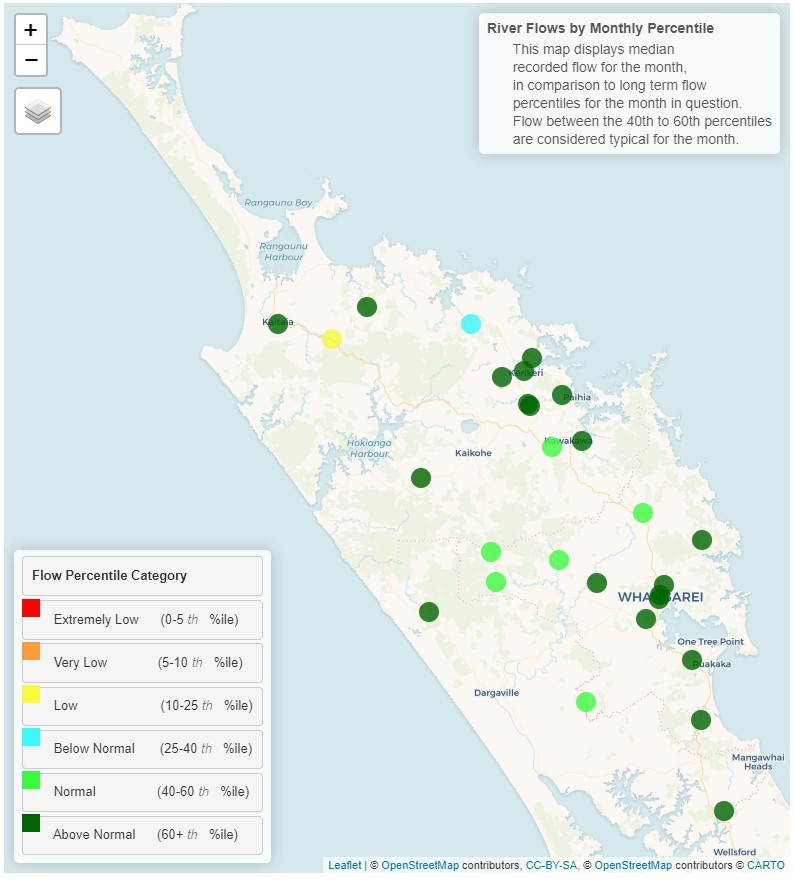
Monthly percentile river flows for March 2023.
Groundwater
All key aquifers in Northland are currently recording “Above Normal” water levels for March. With substantial recharge occurring during the cyclone across Northland, and in the Mangawhai aquifer during the thunderstorm, and levels holding well through the drier month of March.
| Aquifer | Status | Percentile |
| Aupōuri | Above normal | 60th+ |
| Taipā | Above normal | 60th+ |
| Russell | Above normal | 60th+ |
| Kaikohe | Above normal | 60th+ |
| Poroti | Above normal | 60th+ |
| Whangārei | Above normal | 60th+ |
| Mangawhai | Above normal | 60th+ |
| Marsden - Ruakākā | Above normal | 60th+ |
| Ruawai | Above normal | 60th+ |
Groundwater map for March 2023
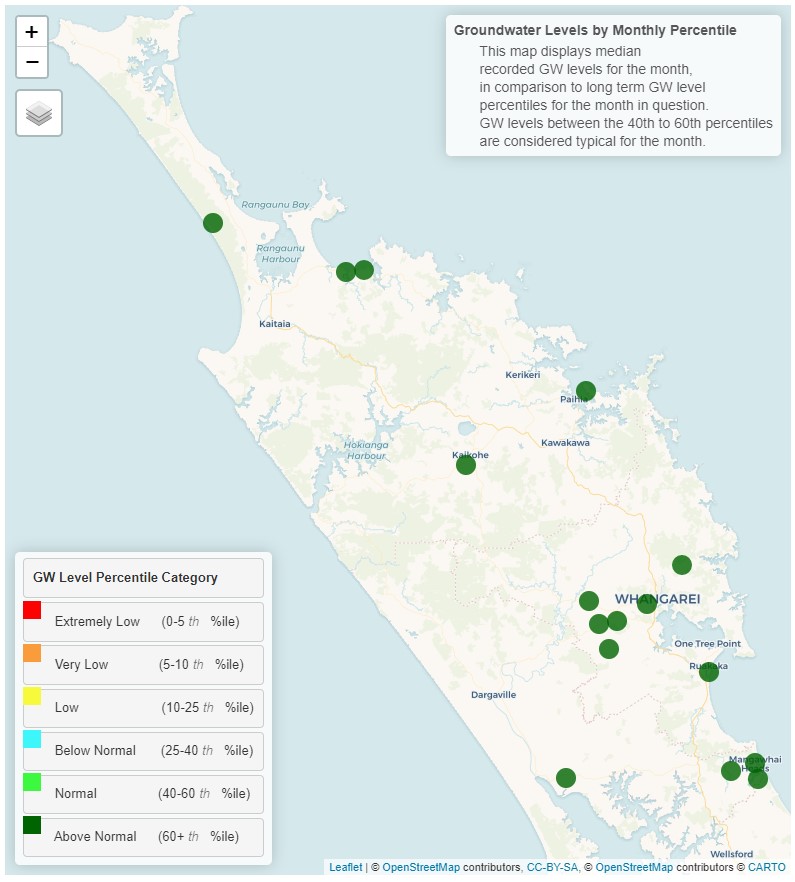
Groundwater map for March 2023.
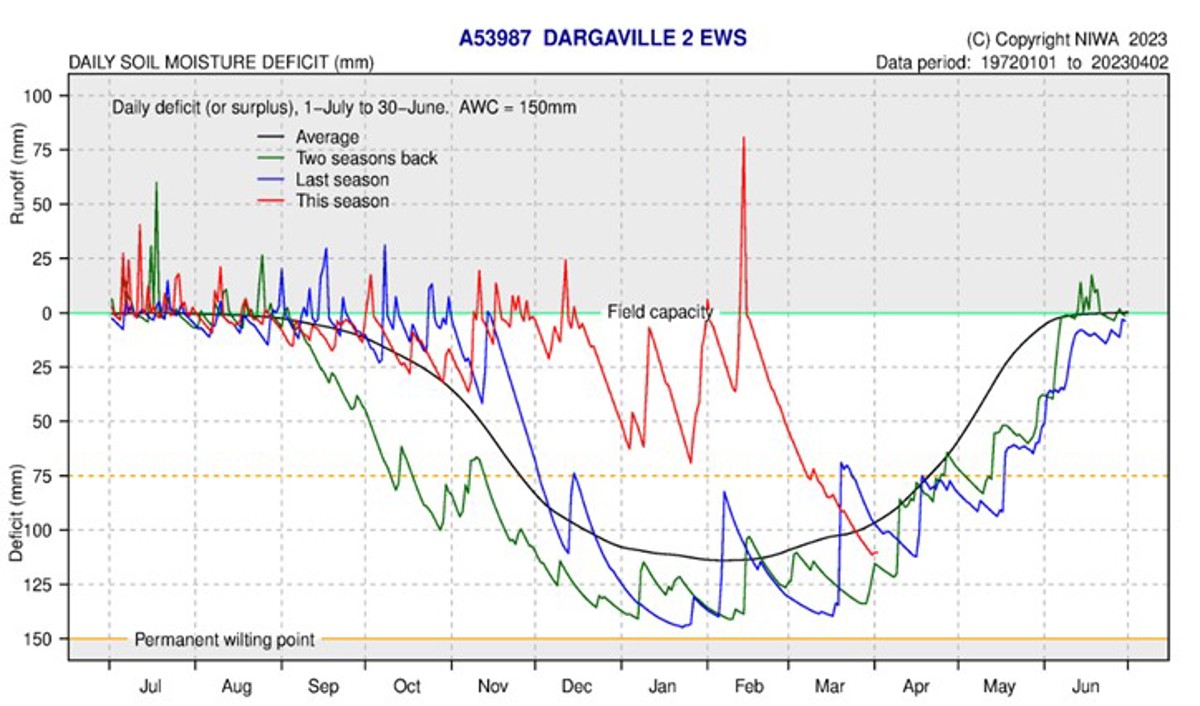
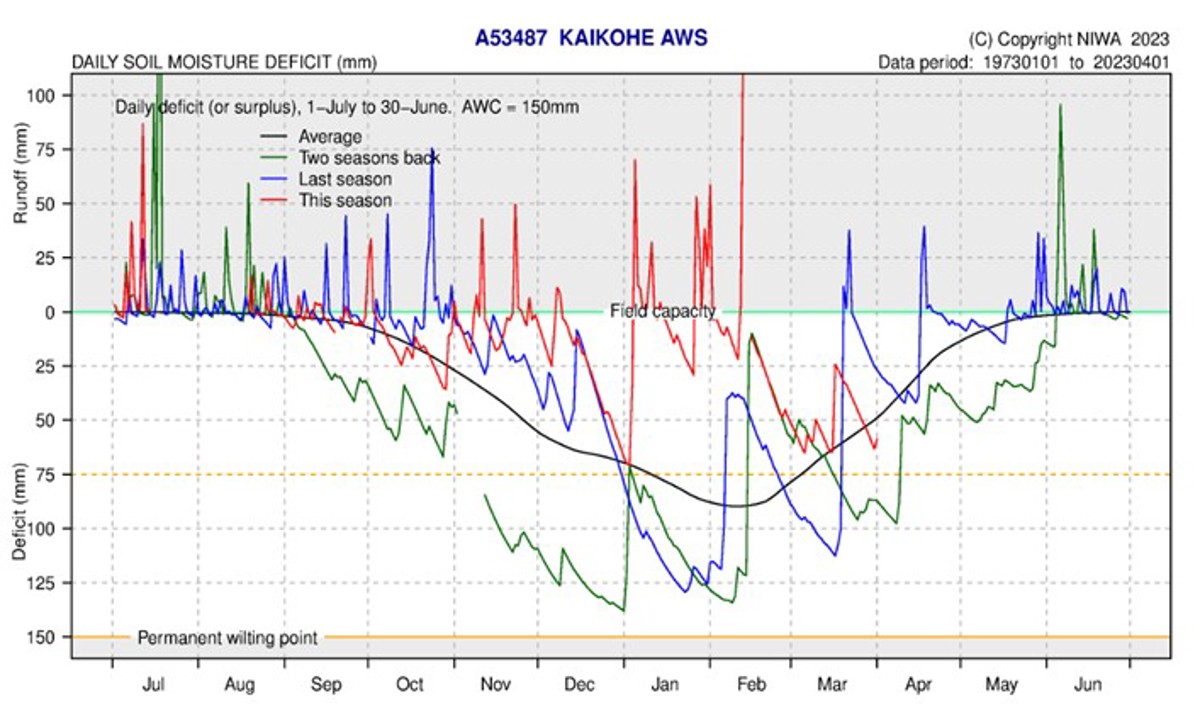
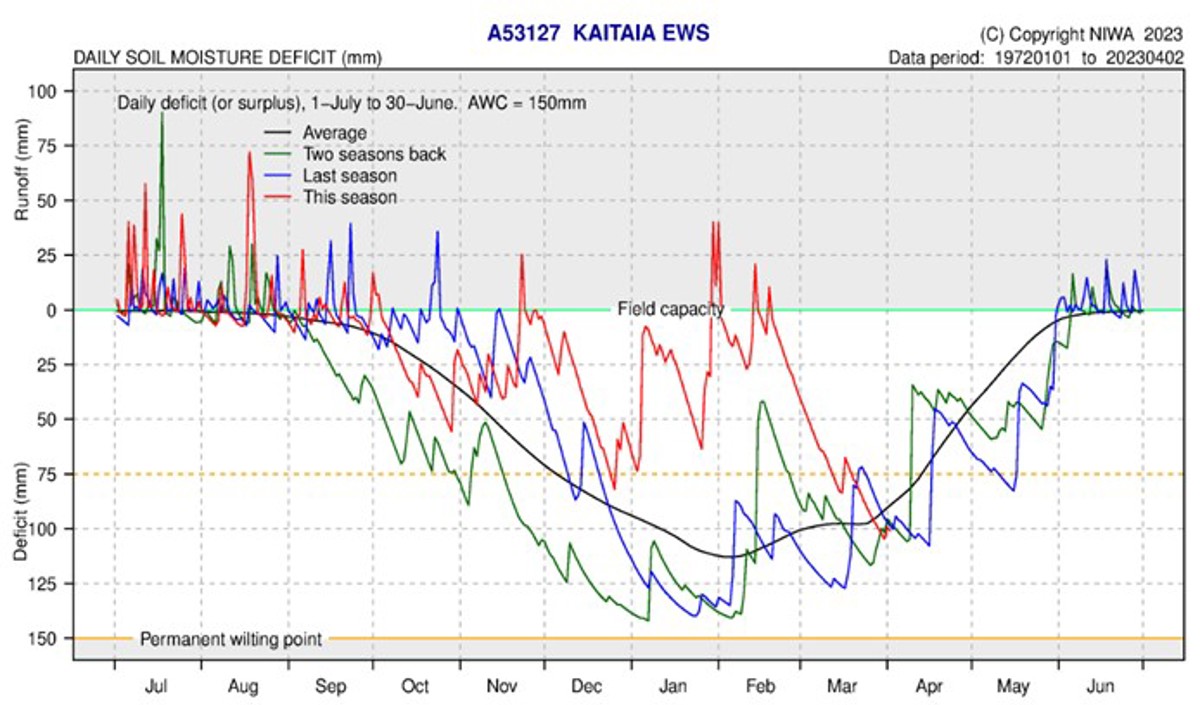
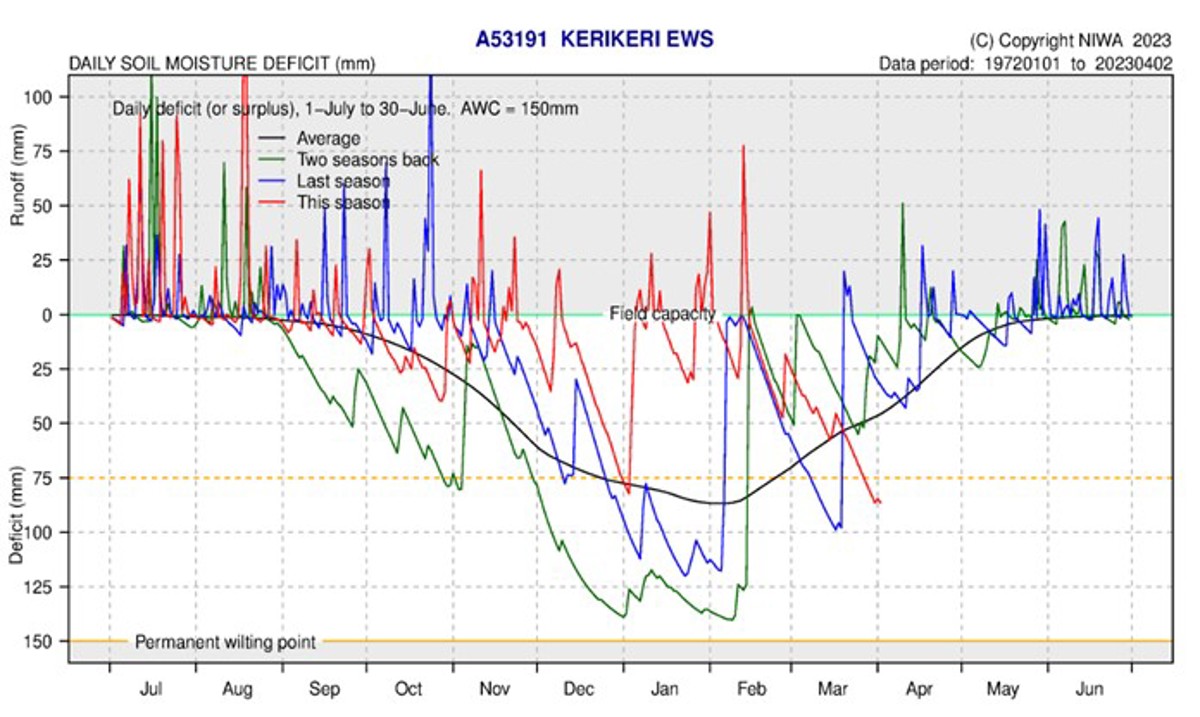
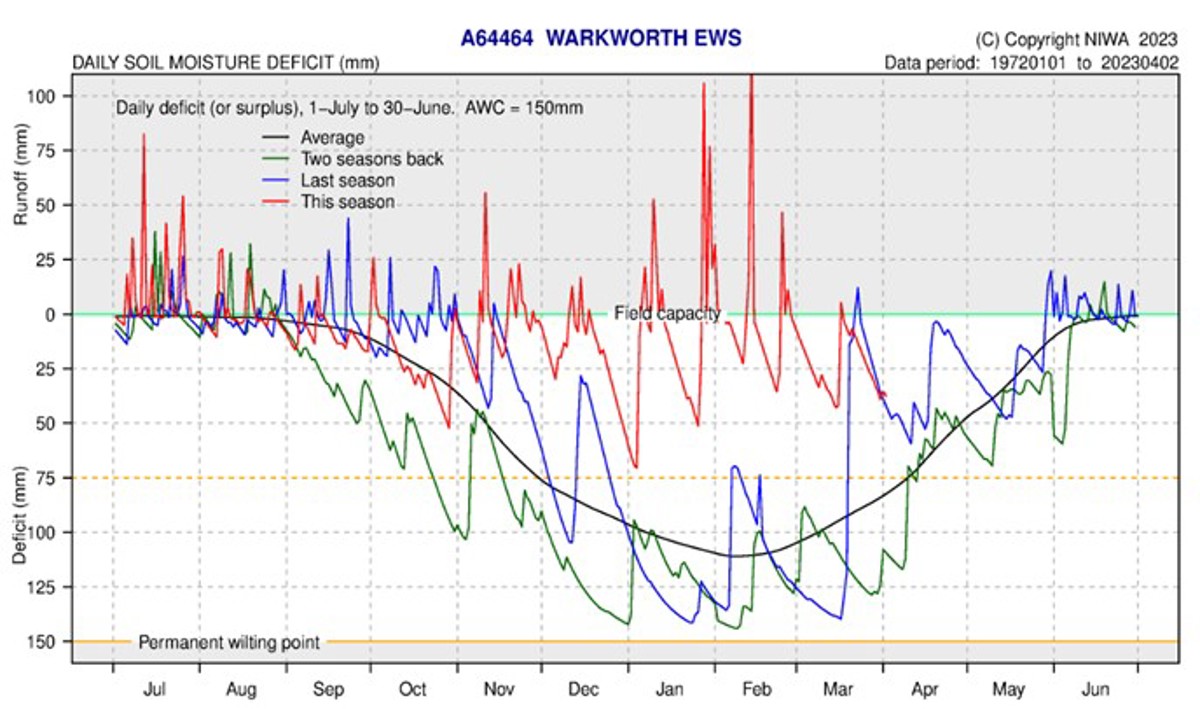
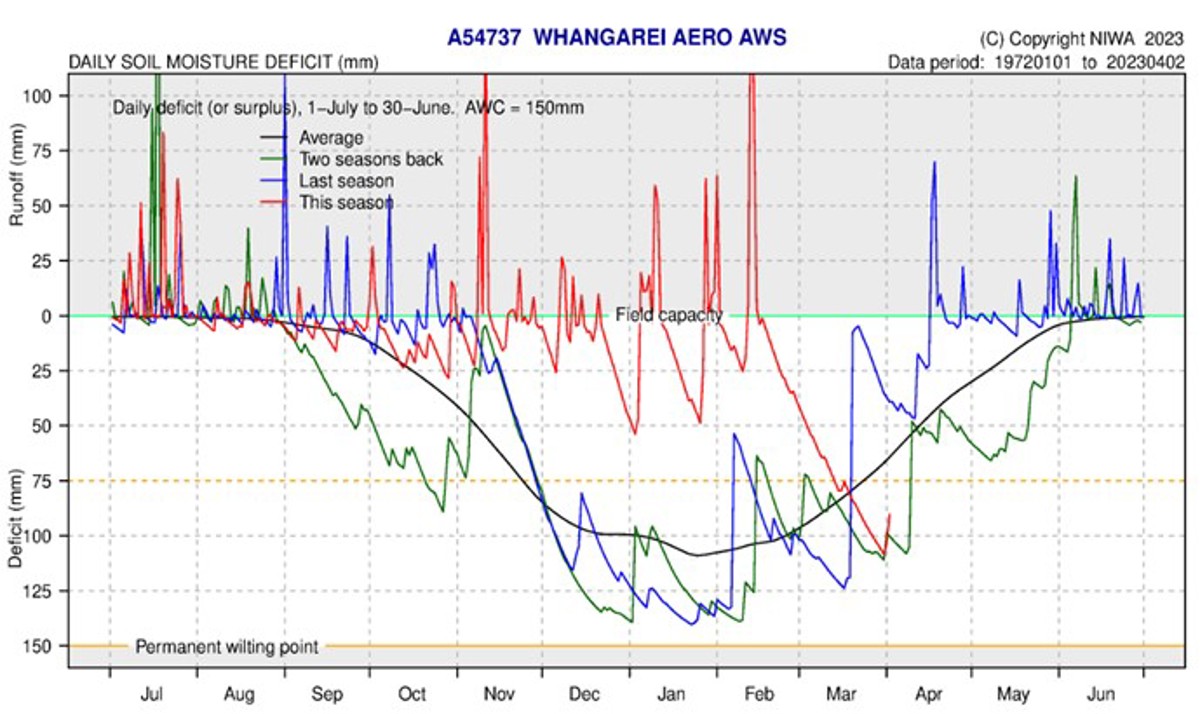
Soil moisture
March has been significantly drier than the start of the year and the soil moisture across Northland reflects that, with moisture levels receding throughout the month. Kaikohe and Warkworth did show an increase to field capacity to the thunderstorm events recorded in the area during the month.
At the end of March and heading into April all sites are sitting at a deficit of approximately 75 mm, and close to the average for March for most sites. The only anomalies to this are Kerikeri which is currently substantially below average, and Warkworth which continues to maintain soil moisture levels above average.
The soil moisture deficit is calculated based on incoming daily rainfall (mm), outgoing daily potential evapotranspiration (mm), and a fixed available water capacity (the amount of water in the soil 'reservoir' that plants can use) of 150 mm” (NIWA).