July climate report 2019
26 Jul 2019, 7:30 AM
Summary
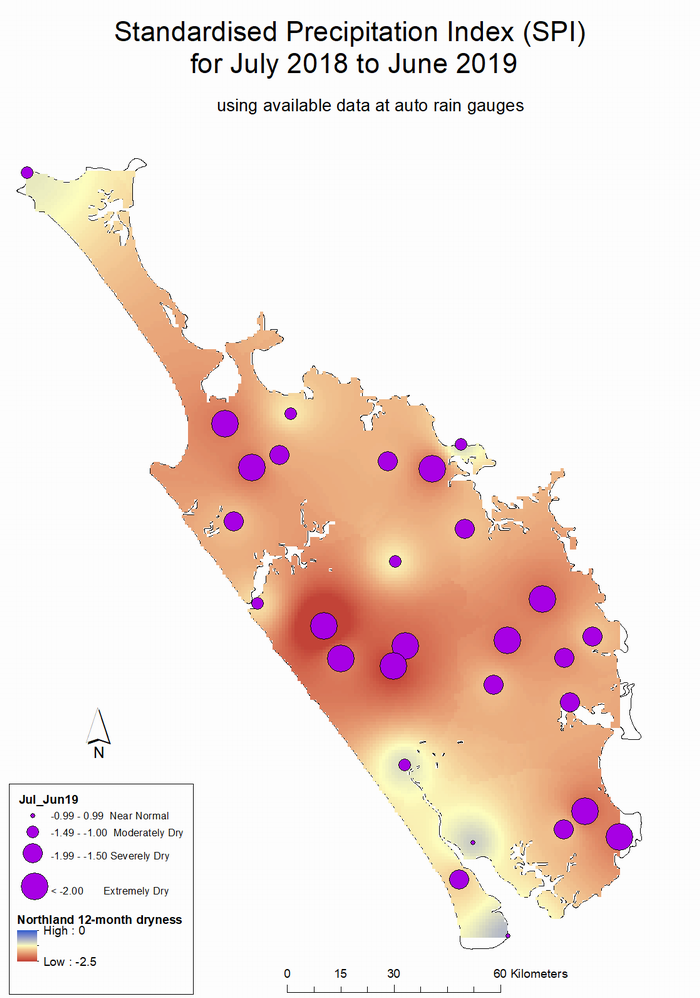
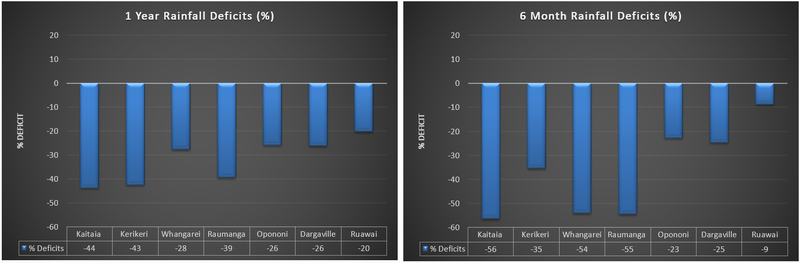
Although more rain was recorded in June 2019 than previous months of the year, this was still drier than normal for this month, with the region only receiving around 66% of the expected rainfall. June is typically categorised as wet with unstable weather patterns, and although we certainly observed some of this instability, there were no rainfall events of any significance. Looking back at the whole period of dry weather so far (previous 12 months, starting June 2018), the NRC SPI index rates the Awanui, Kerikeri, and Wairua catchments, as well as the Parataiko/Tutamoe Ranges and parts of Bream Bay, as “extremely dry”. It is important to note that Kaitaia, Kerikeri and Whangārei all have very large rainfall deficits for the previous 12 months of -44%, -43% and -28/-39% (Whangārei/Raumanga), respectively. This is a measure of the rainfall received vs the rainfall expected, and indicates that Kaitaia and Kerikeri have received just over half the rainfall expected for this 12-month period compared to typical rainfall for the same 12-month period.
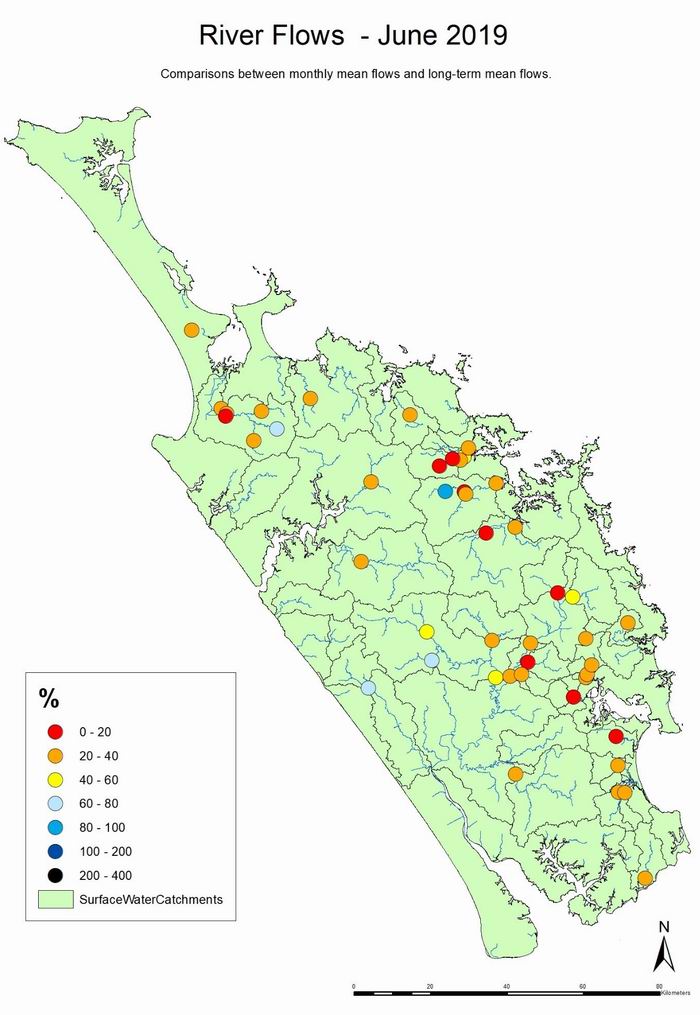
River flows were higher than the previous months of the year so far, but many stations recorded between 20-40% of expected monthly mean flows, and some remained in the 0-20% range. This is the result of the persistence of below average monthly rainfall through June.
Soil moisture is now around average for this time of year at field capacity at all locations. However, groundwater levels remain low at many locations, with Taipa, Kaikohe, Whangārei, Marsden-Ruakaka, Mangawhai and Poroti aquifers were below average for June 2019. Notably, Poriti, Mangawhai, Whangārei, Kaikohe and Taipa groundwater systems at below the 20th percentile for this time of year. This is a reflection of the long period of below normal rainfall received.
Outlook
July:
Northland received around 30-60 mm of rain with a rainfall event at the beginning of the month, 5 July. The forecast for the remainder of July is for similar weather to that experienced in June. That is, lots of days with rain, but not a high likelihood of any significant weather events.
July – September:
NIWA predict the weak central pacific El Niño conditions to continue for this three-month period, but are likely to weaken later in the year and become less influential on climate conditions. Rainfall for July to September is predicted to be equally likely to be below normal and near normal, while soil moistures and river flows are quite likely to be below normal for this period (40% chance). Air temperatures are likely to be near average or above average for this three-month period. NIWA do predict some unsettled weather over this three-month period, and particularly for September.
NIWA Temperature, Rainfall, Soil Moisture and River Flows probabilities for July to September 2019
| Temperature | Rainfall | Soil moisture | River flows | |
| Above average | 35• | 25 | 30 | 30 |
| Near average | 40• | 40• | 30 | 30 |
| Below average | 25 | 35• | 40• | 40• |
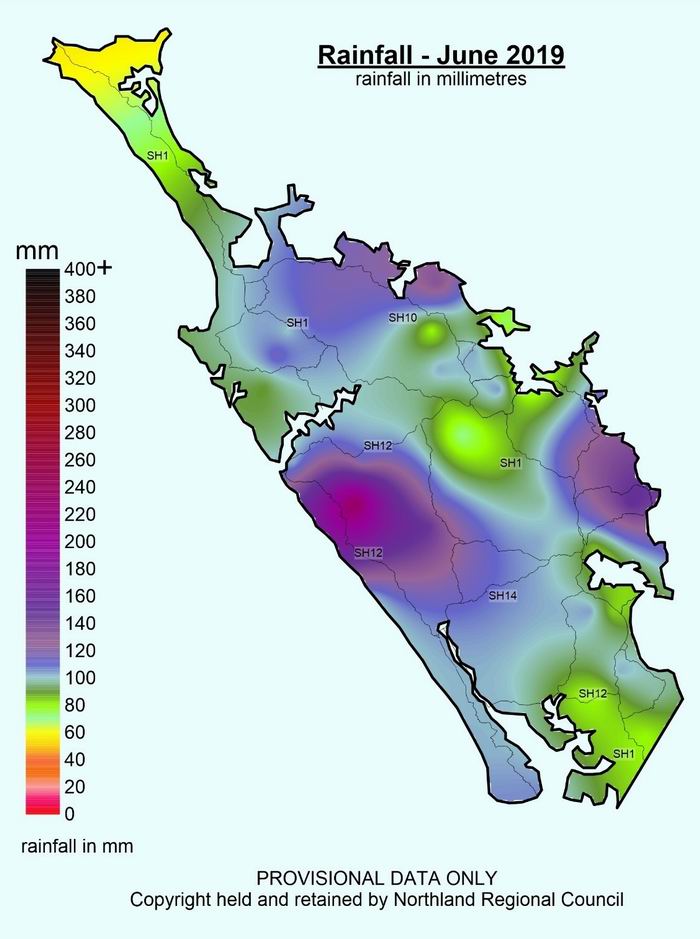
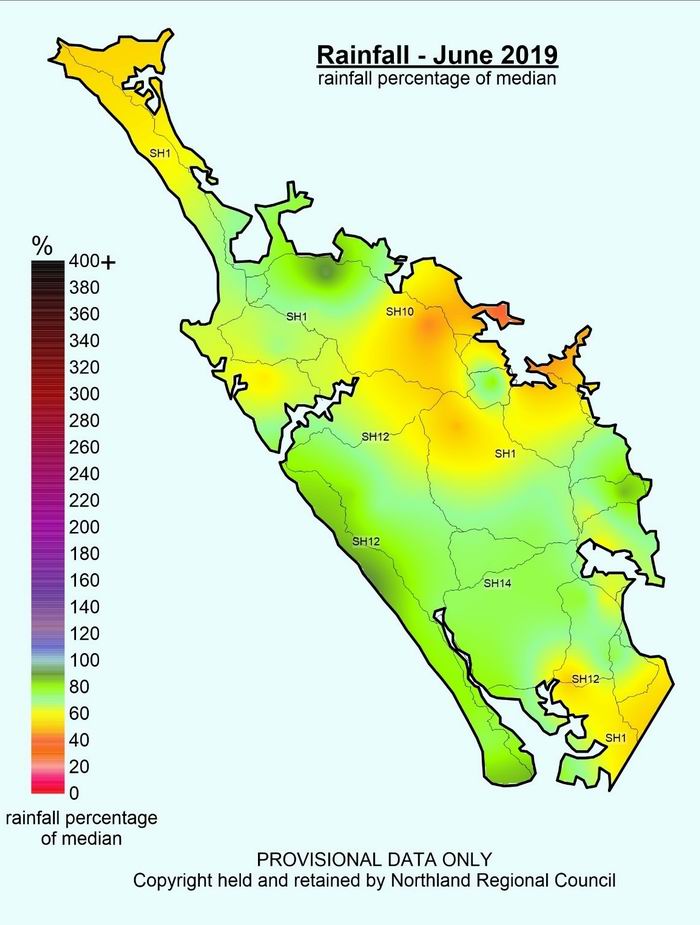
Rainfall
Similar to many of the previous months of this year so far, June 2019 was much drier than expected based on long term rainfall records, with the region only receiving around 66% of the expected rainfall for the month. I would be easy to believe that this was quite a wet month due to the high number of days with some rain and the generally showery, overcast conditions, but this is not really the case. June is typically a wet month, with unstable weather patterns and as such, rainfall totals would normally be higher than those recorded. Regionally, June rainfall was in the order of 160mm with areas like Kai Iwi Lakes and Cape Reinga getting a little over 100mm, to the upper Waimamaku Valley getting close to 250mm. The lowest gauge totals this June were 57mm at Cape Reinga and 67mm at Opua, while the highest rainfall total for the month was recorded at the Waimamaku recorder, with 239.5mm.
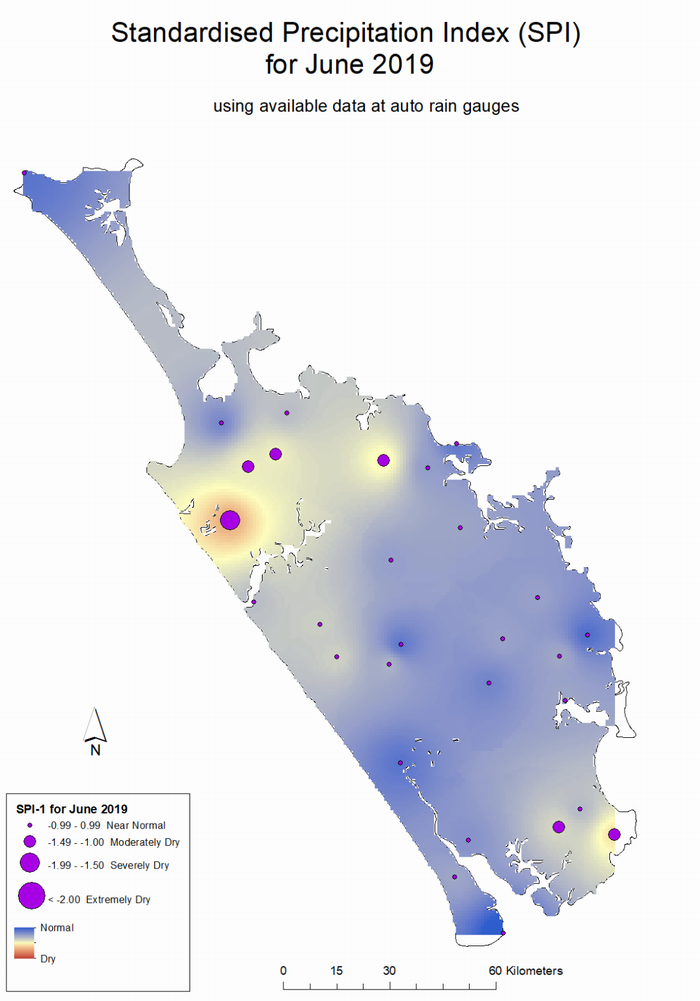
The NRC SPI Index rates the parts of the Awanui catchment, Kaeo and Brynderwyn as “moderately dry” and Rotokakahi as “severely dry”, while the rest of the region is categorised as “near normal”. For the long period of observed dry weather (12 months, from July 2018 to June 2019), the NRC SPI index rates the Awanui catchment, the Kerikeri catchment, the Parataiko/Tutamoe Ranges, upper Wairua catchment and parts of Bream Bay as “extremely dry”. All other areas are rated “moderately dry” to “severely dry”. Kaitaia, Kerikeri and Whangārei all have large rainfall deficits for the previous 12 months of -44%, -43% and -28/-39% (Whangārei/Raumanga), respectively. For Kaitaia we would expect around 1370 mm, while only 770 mm has been recorded, for Kerikeri we would expect around 1705 mm, while only 980 mm has been recorded and for Raumanga we would expect 1653, while only 1000 mm has been recorded. These are significant rainfall deficits.
There have been some record low rainfall totals recorded at NRC gauges over the six months January to June 2019 and over the year July 2018 to June 2019. Rain gauges in the Opouteke, Ngunguru and Waihoihoi catchments have received the lowest first half of the year totals since records began at these stations in the 1980’s. Also, gauges in the Whakapara and Hatea catchments received the fifth and second lowest first half of the year totals since records began in 1905 and 1948, respectively. Furthermore, the rain gauge in the Opouteke catchment received 384 mm during this period, while the next lowest rainfall total for the same period was recorded in 2005 with a total of 590 mm, nearly 40% higher than this recent period. For the 12-month period, July 2018 to June 2019, gauges in the Opouteke, Hatea and Okarika catchments received the lowest rainfall totals for these months since records began in 1987, 1947 and 1977, respectively.
Rainfall totals for January 2019 to June 2019 and July 2018 to June 2019 in comparison to historical record for the same month periods
| Station | 6-Month rainfall ranking | 12-Month rainfall ranking |
| Opouteke at Brookvale | Lowest since 1980s | |
| Ngunguru at Dugmores Rock | Lowest since 1980s | |
| Waihoihoi at Brynderwyn | Lowest since 1980s | |
| Whakapara at Puhipuhi | Fifth lowest since 1905 | |
| Hatea at Whareora Rd | Second lowest since 1948 | Lowest since 1948 |
| Okarika at Rowland Rd | Lowest since 1977 |
Rainfall mm, % median and SPI Index maps for June 2019
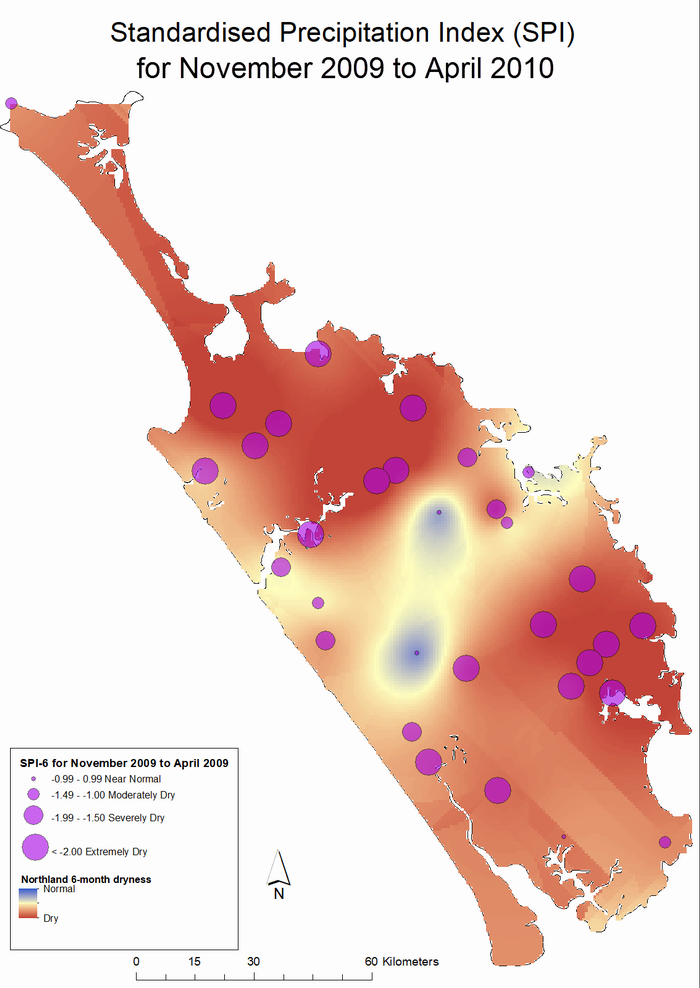
SPI Index map for the dry period, July 2018 to June 2019 and a comparison to the 2009/2010 Northland Drought
River flow
Flow map June 2019
Count of days below 7 Day MALF and 1:5 year low flows at river recorders during the previous year
|
DAYS BELOW 7 DAY MALF |
||||||||||||
|
Site |
Jul-18 |
Aug-18 |
Sep-18 |
Oct-18 |
Nov-18 |
Dec-18 |
Jan-19 |
Feb-19 |
Mar-19 |
Apr-19 |
May-19 |
Jun-19 |
|
Awanui at School Cut |
0 |
0 |
0 |
0 |
0 |
0 |
0 |
13 |
21 |
17 |
15 |
1 |
|
Oruru at Saleyards |
0 |
0 |
0 |
0 |
0 |
0 |
0 |
0 |
15 |
22 |
29 |
11 |
|
Punakitere at Taheke |
0 |
0 |
0 |
0 |
0 |
0 |
4 |
16 |
31 |
21 |
25 |
1 |
|
Waipapa at Forest Ranger |
0 |
0 |
0 |
0 |
0 |
0 |
23 |
24 |
29 |
21 |
28 |
3 |
|
Maungaparerua at Tyrees Ford |
0 |
0 |
0 |
0 |
0 |
0 |
17 |
23 |
31 |
7 |
10 |
0 |
|
Rangitane at Stirling |
0 |
0 |
0 |
0 |
0 |
0 |
25 |
23 |
31 |
17 |
26 |
1 |
|
Waitangi at Wakelins |
0 |
0 |
0 |
0 |
0 |
0 |
20 |
20 |
31 |
12 |
20 |
0 |
|
Opouteke at Suspension Br |
0 |
0 |
0 |
0 |
0 |
0 |
0 |
12 |
19 |
4 |
3 |
0 |
|
Kaihu at Gorge |
0 |
0 |
0 |
0 |
0 |
0 |
0 |
13 |
22 |
6 |
3 |
0 |
|
Mangahahuru at County Weir |
0 |
0 |
0 |
0 |
0 |
0 |
0 |
5 |
27 |
17 |
30 |
15 |
|
Mangakahia at Gorge |
0 |
0 |
0 |
0 |
0 |
0 |
0 |
0 |
19 |
5 |
4 |
0 |
|
Mangakahia at Titoki Br |
0 |
0 |
0 |
0 |
0 |
0 |
0 |
8 |
22 |
6 |
8 |
0 |
|
Manganui at Permanent Station |
0 |
0 |
0 |
0 |
0 |
0 |
0 |
7 |
13 |
2 |
0 |
0 |
|
Hikurangi at Moengawahine |
0 |
0 |
0 |
0 |
0 |
0 |
0 |
15 |
30 |
13 |
20 |
0 |
|
Wairua at Purua |
0 |
0 |
0 |
0 |
0 |
3 |
25 |
26 |
31 |
23 |
31 |
11 |
|
Waiotu at SH1 Br |
0 |
0 |
0 |
0 |
0 |
0 |
0 |
0 |
17 |
24 |
29 |
11 |
|
Ngunguru at Dugmores Rock |
0 |
0 |
0 |
0 |
0 |
0 |
0 |
6 |
20 |
22 |
26 |
11 |
|
Waipao at Draffins Rd |
0 |
0 |
0 |
0 |
0 |
0 |
6 |
21 |
31 |
30 |
31 |
23 |
|
Mangere at Knights Rd |
0 |
0 |
0 |
0 |
0 |
0 |
4 |
12 |
11 |
0 |
8 |
0 |
|
Hatea at Whareora Rd |
0 |
4 |
0 |
0 |
0 |
0 |
0 |
0 |
14 |
0 |
2 |
0 |
|
Raumanga at Bernard St |
0 |
0 |
0 |
0 |
0 |
0 |
0 |
12 |
27 |
20 |
26 |
3 |
|
Waiarohia at Lovers Lane |
0 |
0 |
0 |
0 |
3 |
0 |
9 |
20 |
28 |
18 |
25 |
3 |
|
Waihoihoi at St Marys Rd |
0 |
0 |
0 |
0 |
0 |
0 |
3 |
0 |
0 |
0 |
0 |
0 |
|
North at Applecross Rd |
0 |
0 |
0 |
0 |
0 |
0 |
0 |
0 |
6 |
13 |
21 |
1 |
|
Ahuroa at Braigh Flats |
0 |
0 |
0 |
0 |
0 |
0 |
0 |
3 |
14 |
0 |
5 |
0 |
|
DAYS BELOW 1:5 YEAR LOW FLOWS |
||||||||||||
|
Site |
Jul-18 |
Aug-18 |
Sep-18 |
Oct-18 |
Nov-18 |
Dec-18 |
Jan-19 |
Feb-19 |
Mar-19 |
Apr-19 |
May-19 |
Jun-19 |
|
Awanui at School Cut |
0 |
0 |
0 |
0 |
0 |
0 |
0 |
4 |
12 |
0 |
7 |
0 |
|
Oruru at Saleyards |
0 |
0 |
0 |
0 |
0 |
0 |
0 |
0 |
0 |
4 |
27 |
0 |
|
Punakitere at Taheke |
0 |
0 |
0 |
0 |
0 |
0 |
0 |
0 |
13 |
0 |
0 |
0 |
|
Waipapa at Forest Ranger |
0 |
0 |
0 |
0 |
0 |
0 |
2 |
13 |
27 |
15 |
23 |
0 |
|
Maungaparerua at Tyrees Ford |
0 |
0 |
0 |
0 |
0 |
0 |
2 |
13 |
29 |
0 |
0 |
0 |
|
Rangitane at Stirling |
0 |
0 |
0 |
0 |
0 |
0 |
0 |
0 |
8 |
0 |
0 |
0 |
|
Waitangi at Wakelins |
0 |
0 |
0 |
0 |
0 |
0 |
0 |
0 |
6 |
0 |
0 |
0 |
|
Opouteke at Suspension Br |
0 |
0 |
0 |
0 |
0 |
0 |
0 |
0 |
0 |
0 |
0 |
0 |
|
Kaihu at Gorge |
0 |
0 |
0 |
0 |
0 |
0 |
0 |
0 |
0 |
0 |
0 |
0 |
|
Mangahahuru at County Weir |
0 |
0 |
0 |
0 |
0 |
0 |
0 |
0 |
0 |
0 |
0 |
0 |
|
Mangakahia at Gorge |
0 |
0 |
0 |
0 |
0 |
0 |
0 |
0 |
5 |
0 |
0 |
0 |
|
Mangakahia at Titoki Br |
0 |
0 |
0 |
0 |
0 |
0 |
0 |
0 |
3 |
0 |
0 |
0 |
|
Manganui at Permanent Station |
0 |
0 |
0 |
0 |
0 |
0 |
0 |
0 |
0 |
0 |
0 |
0 |
|
Hikurangi at Moengawahine |
0 |
0 |
0 |
0 |
0 |
0 |
0 |
0 |
16 |
0 |
0 |
0 |
|
Wairua at Purua |
0 |
0 |
0 |
0 |
0 |
0 |
0 |
12 |
31 |
13 |
26 |
0 |
|
Wairua at Wairua Br |
0 |
0 |
0 |
4 |
2 |
4 |
11 |
9 |
20 |
2 |
15 |
2 |
|
Whakapara at Cableway |
0 |
0 |
0 |
0 |
0 |
0 |
0 |
0 |
15 |
0 |
17 |
0 |
|
Waiotu at SH1 Br |
0 |
0 |
0 |
0 |
0 |
0 |
0 |
0 |
17 |
11 |
20 |
0 |
|
Ngunguru at Dugmores Rock |
0 |
0 |
0 |
0 |
0 |
0 |
0 |
0 |
0 |
0 |
0 |
0 |
|
Waipao at Draffins Rd |
0 |
0 |
0 |
0 |
0 |
0 |
0 |
0 |
0 |
0 |
0 |
0 |
|
Mangere at Knights Rd |
0 |
0 |
0 |
0 |
0 |
0 |
4 |
6 |
5 |
0 |
2 |
0 |
|
Raumanga at Bernard St |
0 |
0 |
0 |
0 |
0 |
0 |
0 |
5 |
10 |
0 |
0 |
0 |
|
Waiarohia at Lovers Lane |
0 |
0 |
0 |
0 |
0 |
0 |
0 |
0 |
0 |
0 |
0 |
0 |
|
Waihoihoi at St Marys Rd |
0 |
0 |
0 |
0 |
0 |
0 |
0 |
0 |
0 |
0 |
0 |
0 |
|
North at Applecross Rd |
0 |
0 |
0 |
0 |
0 |
0 |
0 |
0 |
3 |
0 |
0 |
0 |
|
Ahuroa at Braigh Flats |
0 |
0 |
0 |
0 |
0 |
0 |
0 |
0 |
0 |
0 |
0 |
0 |
Worst Case Scenario Predicted River Flows for Northland from 11 July 2019 estimated from recession curves (assuming no rainfall):
|
Water Level Recorder |
Days to reach Mean Annual Low Flow (MALF) |
Days to reach 1 in 5 year low flow |
|
Awanui at School Cut |
25 |
45 |
|
Kaihu at Gorge |
25 |
35 |
|
Maungaparerua at Tyrees Ford |
30 |
45 |
|
Ngunguru at Dugmores Rock |
35 |
50 |
Groundwater
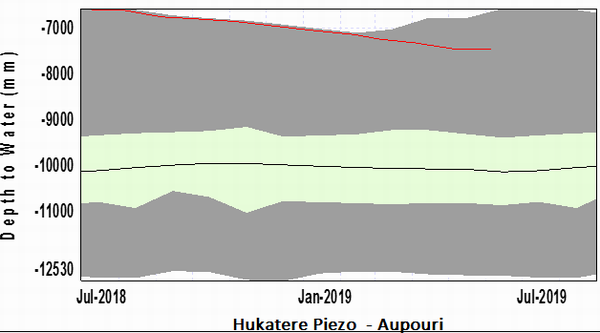
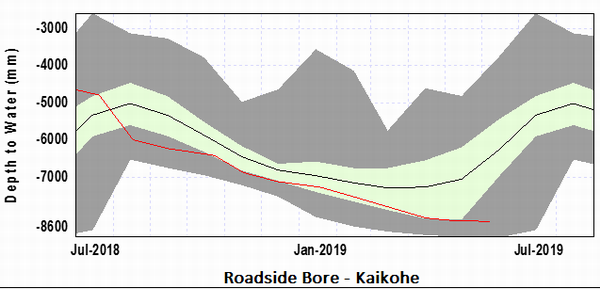
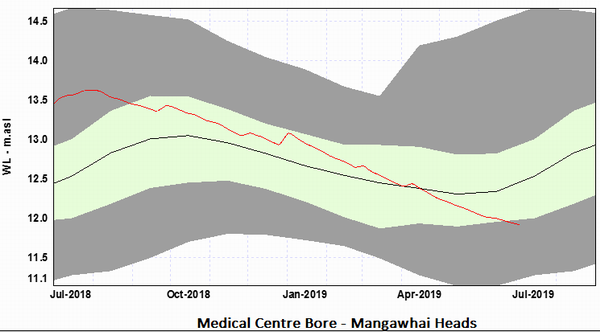
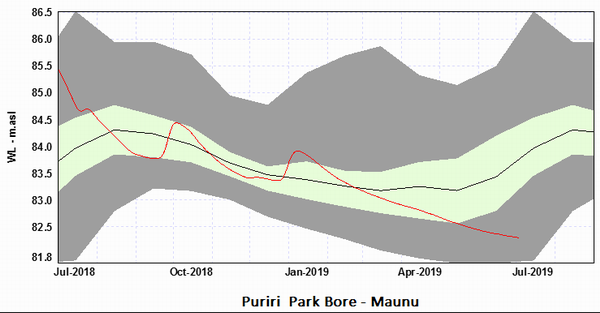
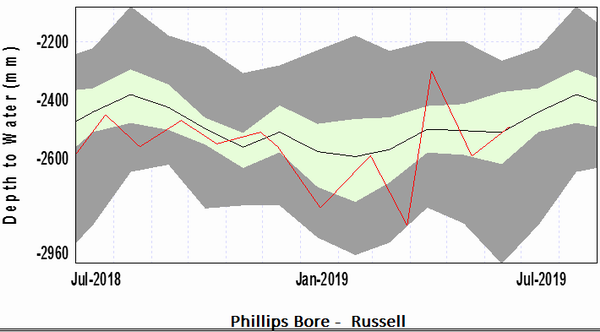
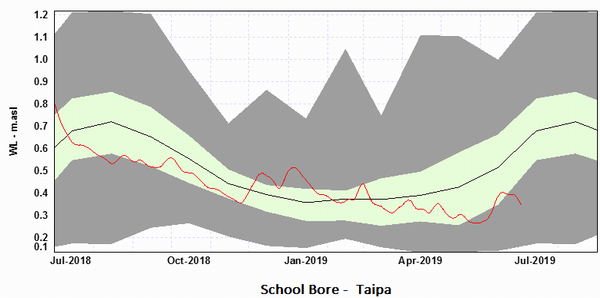
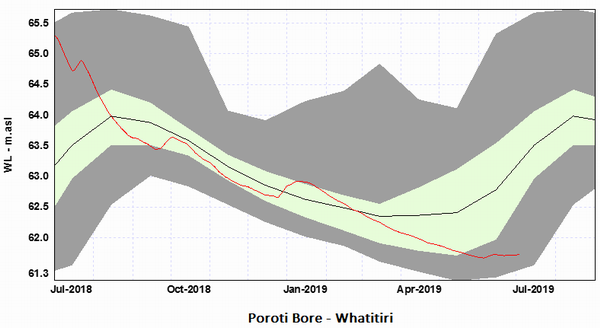
Water level readings indicate that the Taipa, Kaikohe, Whangārei, Marsden-Ruakaka, Mangawhai and Poroti aquifers were below average for June 2019. The groundwater systems at Russell and Aupouri appear OK. The “One-year groundwater trend” plots below show that most groundwater systems are below long-term averages for this time of year, and where the red line is within or approaching the bottom grey bar, the systems are at or below 20th percentile levels.
Northland aquifer status
|
Groundwater Systems |
Status for June 2019 |
|
Aupouri |
OK |
|
Taipa |
BELOW AVERAGE |
|
Russell |
OK |
|
Kaikohe |
BELOW AVERAGE |
|
Whangarei |
BELOW AVERAGE |
|
Marsden-Ruakaka |
BELOW AVERAGE |
|
Mangawhai |
BELOW AVERAGE |
|
Poroti |
BELOW AVERAGE |
One-year groundwater trends (red) relative to the long-term average (black) and upper and lower percentiles (bottom grey area denotes 0-20th percentiles)
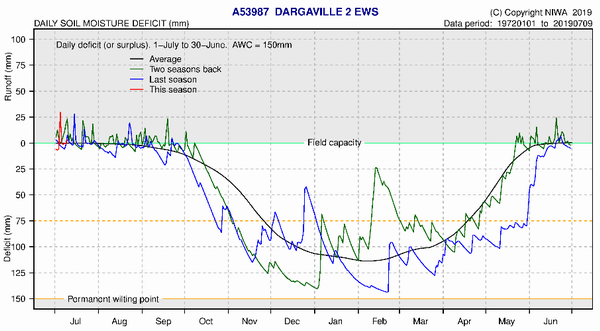
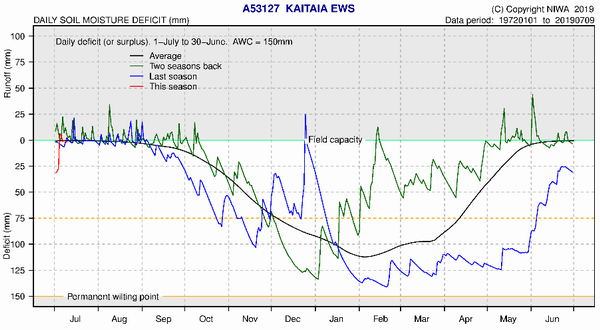
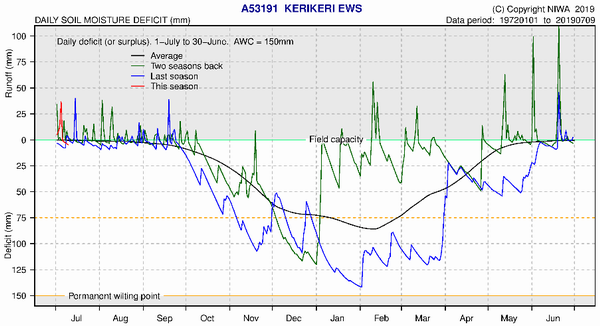
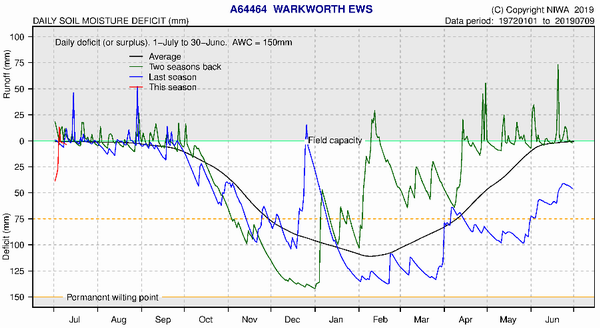
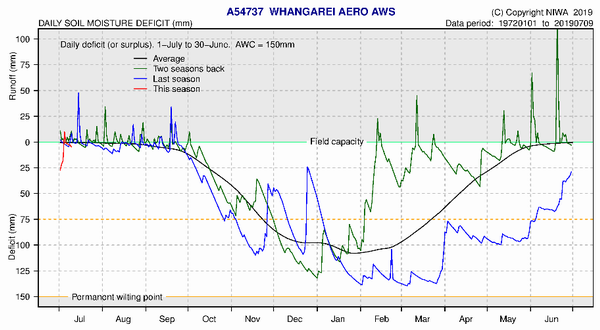
Soil moisture deficits
NIWA water balance modelling indicates soil moisture deficit is close to the average and at around field capacity. This is normal for this time of year, but it has taken longer into winter to reach this field capacity than most years, due to the dry conditions experienced over the first half of the year. “SMD is calculated based on incoming daily rainfall (mm), outgoing daily potential evapotranspiration (PET, mm), and a fixed available water capacity (the amount of water in the soil 'reservoir' that plants can use) of 150 mm” (NIWA). Note that data for Kaikohe is not available for June 2019.
Soil moisture deficit at NIWA climate stations
|
NIWA Climate Station |
Observed Soil moisture deficit (mm) as of 09/07/2019 |
Average June soil moisture deficit |
Difference between Expected and Average |
|
Kaitaia |
0 mm |
0 mm |
0 |
|
Kerikeri |
0 mm |
0 mm |
0 |
|
Kaikohe |
0 mm |
0 mm |
0 |
|
Whangārei |
0 mm |
0 mm |
0 |
|
Dargaville |
0 mm |
0 mm |
0 |
|
Warkworth |
0 mm |
0 mm |
0 |
NIWA Soil Moisture Deficit Plots