August - September climate report 2019
31 Aug 2019, 9:03 AM
Summary
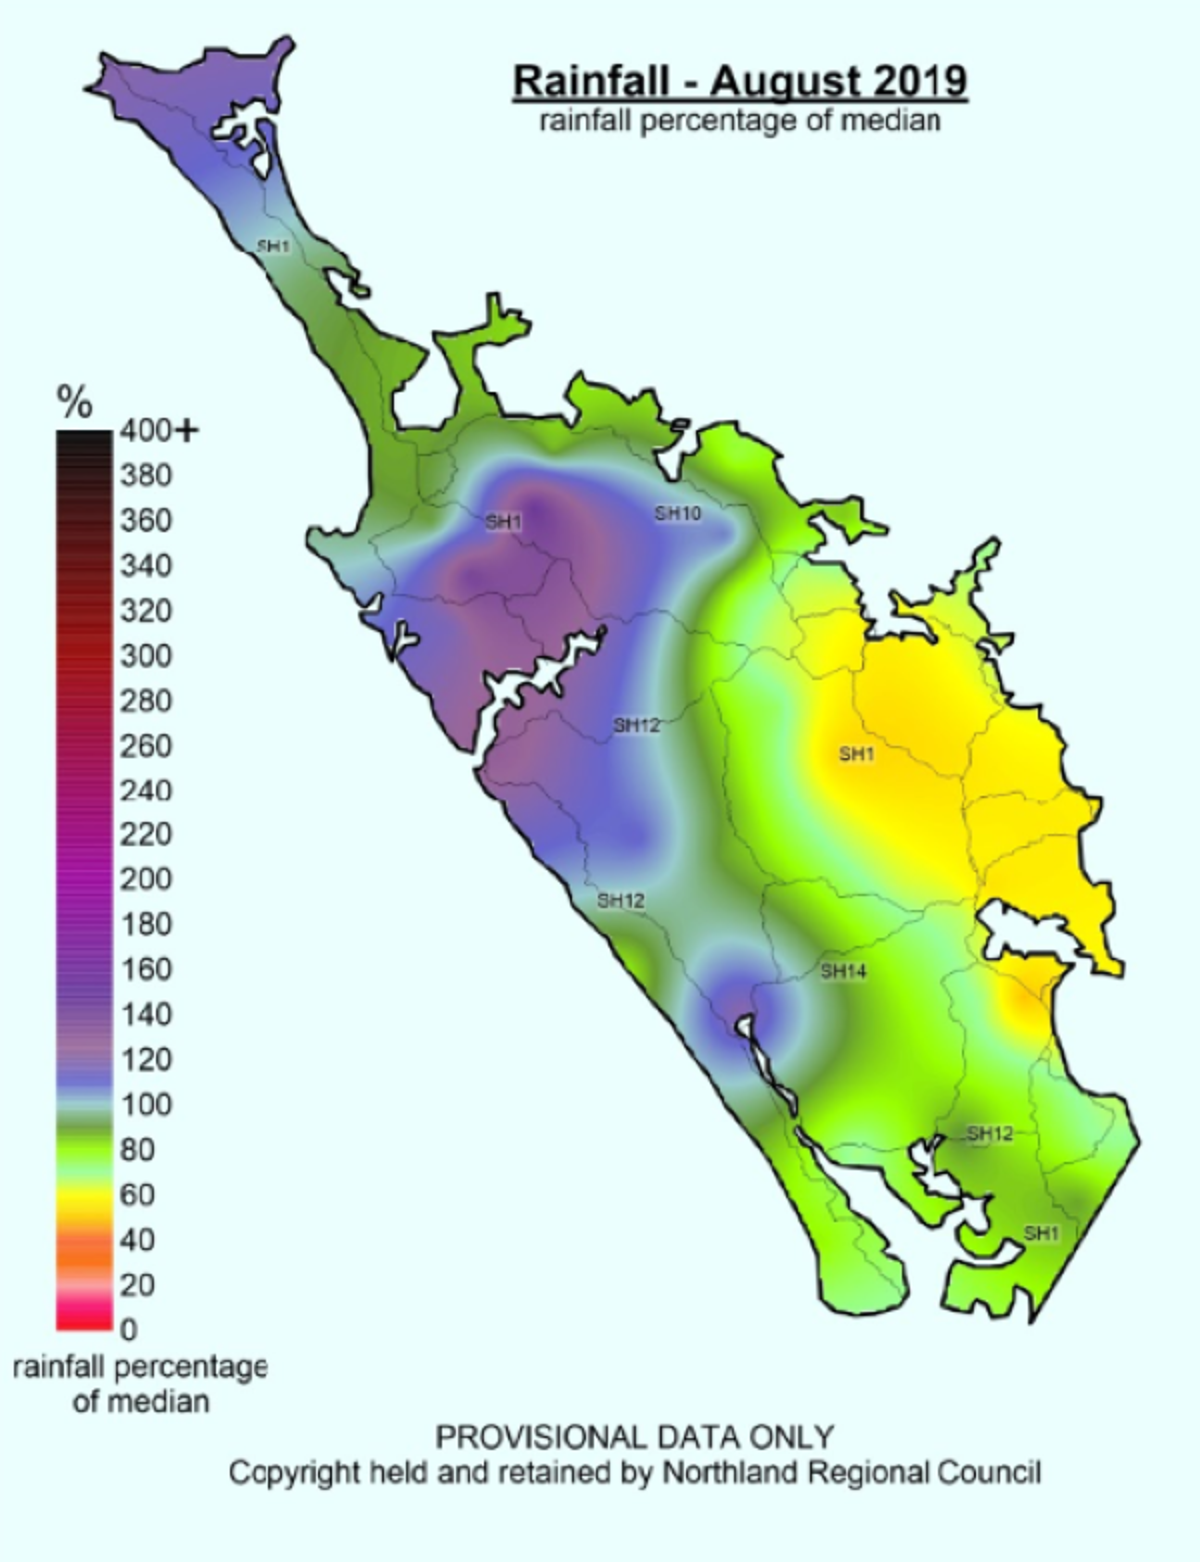
For the period June to September 2019, Northland has experienced persistent overcast and showery weather. However, there were no rainfall events of significance and monthly rainfall totals have generally been below expected for these months with the west coast receiving more than the east with the prevailing south westerly winds.
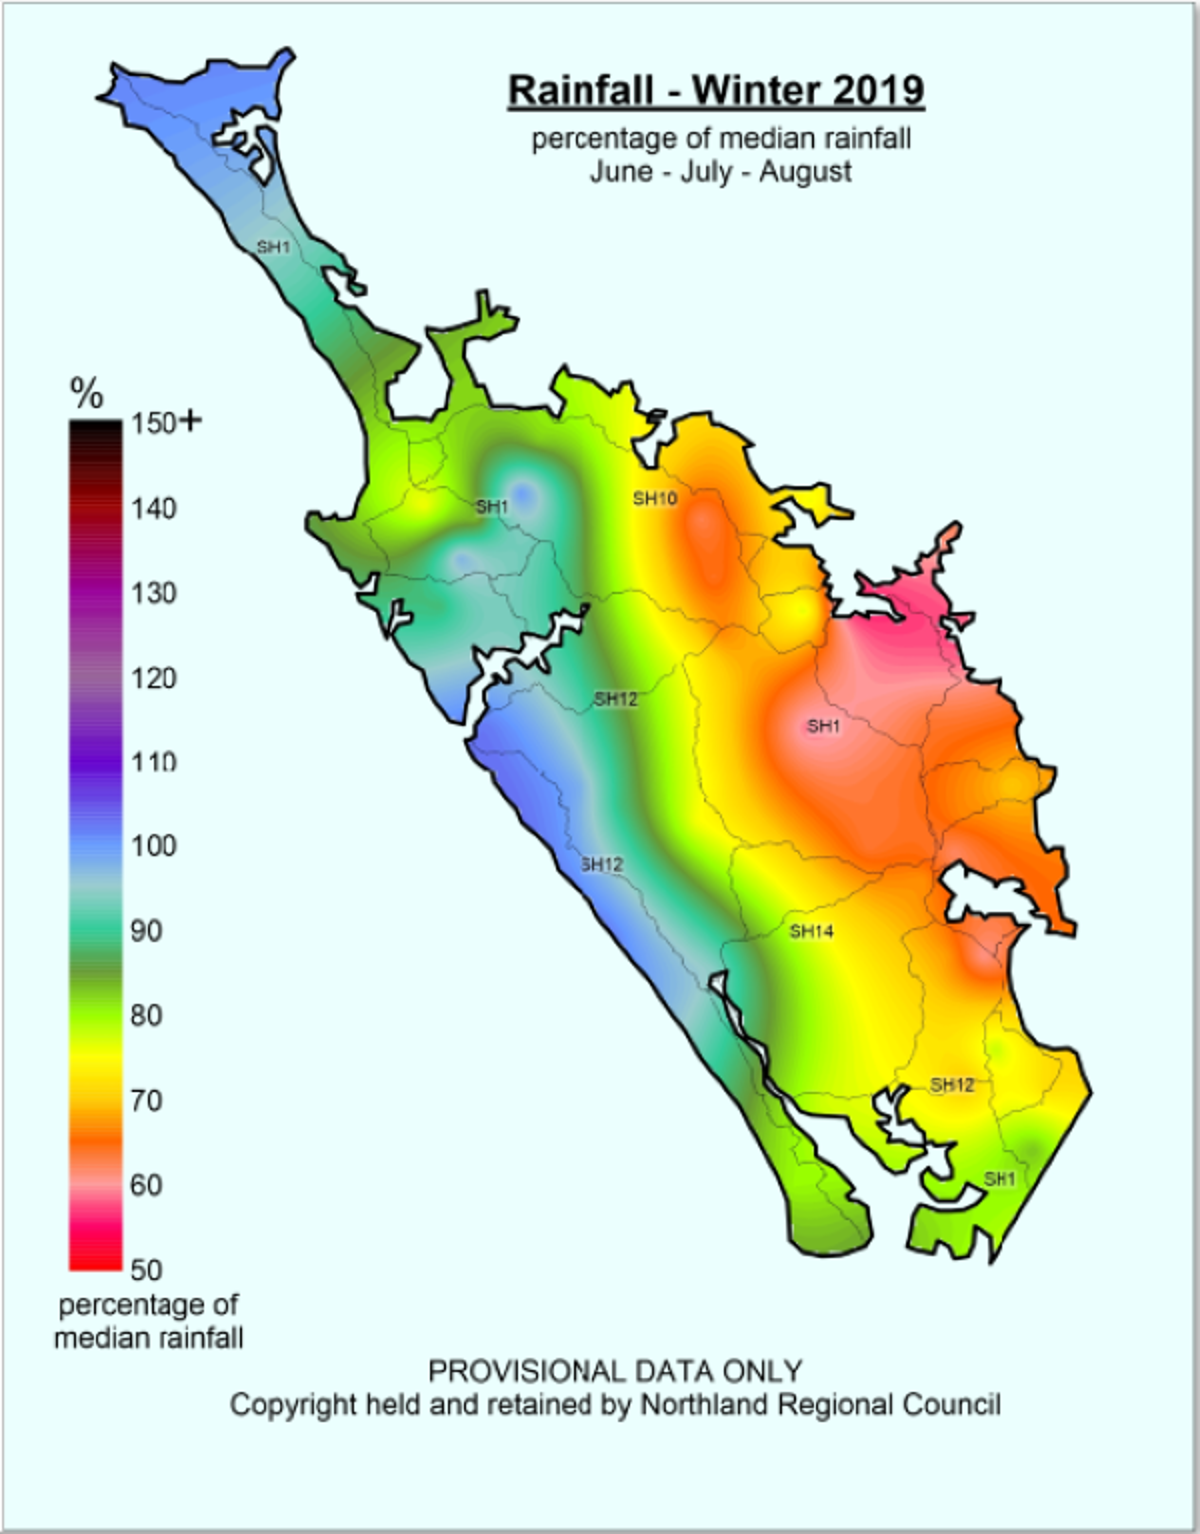
For winter 2019, the western coast between Hokianga and Dargaville received near normal winter rainfall totals, while eastern areas from Kaeo to Whangārei received between 60-80% of the rainfall expected.
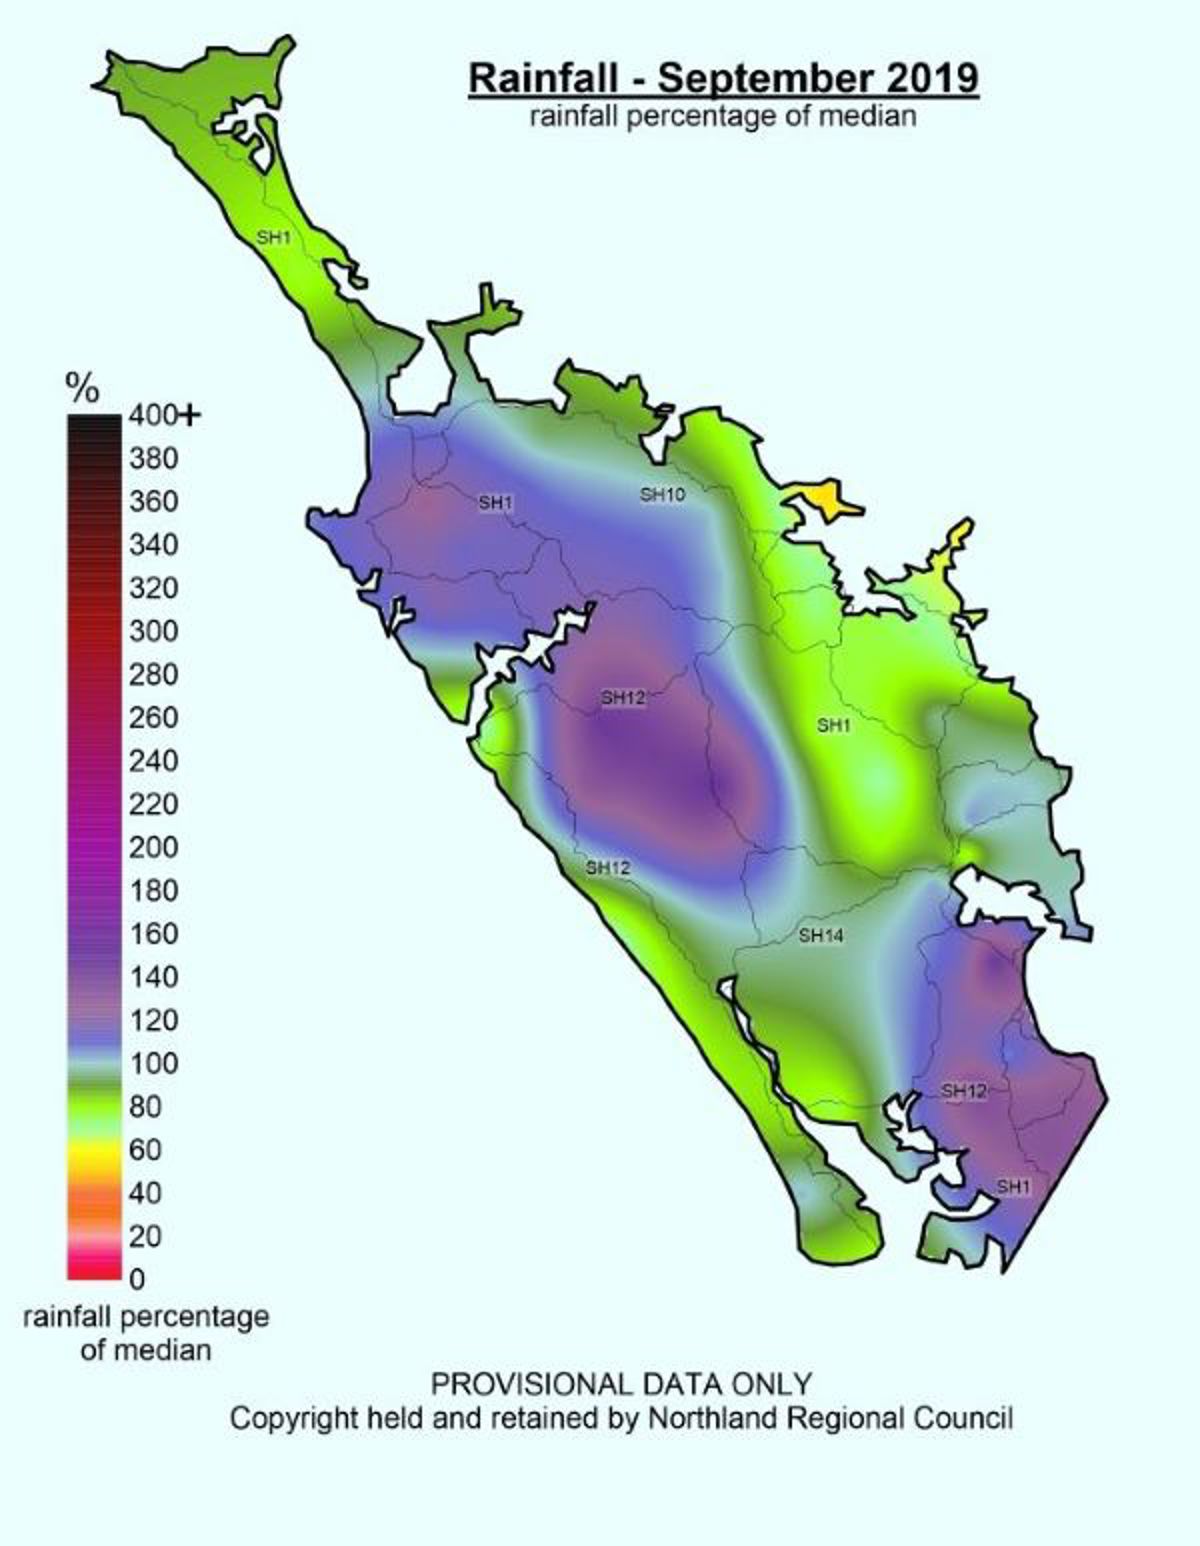
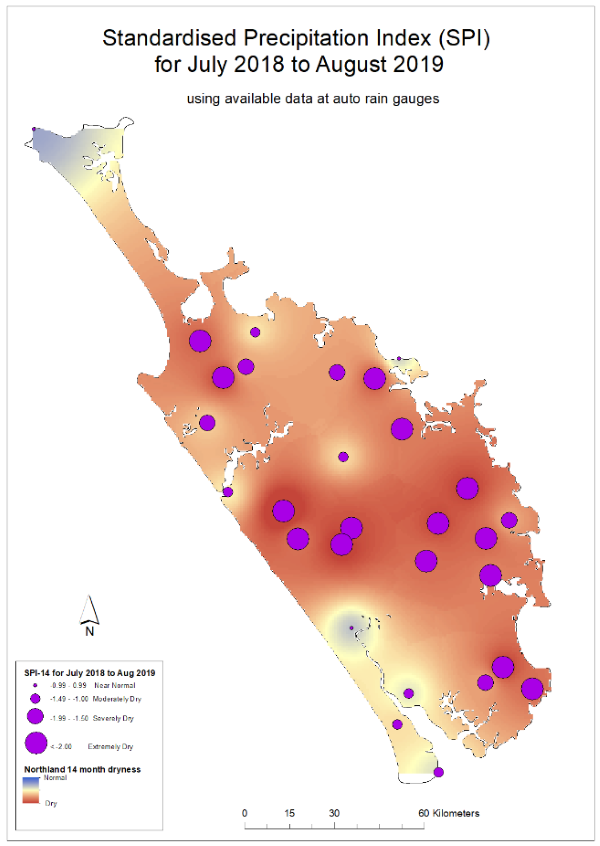
September was quite wet in certain locations including the Far North, the Mangamuka Ranges, the Parataiko Ranges and Bream Bay, largely due to the abundance thunderstorm cells occurring through the month. Areas that most needed this rain missed out though, with the Bay of Islands, the Eastern Hills, Whangārei and the Upper Wairua catchment receiving around 80% of expected rainfall. A broader long term view of the situation is well described by NRC SPI indexing and rainfall deficits. NRC SPI index for July 2018 to August 2019 rates most catchments as 'extremely dry' and large 12-month rainfall deficits remain in Kaitaia, Kerikeri and Whangārei all continue to have large rainfall deficits for the previous 12 months of -33%, -33% and -43%, respectively.
River flows and groundwater levels have shown some typical seasonal increases over the previous four months, but less so than normal as they continue to be influenced by below normal rainfall. Rivers in the Bay of Islands area, upper Wairua catchment and Whangārei i area are recording flows of between 40-80% of flows typical for this time of year. Groundwater is below normal at Whangārei, Marsden-Ruakaka, Mangawhai and Poroti aquifers.
With a large rainfall deficit, low river flows in some areas and less than normal recharge to Northlands groundwater systems, Northland Regional Council will be paying close attention to conditions leading into summer.
Outlook
September:
MetService forecast October to be less stormy than September, with less influence from Southern Ocean lows. Northland is forecast to receive near normal or below normal rainfall for the month.
October – December:
The weak central pacific El Niño conditions that have persisted since March have given way to ENSO neutral conditions. NIWA predict these ENSO neutral conditions to persist through Spring. From October to December air pressure is forecast to the lower than normal for the country, but overall, rainfall is predicted to be near average for the next quarter to December. Below normal rivers flows and soil moisture are predicted for this period..
NIWA Temperature, Rainfall, Soil Moisture and River Flows probabilities for October to December 2019
| Temperature | Rainfall | Soil moisture | River flows | |
| Above average | 20 | 25 | 25 | 25 |
| Near average | 50• | 40• | 35 | 35 |
| Below average | 30 | 35 | 40• | 40• |
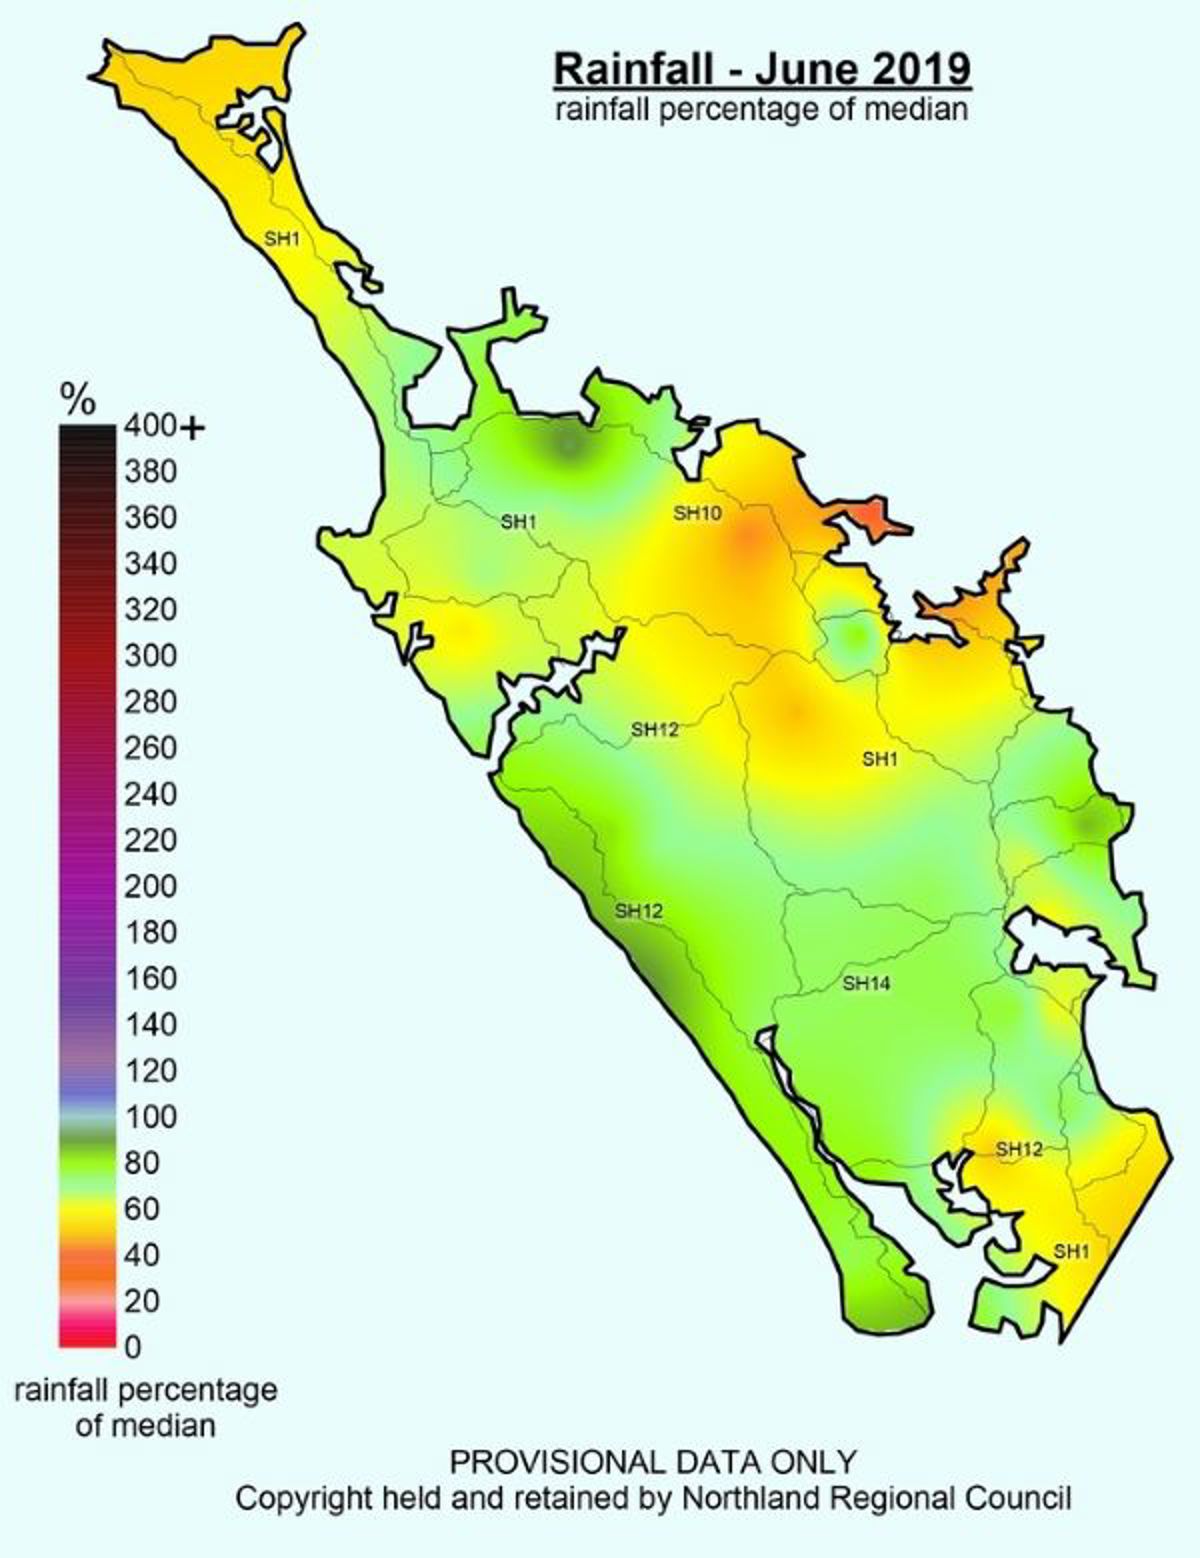
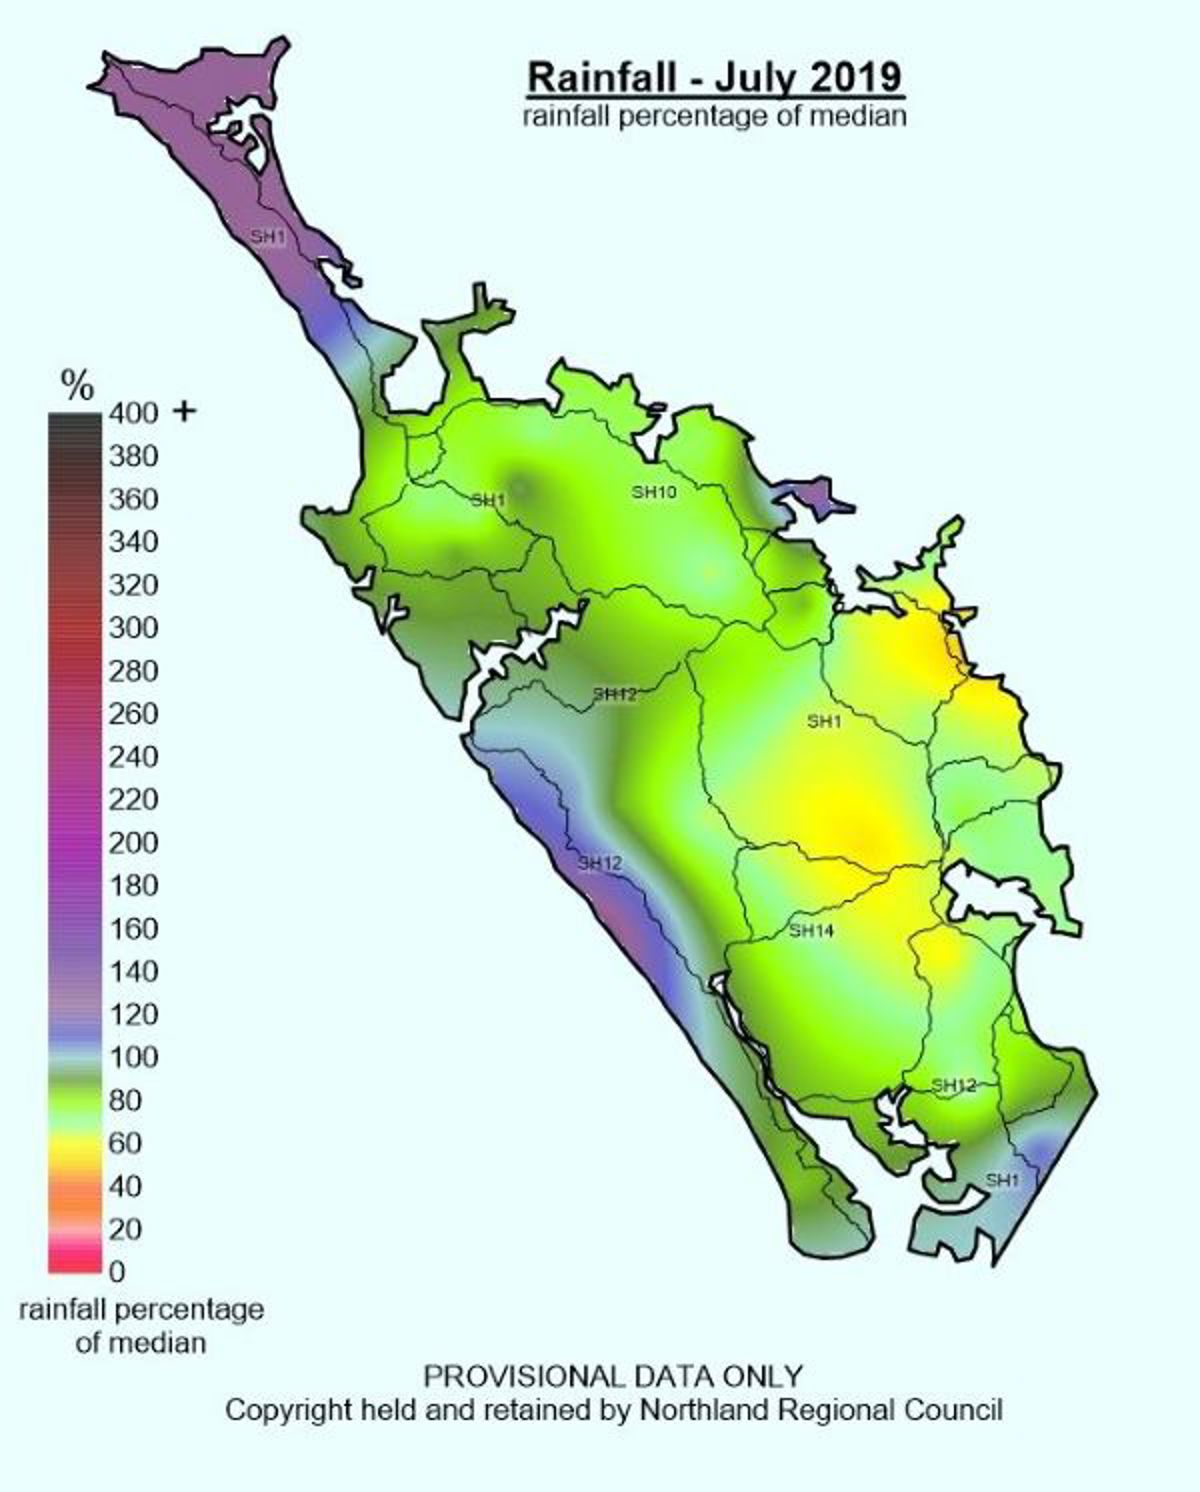
Rainfall
June to September 2019 rainfall has been influenced by stormy Southern Ocean conditions and low pressure systems regularly spiraling up from the Southern Ocean. For most of the country this has led to quite wet conditions, but for Northland, this is not really true. Northland has experienced a lot of days with rain, but generally the rainfall totals have not been high, with the west coast generally receiving more than the east with the south westerly winds. The winter rainfall percentage map displays this nicely, with the western coast between Hokianga and Dargaville receiving near normal Winter rainfall totals, while eastern areas from Kaeo to Whangārei receiving between 60-80% of the rainfall expected.
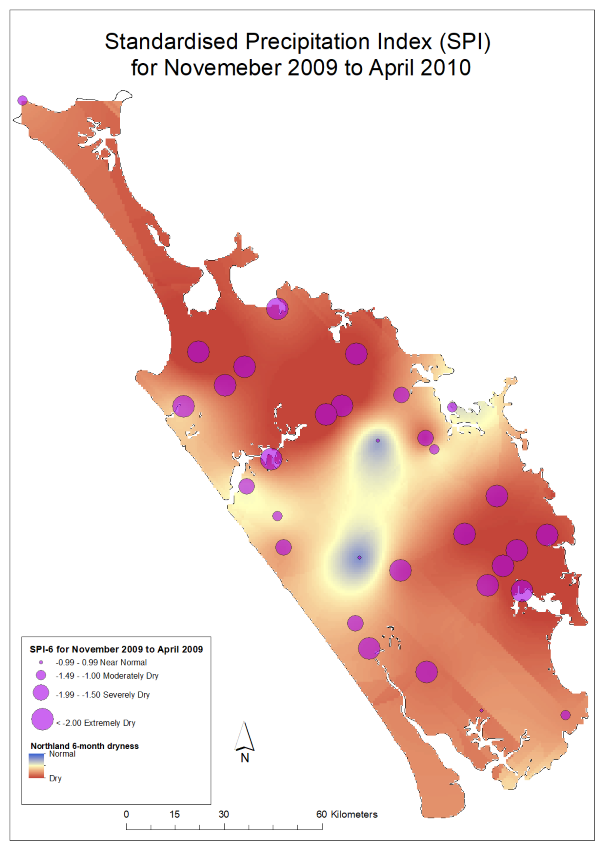
For the long period of observed dry weather (14 months, from July 2018 to August 2019), the NRC SPI index rates many catchments as 'extremely dry', including the Awanui catchment, the Kerikeri catchment, the Parataiko/Tutamoe Ranges, upper Wairua catchment and parts of Bream Bay. All other areas are rated 'moderately dry' to 'severely dry'. Kaitaia, Kerikeri and Whangārei all continue to have large rainfall deficits for the previous 12 months of -33%, -33% and -43%, respectively. For Kaitaia, we would expect around 1370 mm, while only 925 mm has been recorded, for Kerikeri we would expect around 1705 mm, while only 1139 mm has been recorded and for Raumanga we would expect 1653, while only 956 mm has been recorded. These are significant rainfall deficits.
Rainfall mm, % median and SPI Index maps for June - September 2019
(Use the arrow (>) to navigate through the rainfall maps).


SPI Index map for the dry period, July 2018 to August 2019 and a comparison to the 2009/2010 Northland Drought
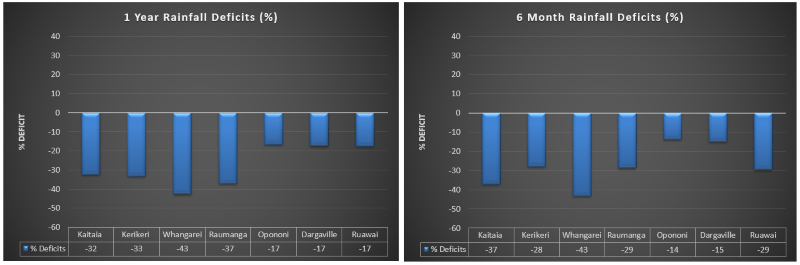
One year and six-month rainfall deficit percentage values
River flow
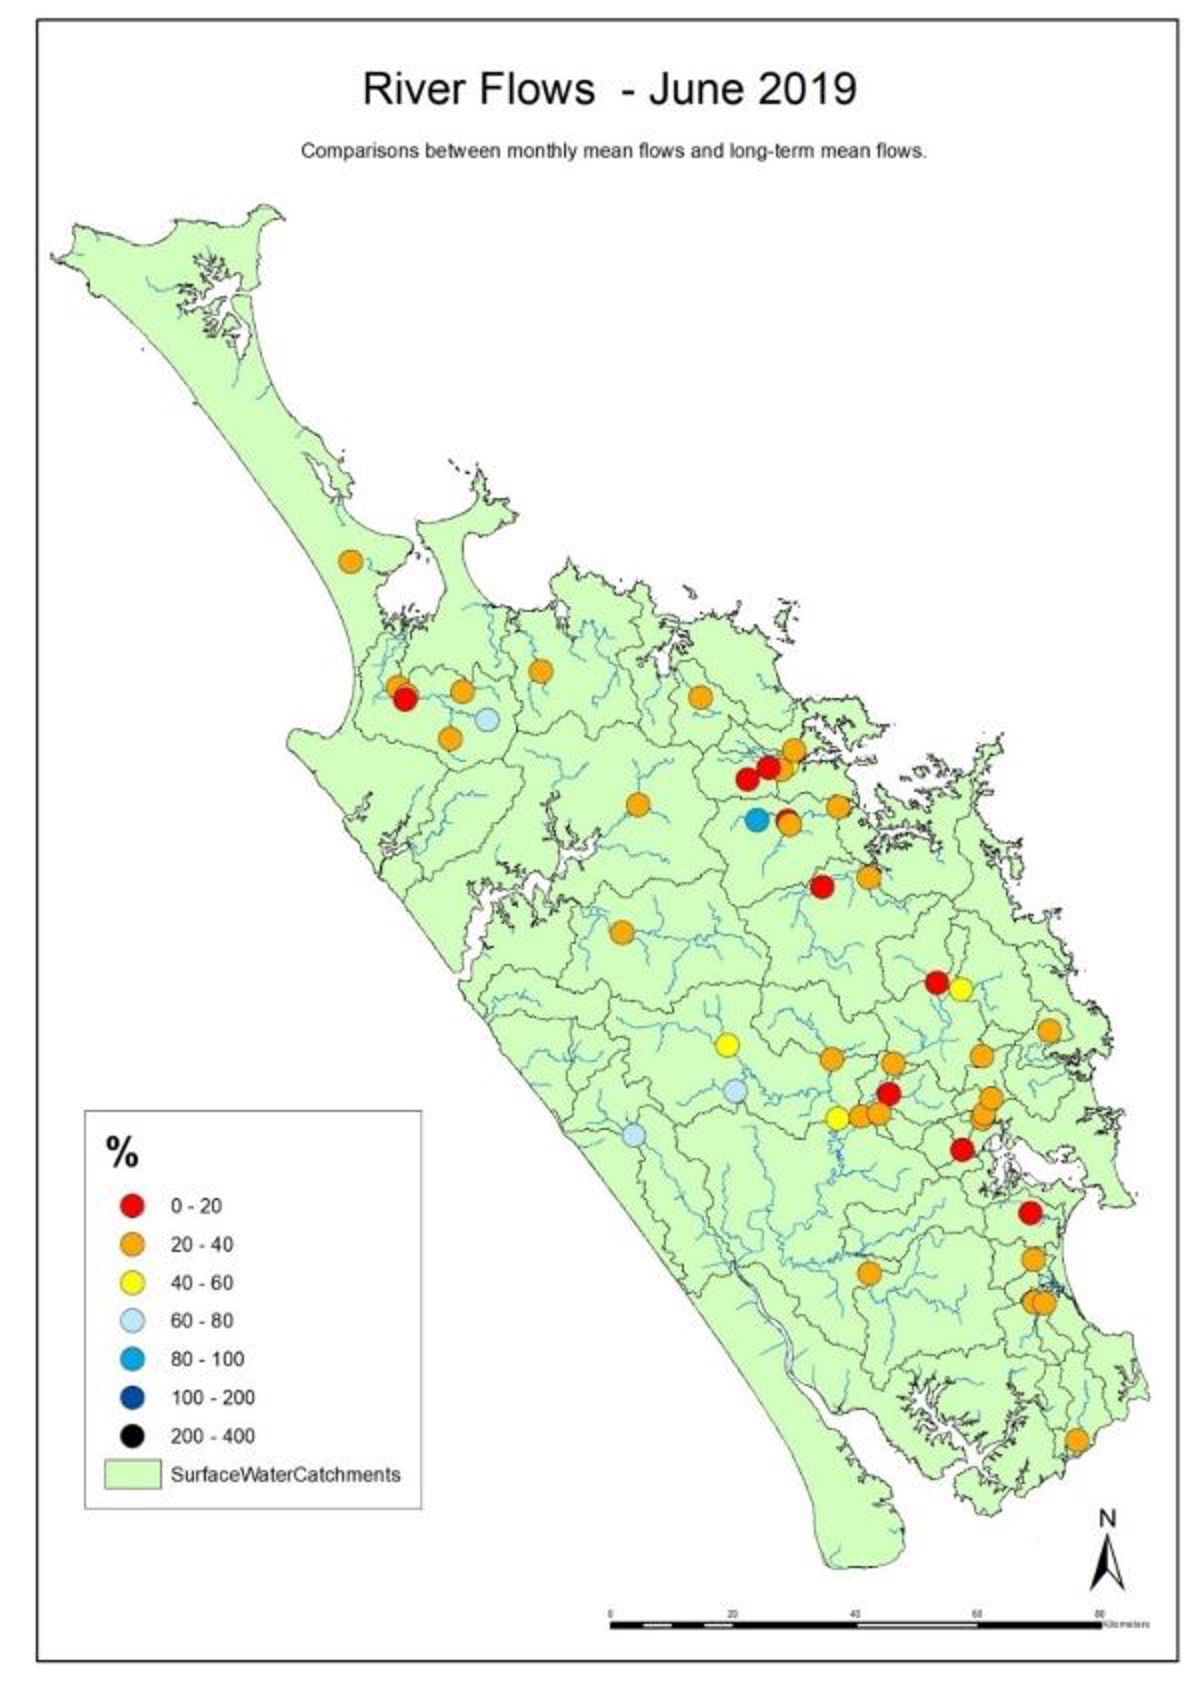
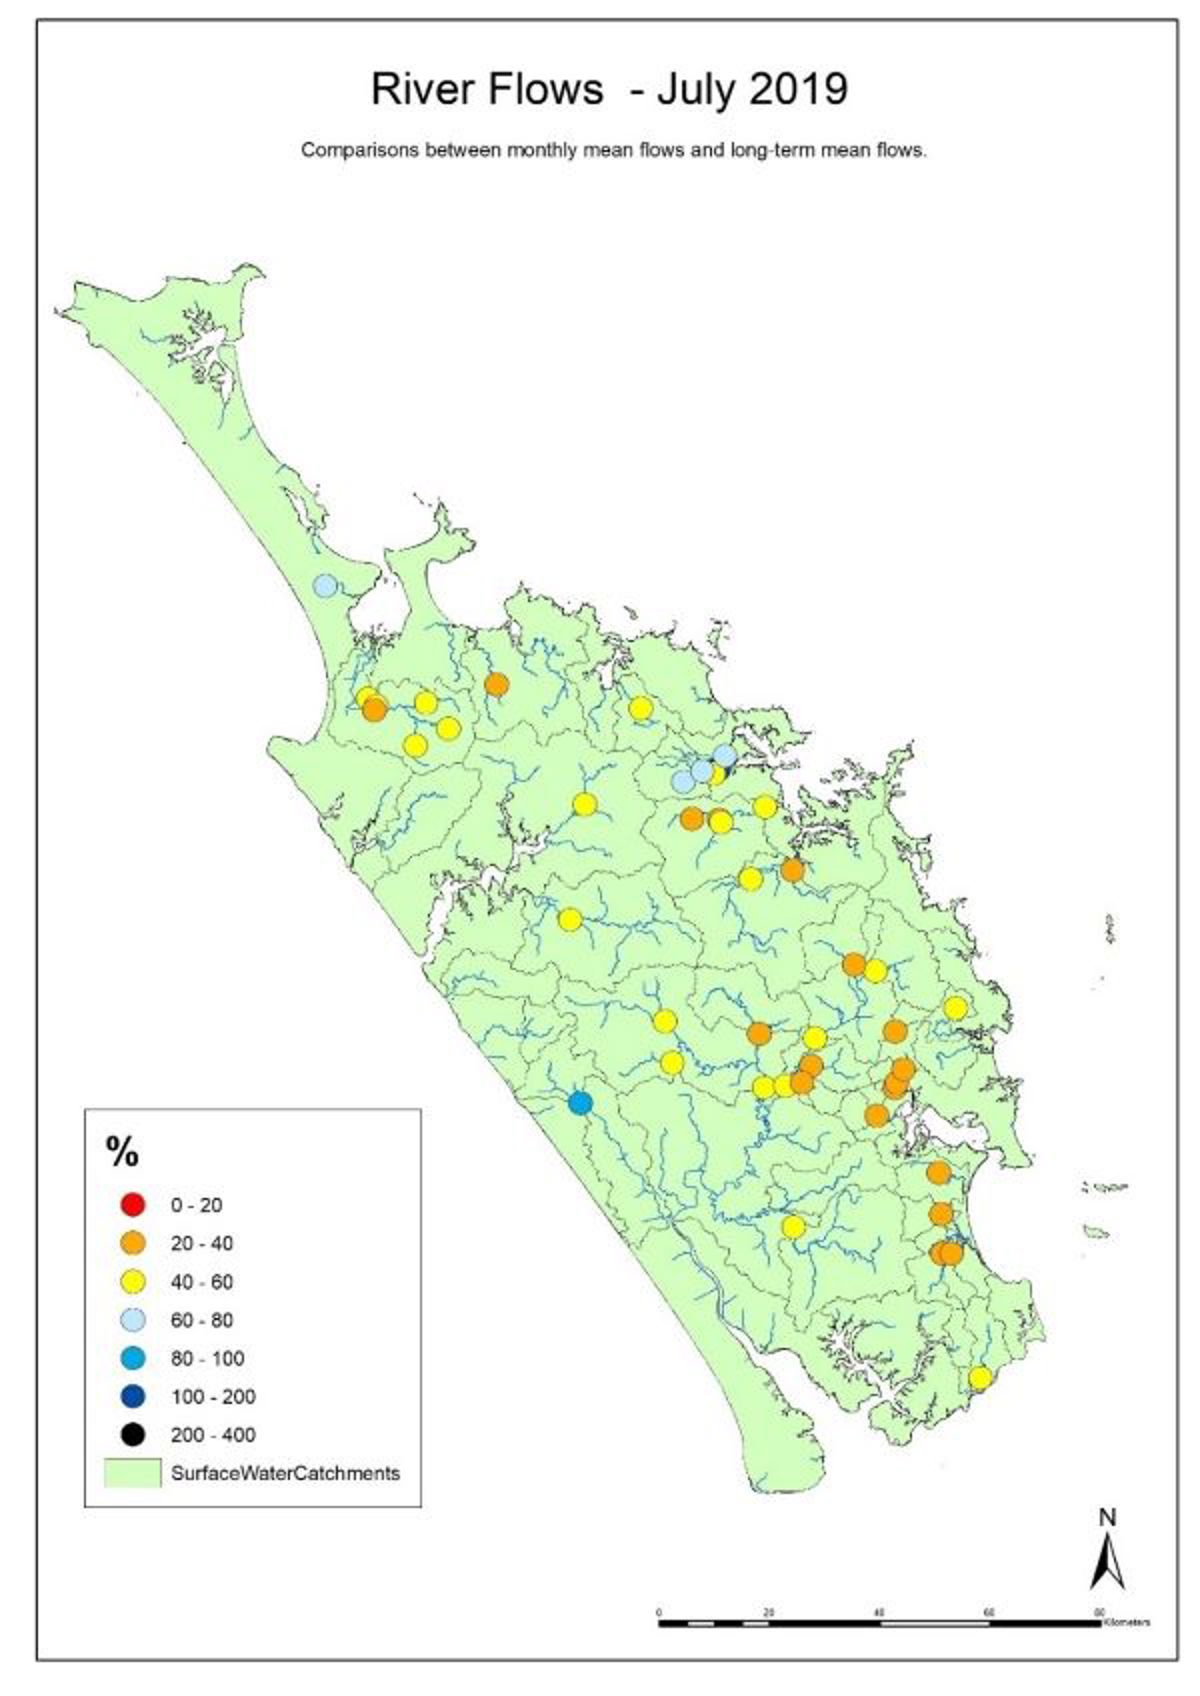
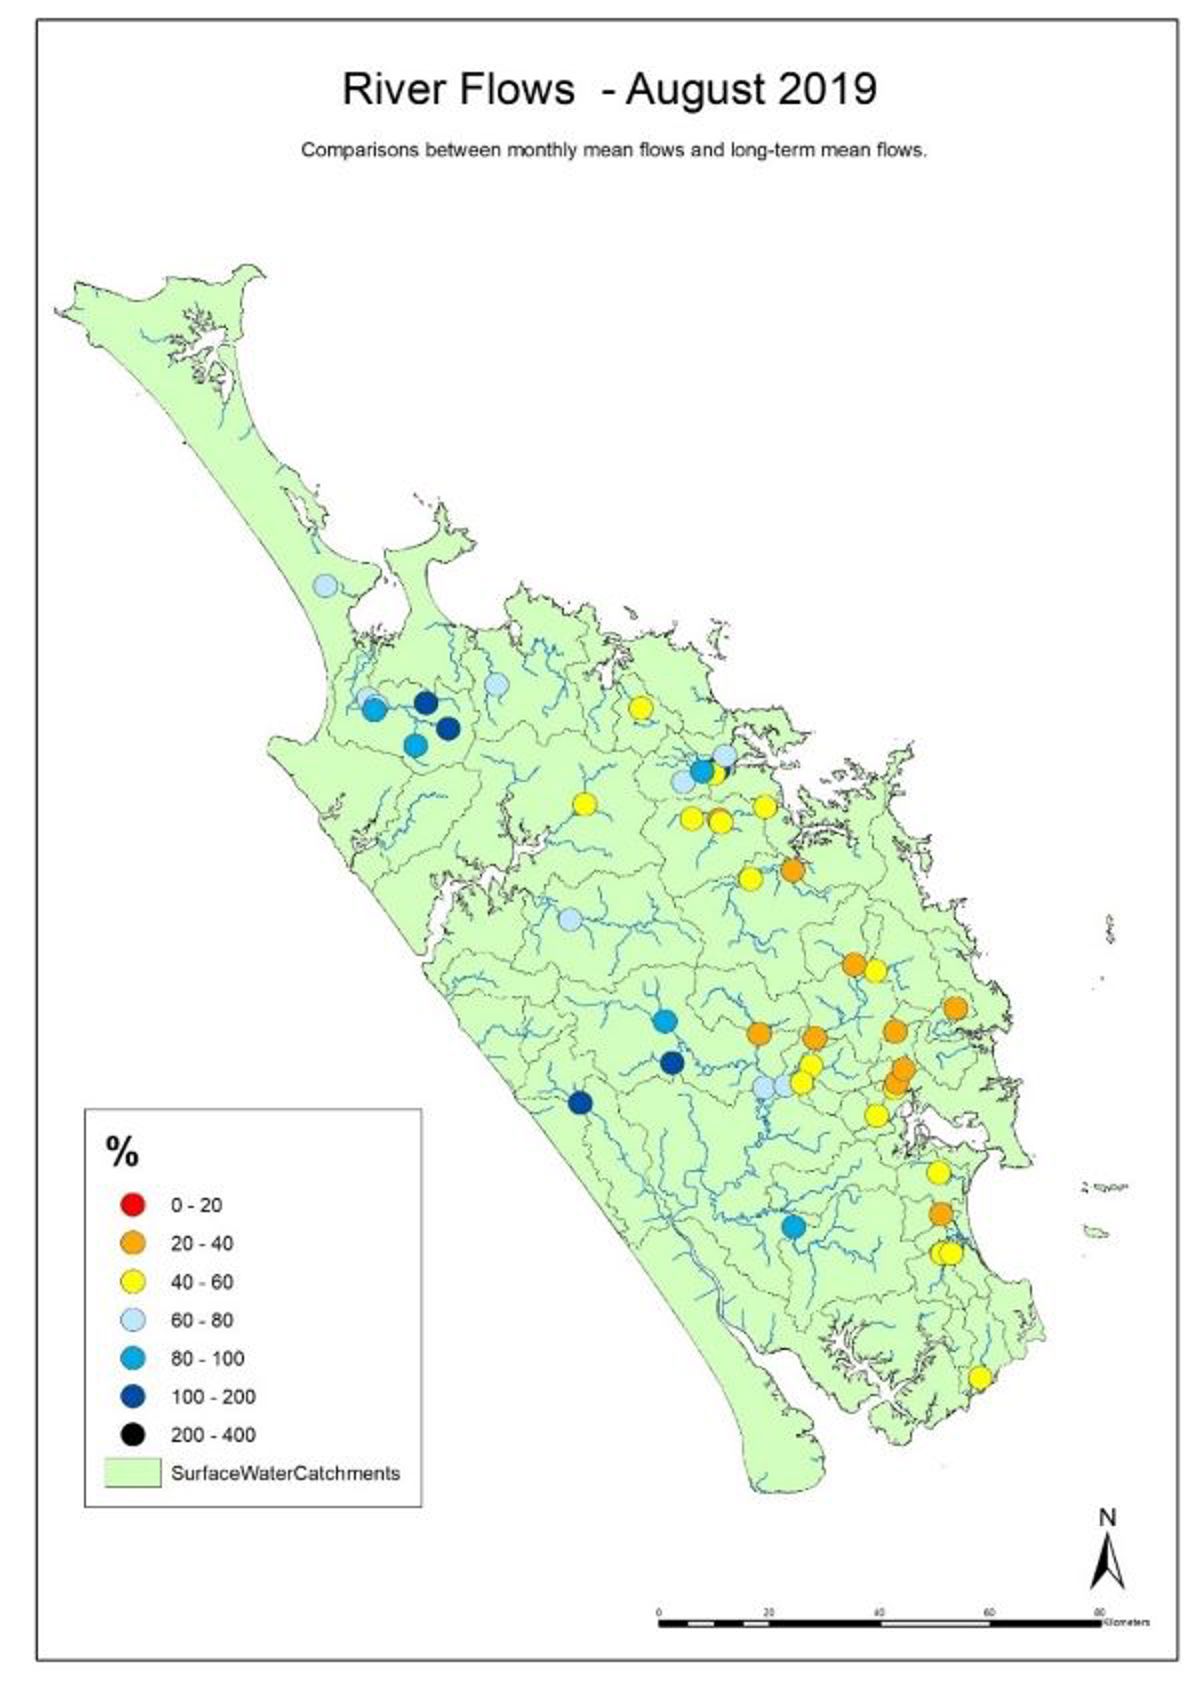
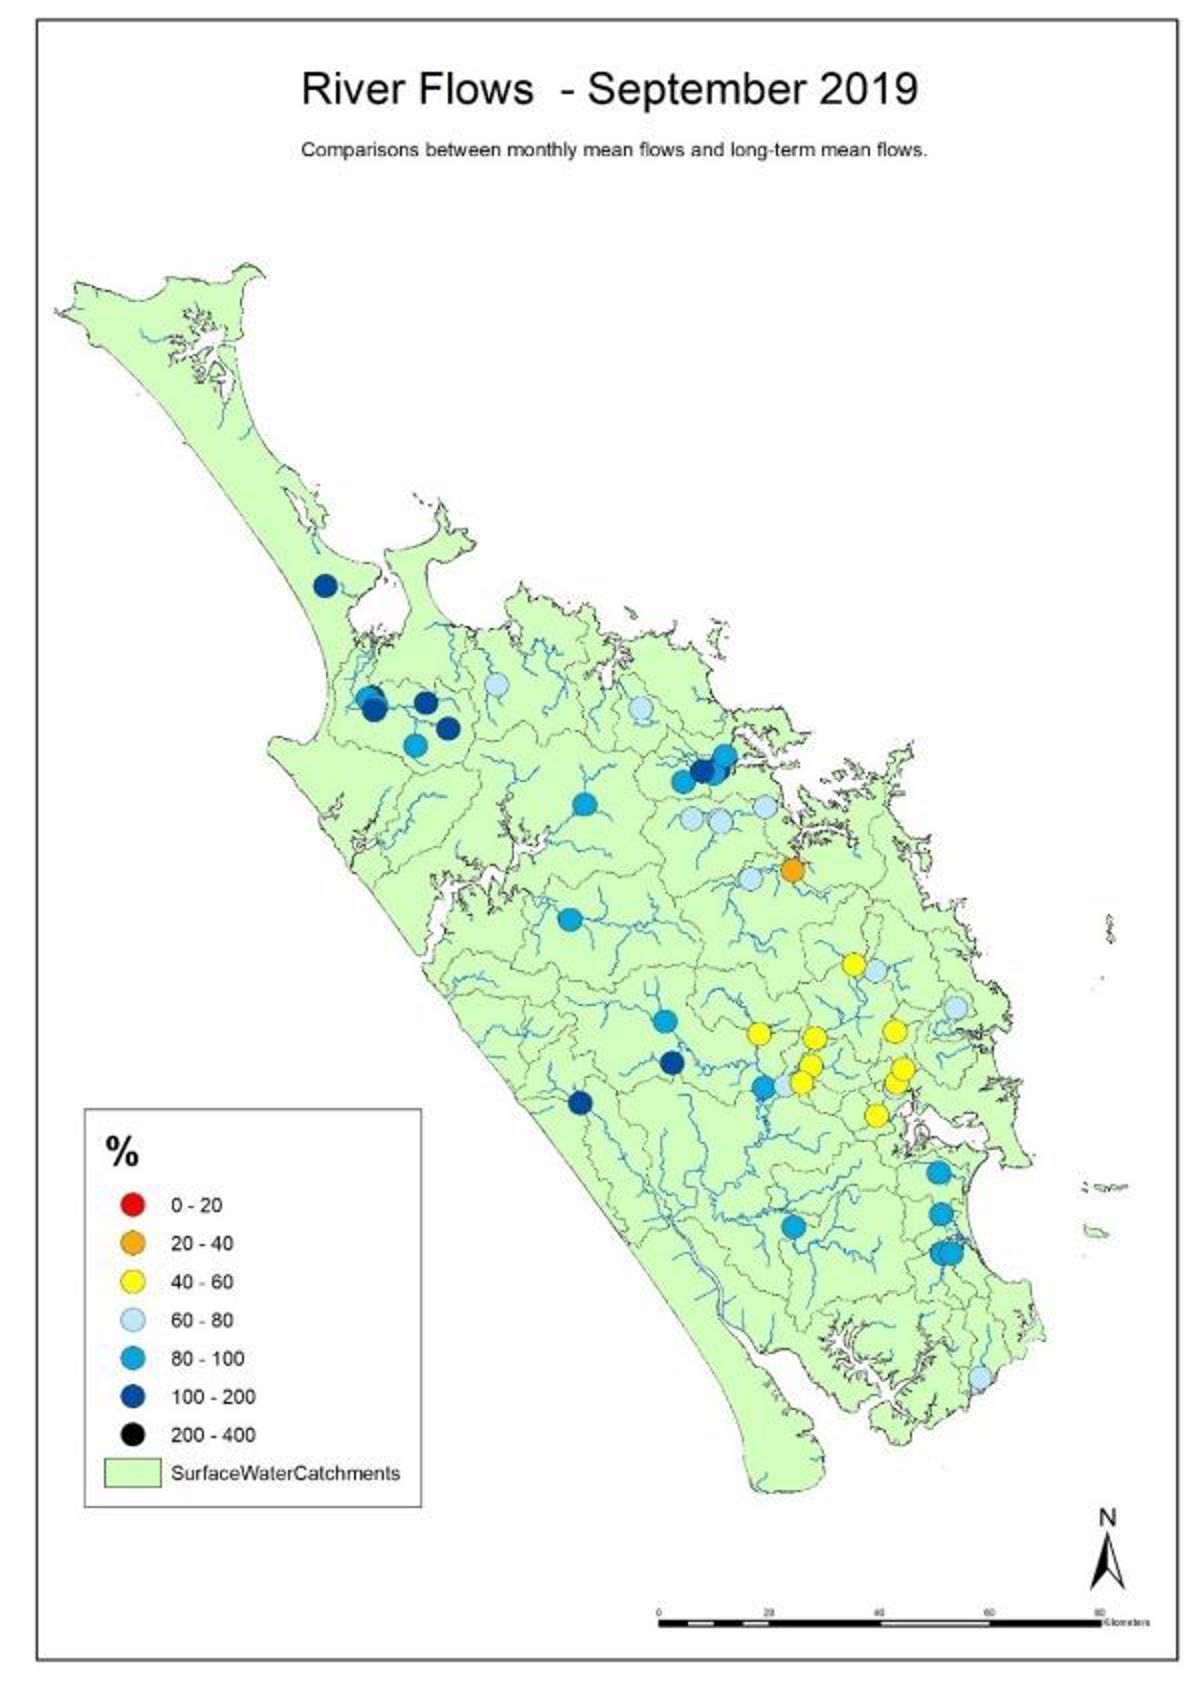
River flows have been improving from June to September with many rivers, particularly on the West recording near normal flows for September. There remain some recorders on the East form the Bay of Islands to Whangārei that have reordered only 40-80% percent of the normal flow for September. This is consistent with the below normal rainfall received in these areas for September. Many of these rivers on the East Coast has recorded well below average flow consistently for the past 7 months and will need to be watched closely leading into summer.
Flow map June to September 2019
(Use the arrow (>) to navigate through the flow maps).


Groundwater
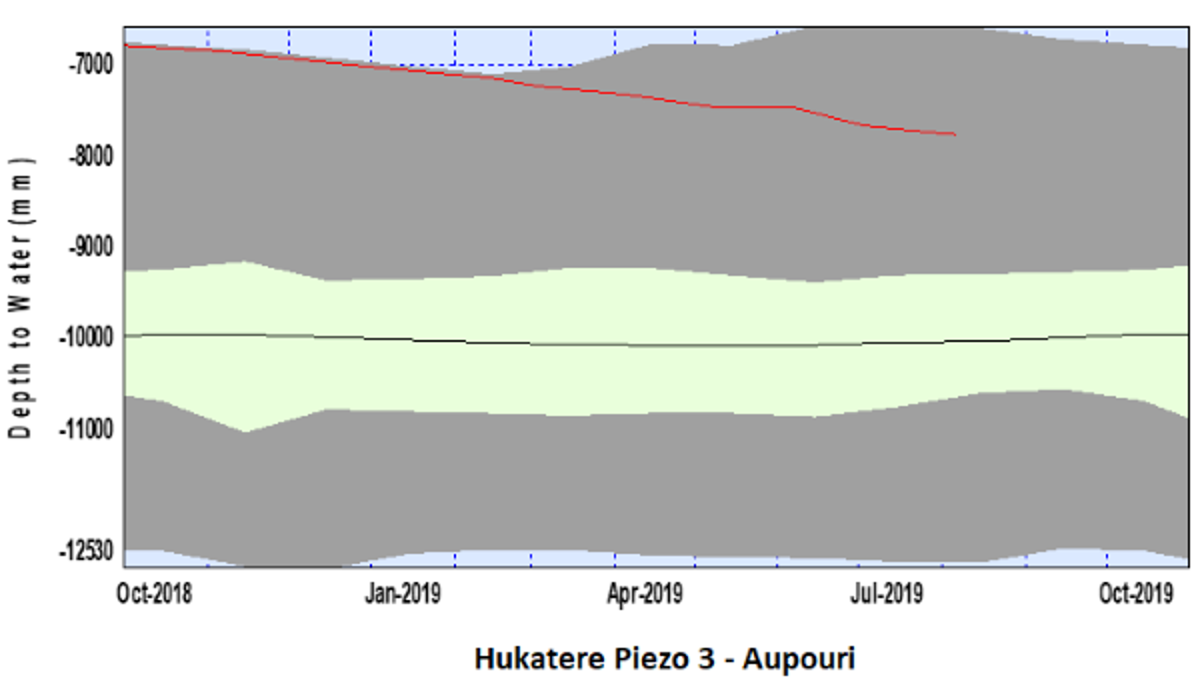
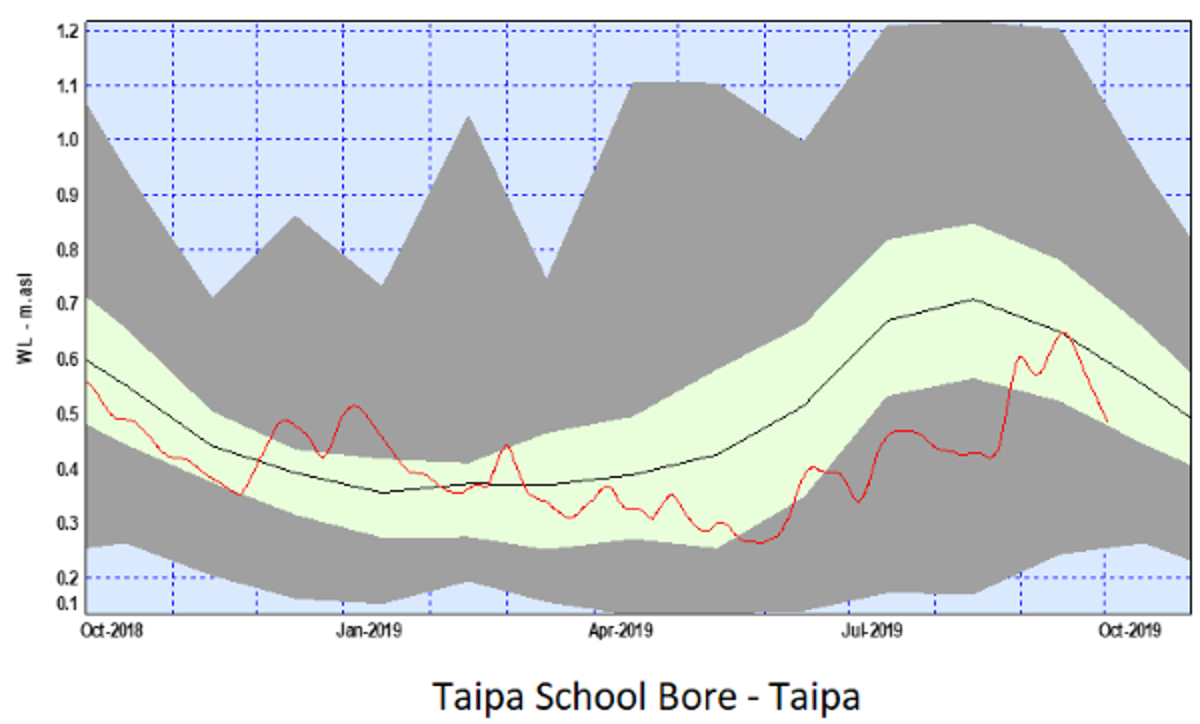
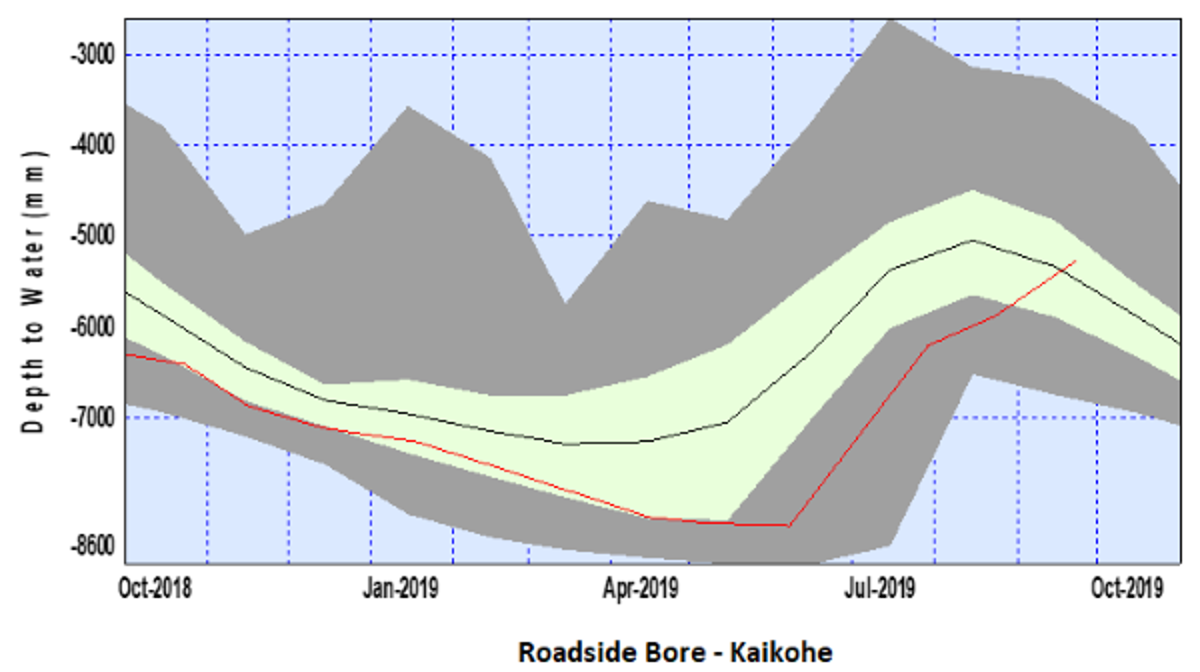
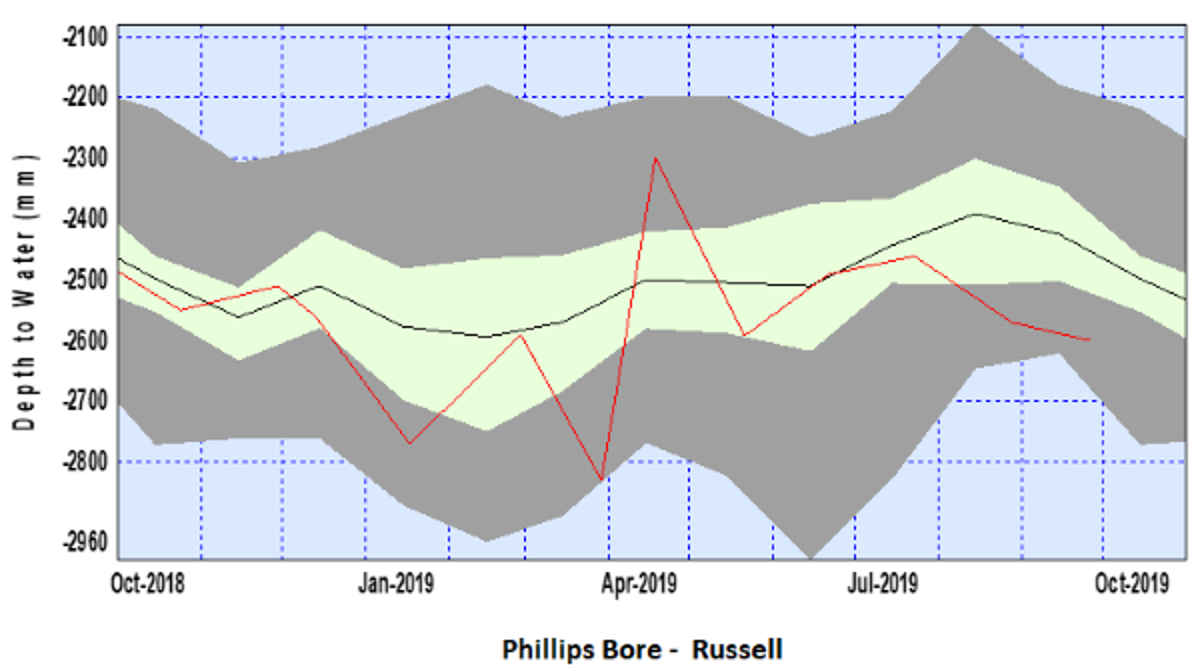
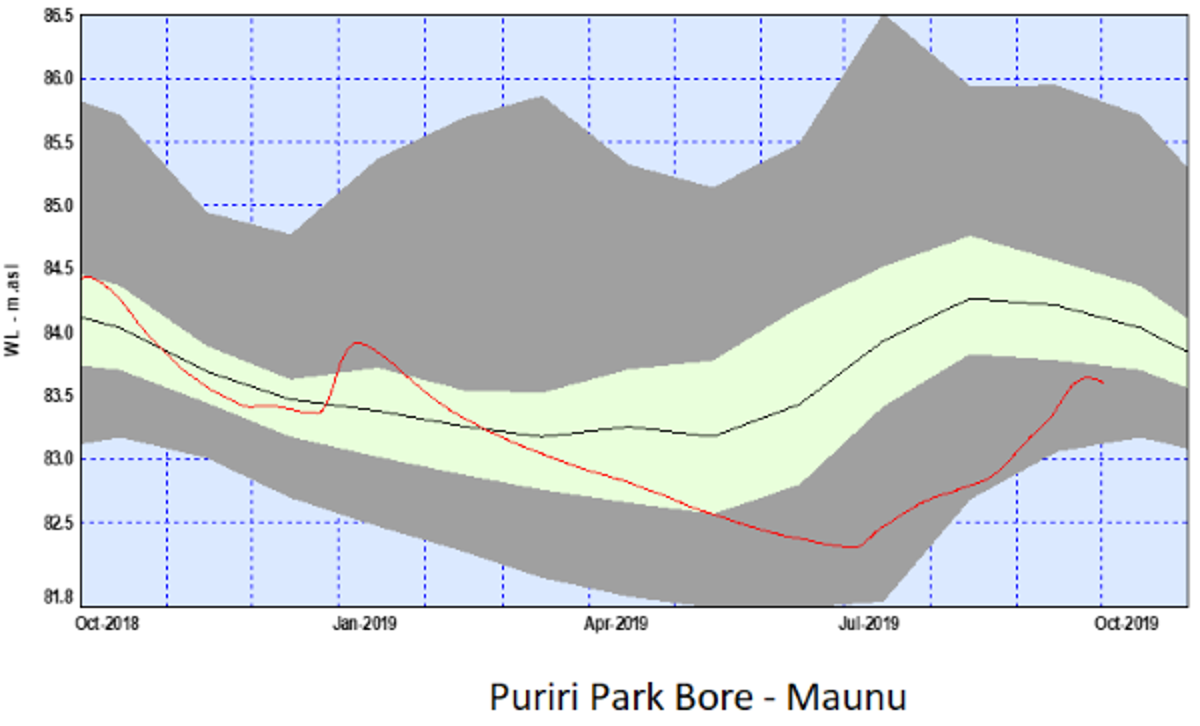
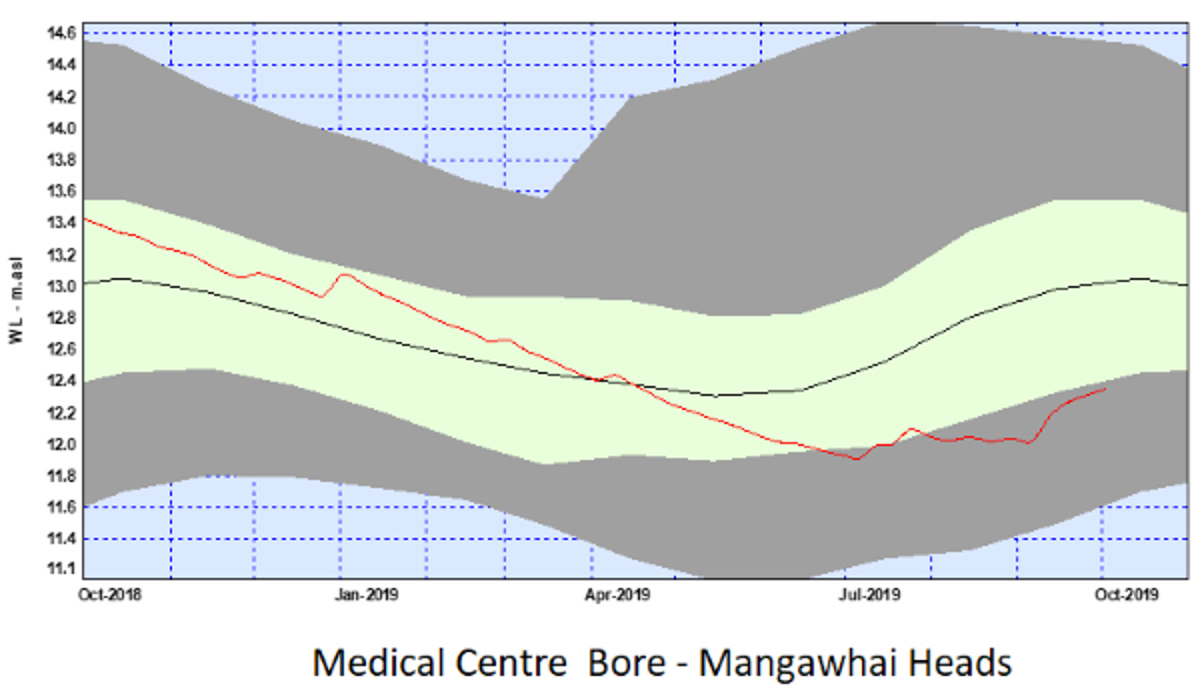
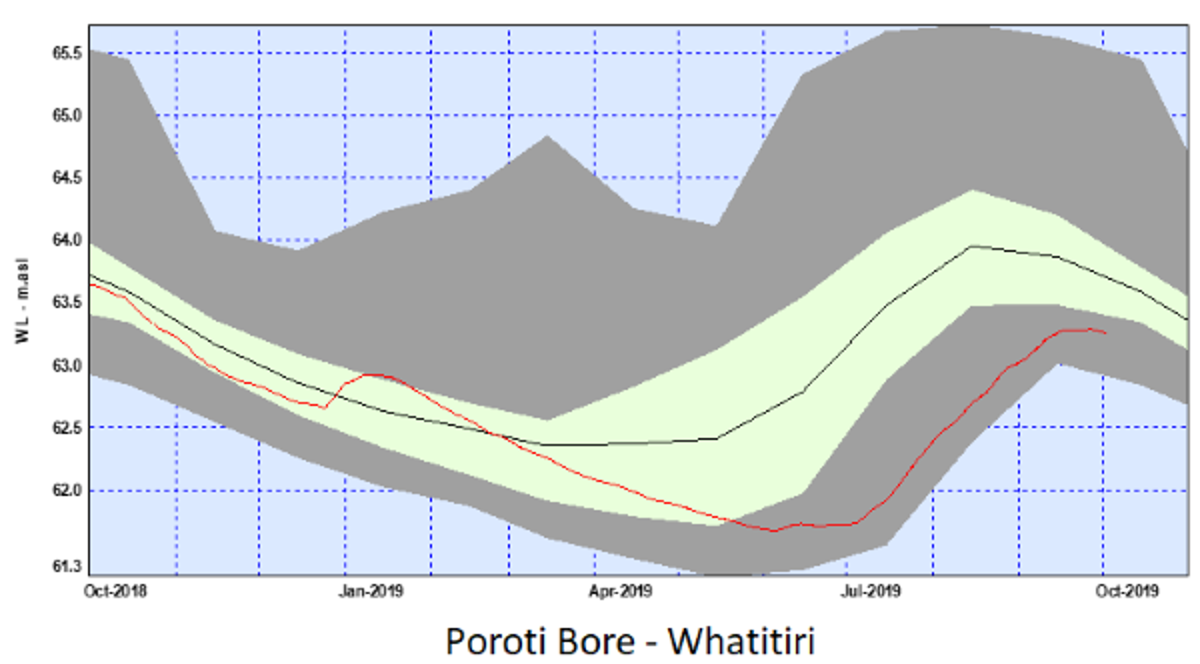
Water level readings indicate that the Whangārei, Marsden-Raukaka, Mangawhai and Poroti aquifers were below average for September 2019. Two of the bores in Kaikohe indicate below normal groundwater levels while, two indicate near normal levels. The groundwater systems at Russell, Taipa and Aupouri appear OK. The “One-year groundwater trend” plots below show that some groundwater systems are still below long-term averages for this time of year, and where the red line is within or approaching the bottom grey bar, the systems are at or below 20th percentile levels.
Northland aquifer status
|
Groundwater Systems |
Status for June 2019 |
|
Aupouri |
OK |
|
Taipa |
OK |
|
Russell |
OK |
|
Kaikohe |
AT OR BELOW AVERAGE |
|
Whangarei |
BELOW AVERAGE |
|
Marsden-Ruakaka |
BELOW AVERAGE |
|
Mangawhai |
BELOW AVERAGE |
|
Poroti |
BELOW AVERAGE |
One-year groundwater trends (red) relative to the long-term average (black) and upper and lower percentiles (bottom grey area denotes 0-20th percentiles)
(Use the arrow (>) to navigate through the groundwater trends).


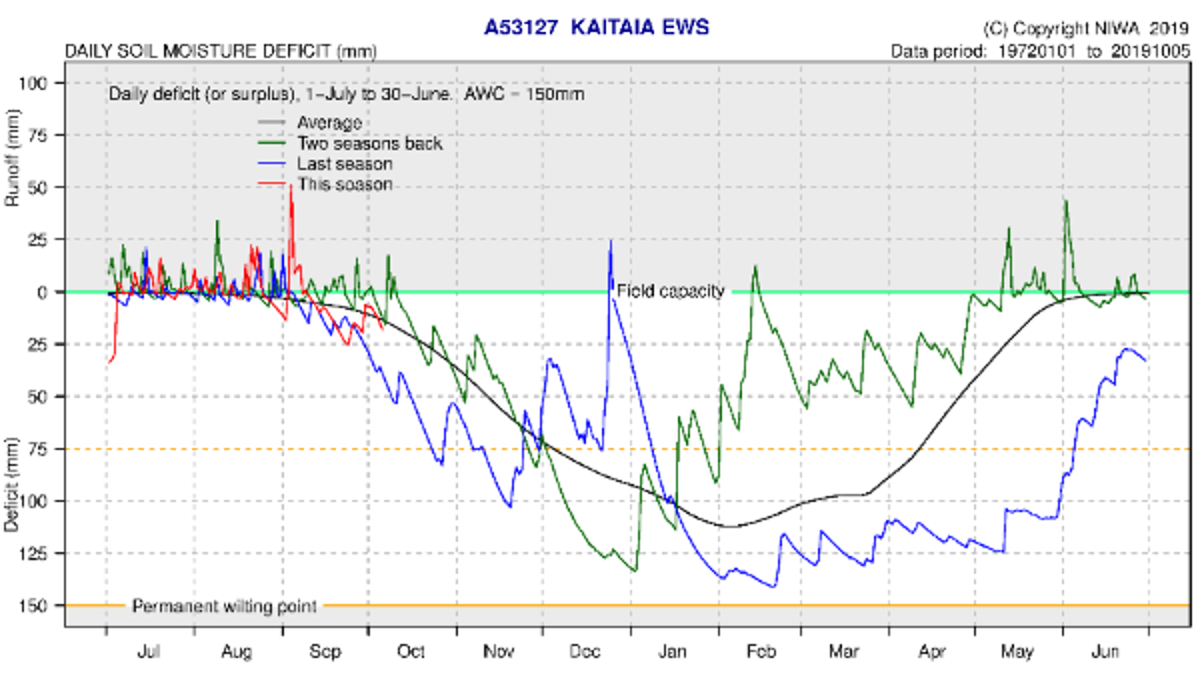
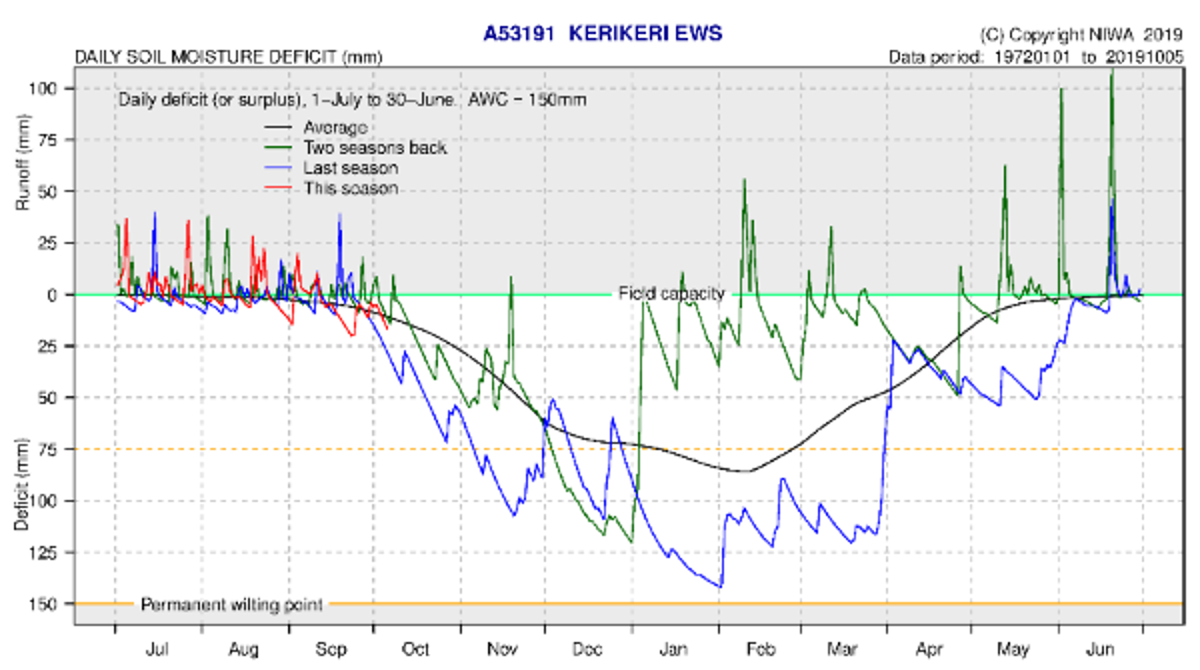
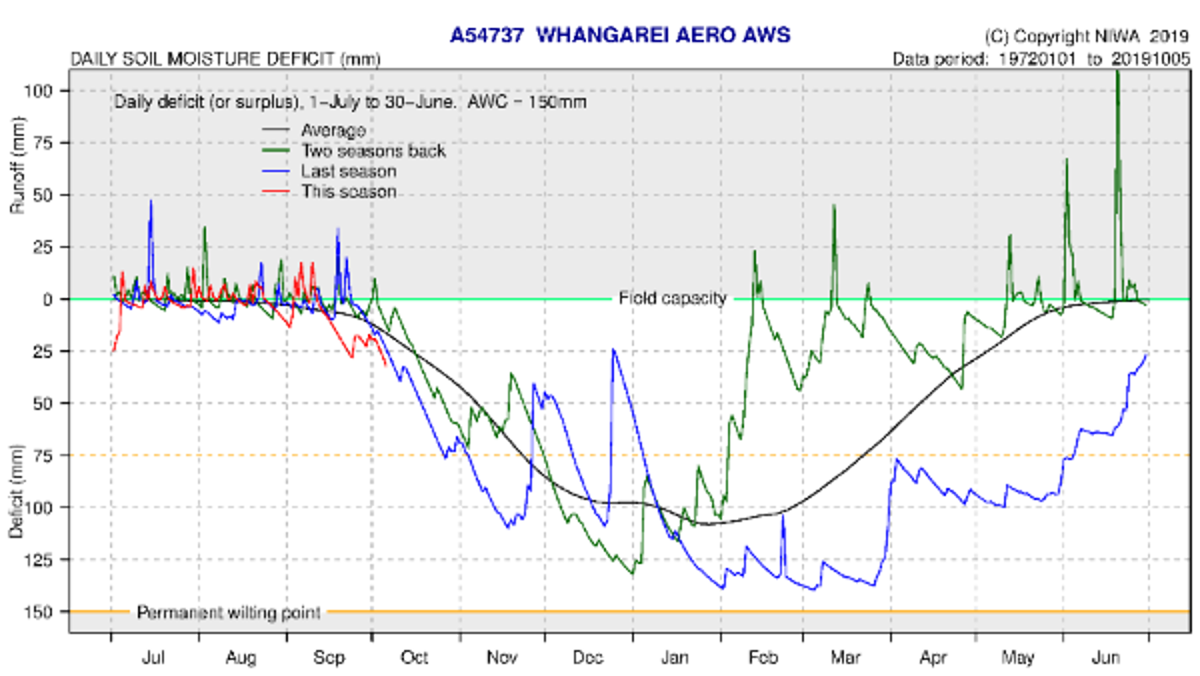
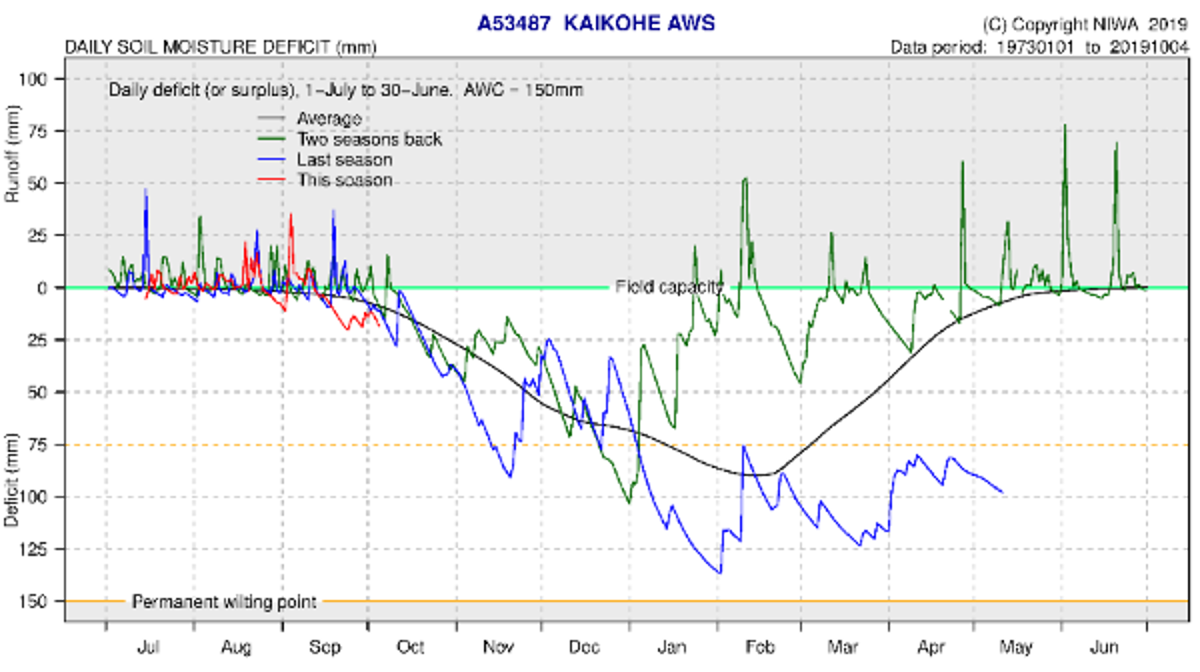
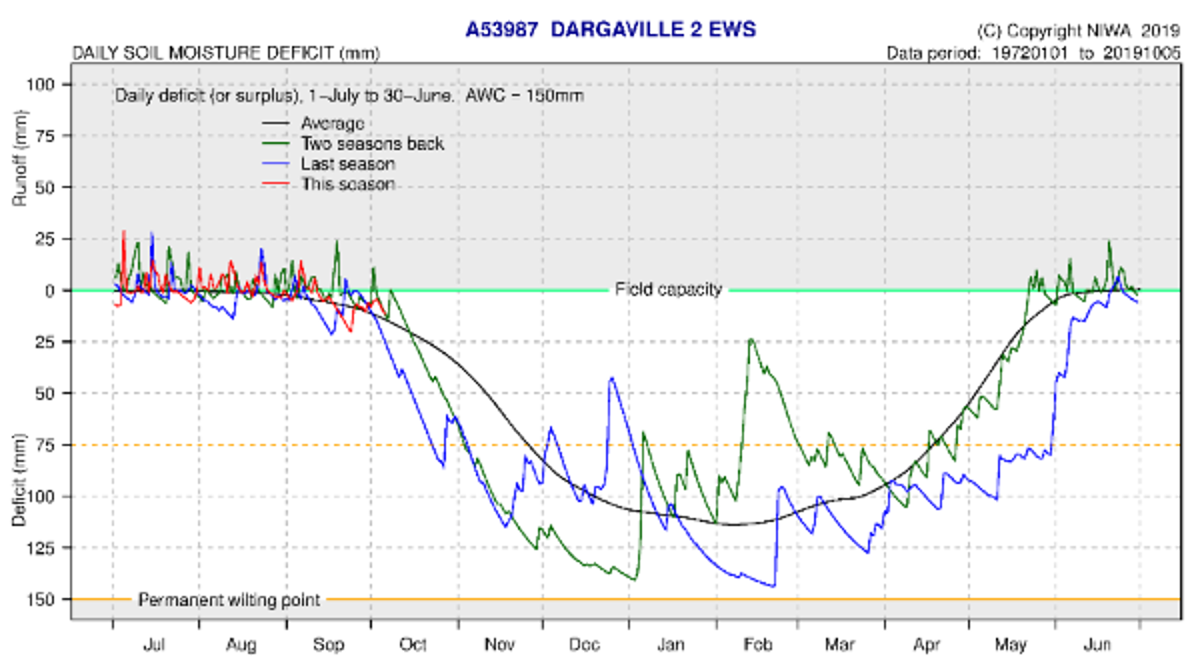
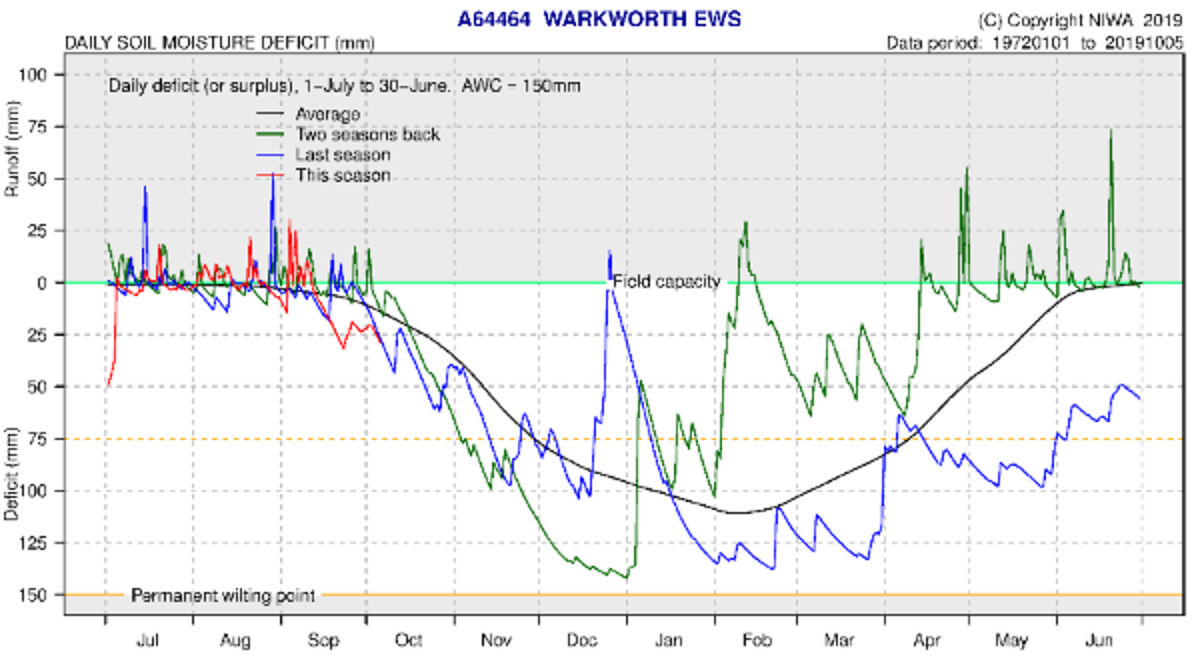
Soil moisture deficits
NIWA water balance modelling indicates soil moisture deficit is close to the average and at or just above field capacity. This is normal for this time of year. “SMD is calculated based on incoming daily rainfall (mm), outgoing daily potential evapotranspiration (PET, mm), and a fixed available water capacity (the amount of water in the soil 'reservoir' that plants can use) of 150 mm” (NIWA).
Soil moisture deficit at NIWA climate stations
|
NIWA Climate Station |
Observed Soil moisture deficit (mm) as of 07/10/2019 |
Average April soil moisture deficit |
Difference between Expected and Average |
|
Kaitaia |
15 mm |
15 mm |
0 |
|
Kerikeri |
15 mm |
15 mm |
0 |
|
Kaikohe |
15 mm |
10 mm |
-5 |
|
Whangārei |
30 mm |
15 mm |
-15 |
|
Dargaville |
15 mm |
15 mm |
0 |
|
Warkworth |
30 mm |
15 mm |
-15 |
NIWA Soil Moisture Deficit Plots
(Use the arrow (>) to navigate through Soil Moisture Deficit graphs).