April climate report 2019
15 Apr 2019, 10:48 AM
Summary
Very dry conditions persisted through most of March, consistent with the recent dry weather theme. Warm sea surface temperatures (Figure 1) and warm air temperature dominated the month. There was a break to the dry weather at the very end of the month, with some moderate rainfall figures recorded between 28 March and 3 April, mostly in the Eastern Hills and Bay of Islands (178 mm and 143 mm, respectively) (Figures 2-4). This rainfall was much needed in these areas, as flows at some river recorders in the Bay of Islands area and Wairua catchment were at around 1:10 year low flows during March. Furthermore, flows at stations throughout the region were at of 0-20% of typical March flows (Figure 8). Although rainfall at the end of March raised river flows above 7-day MALF at most recorders, the forecast of below or near normal rainfall for April (MetService), and below normal soil moisture and river flows for April-June (NIWA) suggest that a close eye should still be kept on Northland's rivers over the coming months. Large rainfall deficits remain in Kerikeri, Kaikohe, Raumanga and Kaitaia. These rainfall deficits will continue to influence river flows and groundwater until some significant rainfall is received.
Outlook
April:
MetService predicts some low pressure systems influencing weather in Northland through April, with predominate easterly winds and showery conditions, particularly in eastern areas. However, rain is likely to be patchy and drizzly. There are no signals for significant rainfall events at this stage, and the month overall is likely to be slightly dryer than average, or near average.
April – June:
A central pacific El Niño event continues for the coming months, with ocean and atmospheric conditions remaining weakly coupled. This quarter is expected to start with mixed air flows, but higher pressure than normal is expected to predominant in following months. Rainfall for April to June is predicted to be equally likely to be below normal and near normal, while soil moisture and river flows are most likely to be below normal for this period (50-55% chance) (Table 1).
Figure 1: Recent sea surface temperature anomalies
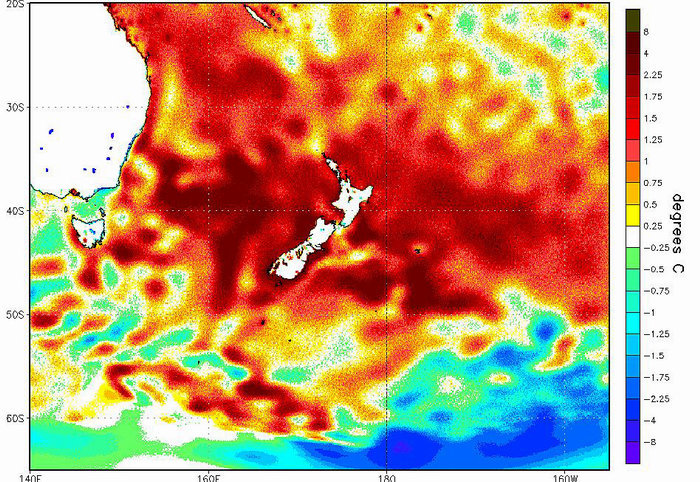
Table 1: NIWA Temperature, Rainfall, Soil Moisture and River Flows probabilities for April to June 2019
| Temperature | Rainfall | Soil moisture | River flows | |
| Above average | 50• | 25 | 25 | 20 |
| Near average | 40 | 40• | 25 | 30 |
| Below average | 10 | 35 | 50• | 50• |
Rainfall
Rainfall totals during March were less that would be expected for the month, with as little as 20 mm recorded around Whangārei and Bream Bay and around 70mm in the Eastern Hills and Bay of Islands areas. This equates to between 30% and 70% of rainfall expected for the month in comparison to long term medians (Figures 2-4). Most of this rain fell towards the end of March with the rainy period extended on to the beginning of April. Fortunately, much of this week-long rain fell in the areas that needed it most, with the Eastern Hills receiving up to 178 mm and the Bay of Islands receiving up to 143 mm.
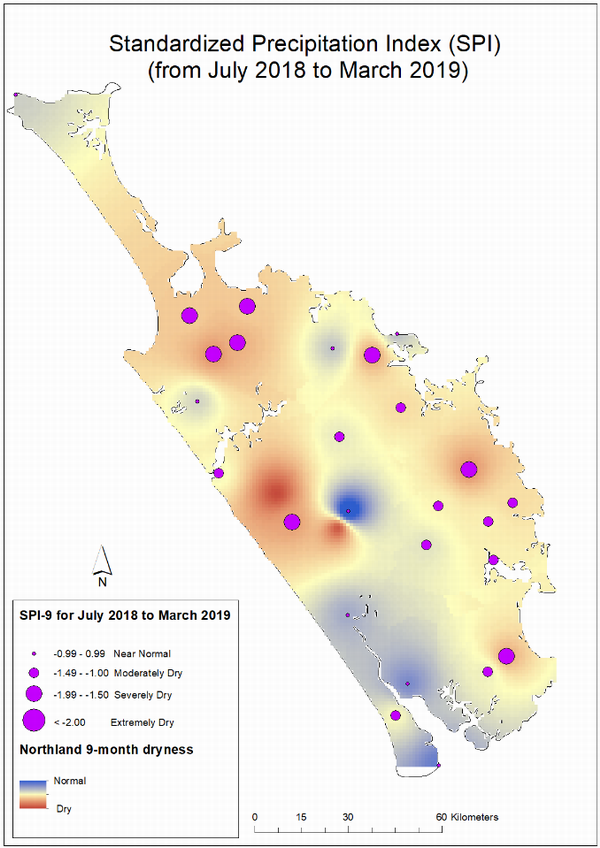
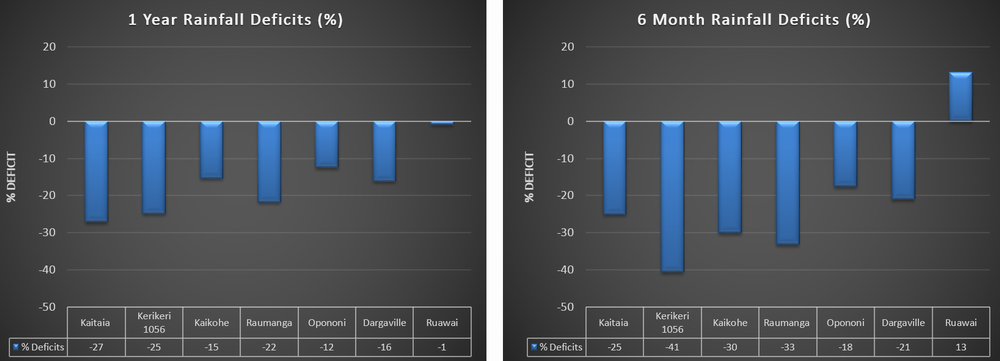
SPI rainfall indexing covering the period of dryer than average conditions (between July 2018 and March 2019) shows that at the end of March, severely dry conditions were present in most areas, excluding the Kaipara surrounds (Figure 5). Rainfall deficit values show continuing deficits in all areas except Ruawai, with Kerikeri, Kaikohe and Raumanga showing the greatest deficit over the previous 6 months and Kaitaia showing the greatest deficit over the previous year (Figures 6-7). This rainfall deficit will continue until Northland either experiences some significant rainfall events, or experience wetter than average monthly rainfall over a number of months.
Figures 2 - 4: Rainfall mm, % median and SPI Index maps for March 2019
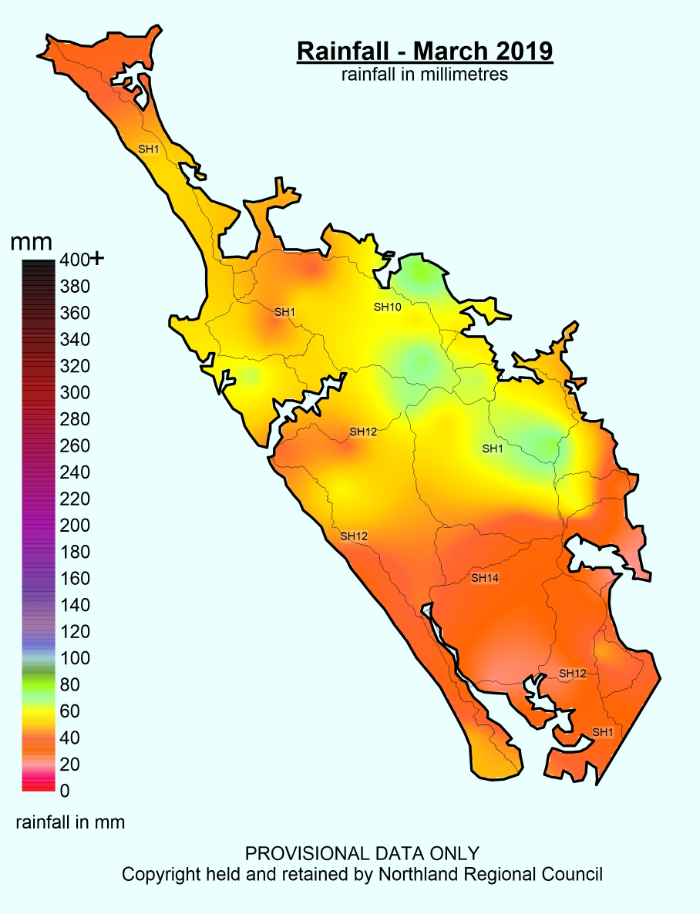
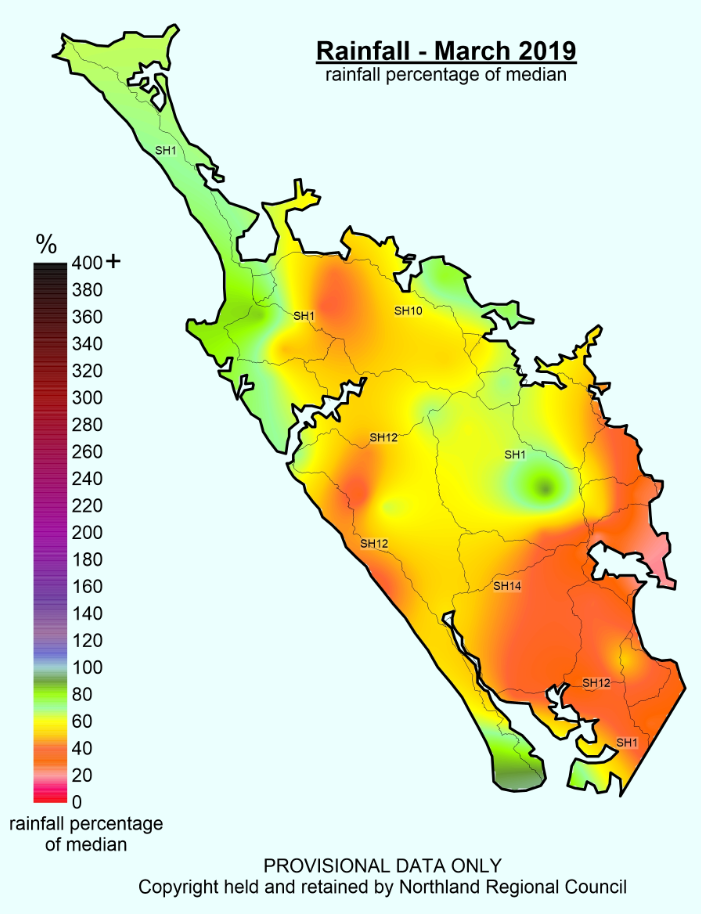
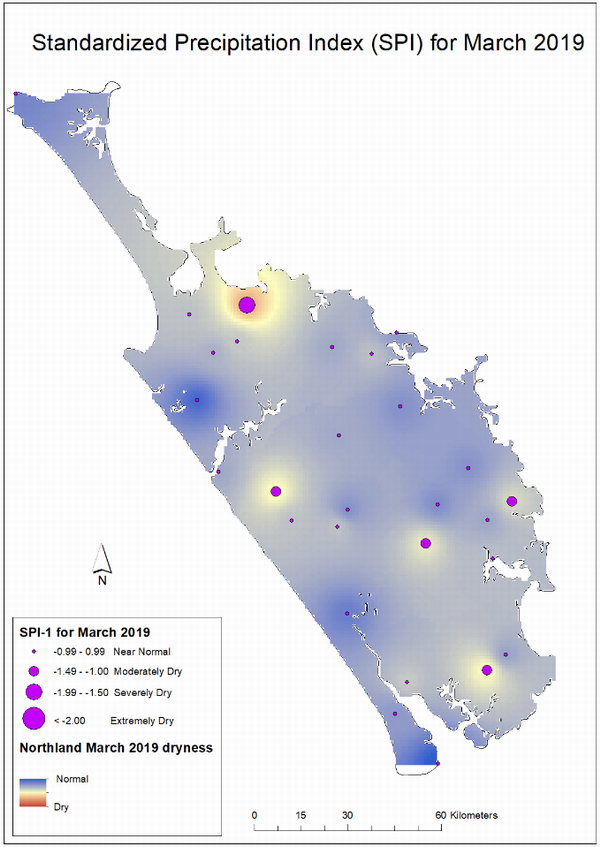
Figure 5: SPI Index map for the dry period, July 2018 to March 2019
Figures 6-7: One year and six-month rainfall deficit percentage values
River flows
River flows for the month of March continued to show then effects of low rainfall over the previous 9 months. The “River Flows” map below shows that most stations recorded mean monthly flows of 0-20% of typical March flows (Figure 8). Most of the stations recorded flows below “7-day MALF” for most of the month, and some in the Bay of Islands and the Wairua catchment spent a good proportion of the month below “1:5 year low flow” levels (Table 2). Most notably, The Maungaparerua River in the Bay of Islands, and the Wairua, Whakapara and Waiotu Rivers in the Wairua catchment recorded flows at 1:10 year low flow levels during March.
Fortunately, the rainy period between 27 March and 4 April has improved the situation, raising most river levels above 7-day MALF. Table 3 below shows an estimate of the number of rain free days needed for these stations to drop back below 7-day MALF and 1:5 year low flows. Note though, that rain forecast for this week (10th to 14th April) will likely raise the rivers once more and change these predictions.
Figure 8: Flow Map March 2019
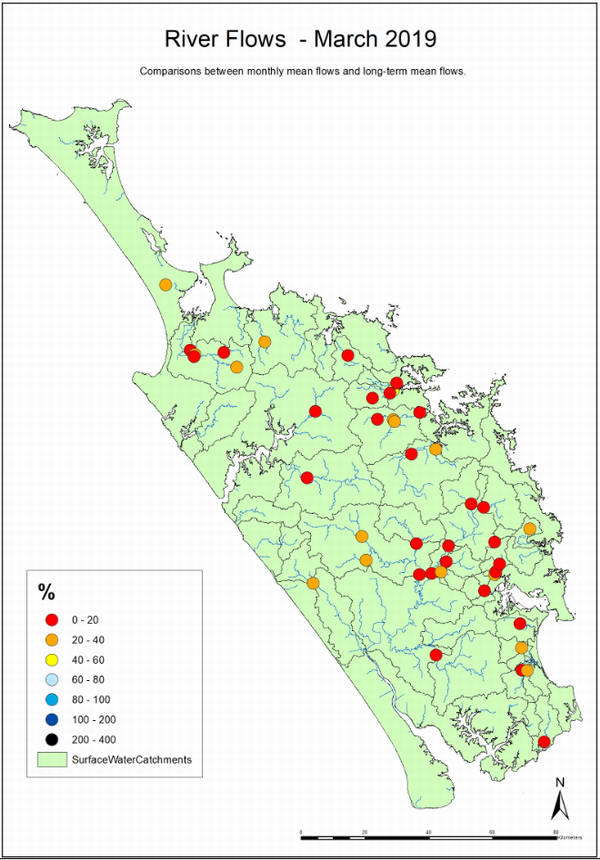
Table 2: Count of days below 7 Day MALF and 1:5 year low flows and river recorders during previous three months:
| Days below 7 day MALF | |||
| Site | Jan-19 | Feb-19 | Mar-19 |
| Awanui at School Cut | 0 | 13 | 21 |
| Oruru at Saleyards | 0 | 0 | 15 |
| Punakitere at Taheke | 4 | 16 | 31 |
| Waipapa at Forest Ranger | 23 | 24 | 29 |
| Maungaparerua at Tyrees Ford | 17 | 23 | 31 |
| Rangitane at Stirling | 9 | 12 | 31 |
| Waitangi at Wakelins | 20 | 20 | 31 |
| Opouteke at Suspension Br | 0 | 12 | 19 |
| Kaihu at Gorge | 0 | 13 | 22 |
| Mangahahuru at County Weir | 1 | 17 | 28 |
| Mangakahia at Gorge | 0 | 0 | 19 |
| Mangakahia at Titoki Br | 0 | 8 | 22 |
| Manganui at Permanent Station | 0 | 17 | 13 |
| Hikurangi at Moengawahine | 0 | 15 | 30 |
| Wairua at Purua | 25 | 26 | 31 |
| Waiotu at SH1 Br | 0 | 0 | 17 |
| Ngunguru at Dugmores Rock | 0 | 6 | 20 |
| Waipao at Draffins Rd | 14 | 28 | 31 |
| Mangere at Knights Rd | 4 | 12 | 11 |
| Hatea at Whareora Rd | 0 | 0 | 14 |
| Raumanga at Bernard St | 0 | 12 | 27 |
| Waiarohia at Lovers Lane | 9 | 20 | 28 |
| Waihoihoi at St Marys Rd | 3 | 0 | 0 |
| North at Applecross Rd | 0 | 0 | 6 |
| Ahuroa at Braigh Flats | 0 | 0 | 14 |
| Days below 1:5 year low flows | |||
| Site | Jan-19 | Feb-19 | Mar-19 |
| Awanui at School Cut | 0 | 0 | 4 |
| Oruru at Saleyards | 0 | 0 | 0 |
| Punakitere at Taheke | 0 | 0 | 13 |
| Waipapa at Forest Ranger | 2 | 13 | 27 |
| Maungaparerua at Tyrees Ford | 2 | 13 | 29 |
| Rangitane at Stirling | 0 | 0 | 8 |
| Waitangi at Wakelins | 0 | 0 | 6 |
| Opouteke at Suspension Br | 0 | 0 | 0 |
| Kaihu at Gorge | 0 | 0 | 0 |
| Mangahahuru at County Weir | 0 | 0 | 0 |
| Mangakahia at Gorge | 0 | 0 | 3 |
| Mangakahia at Titoki Br | 0 | 0 | 5 |
| Manganui at Permanent Station | 0 | 0 | 0 |
| Hikurangi at Moengawahine | 0 | 0 | 16 |
| Wairua at Purua | 0 | 12 | 31 |
| Waiotu at SH1 Br | 0 | 0 | 17 |
| Whakapara at Cable Bay | 0 | 0 | 15 |
| Ngunguru at Dugmores Rock | 0 | 0 | 0 |
| Waipao at Draffins Rd | 0 | 0 | 0 |
| Mangere at Knights Rd | 4 | 6 | 5 |
| Raumanga at Bernard St | 0 | 0 | 10 |
| Waiarohia at Lovers Lane | 0 | 0 | 0 |
| Waihoihoi at St Marys Rd | 0 | 0 | 0 |
| North at Applecross Rd | 0 | 0 | 3 |
| Ahuroa at Braigh Flats | 0 | 0 | 0 |
Table 3: Predicted River Flows for Northland from 09 April 2019 estimated from recession curves (assuming no rainfall from this point onwards):
| Water level recorder | Days to reach Mean Annual Low Flow (MALF) |
Days to reach 1-in-5 year low flow |
| Awanui at School cut | 0 | 30 |
| Kaihu at Gorge | 2 | 15 |
| Maungaparerua at Tyrees Ford | 10 | 25 |
| Ngunguru at Dugmores Rock | 0 | 8 |
Groundwater
Water level reading indicates that the Russell aquifer was below average for March 2019. The systems at Aupouri, Taipa, Poroti and Mangawhai and Whangārei appear OK (Table 4). Note that there is no data available for Kaikohe and Marsden-Raukaka during March.
Table 4: Northland aquifer status
| Groundwater systems | Status FOR March 2019 |
| Aupouri | OK |
| Taipa | OK |
| Russell | BELOW AVERAGE |
| Whangārei | OK |
| Mangawhai | OK |
| Poroti | OK |
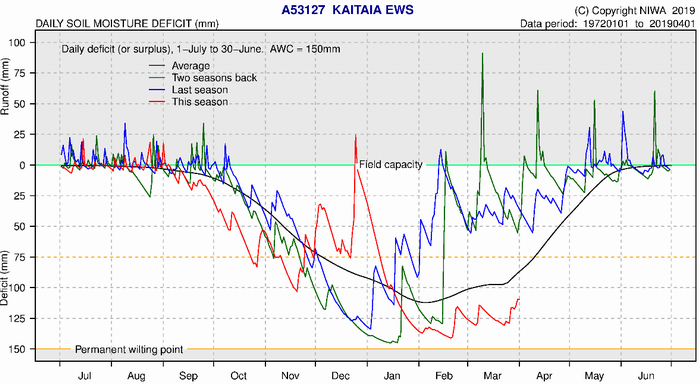
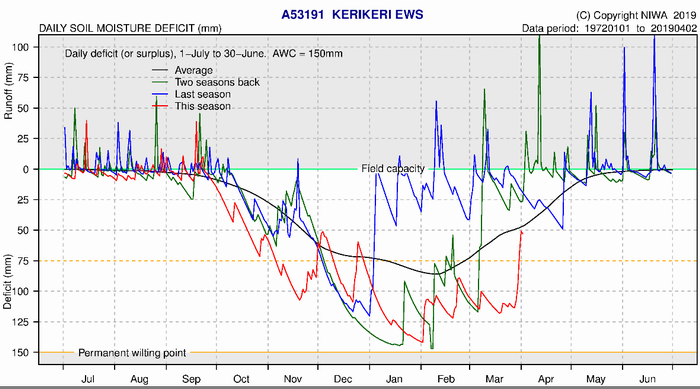
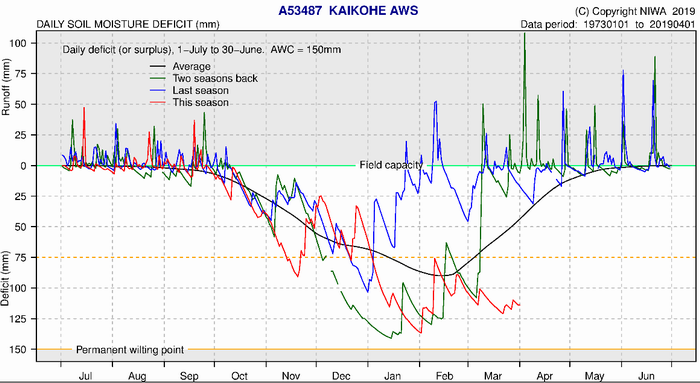
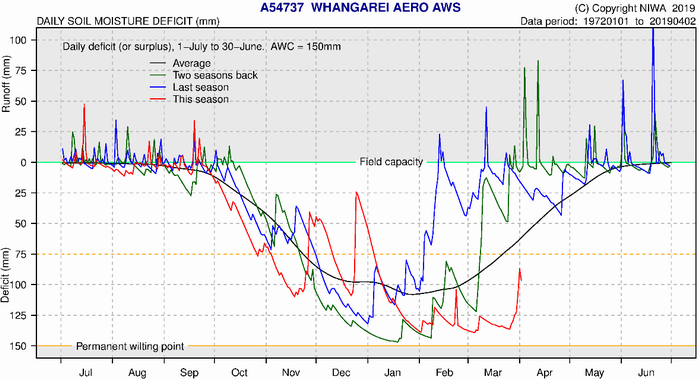
Soil moisture deficits
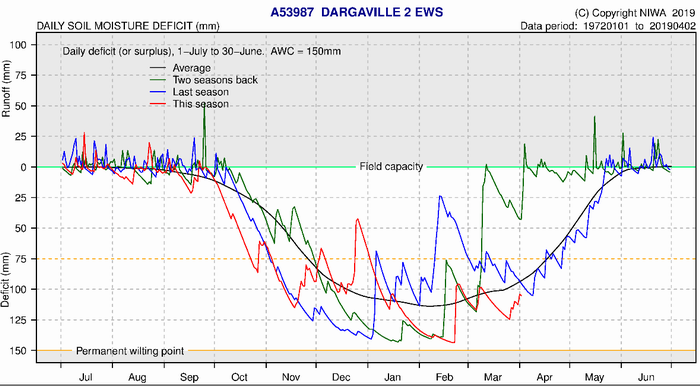
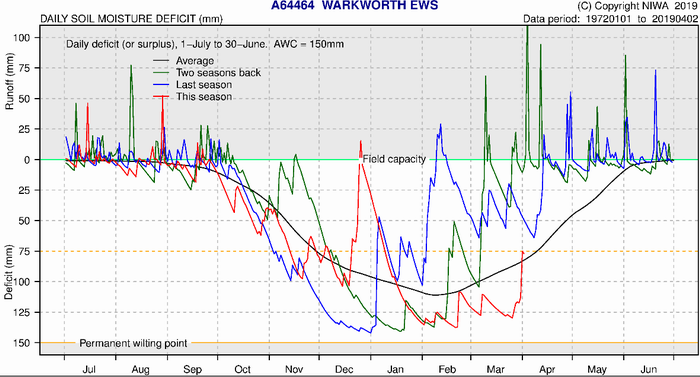
NIWA water balance modelling indicates soil moisture deficit is below average Kerikeri, Kaikohe, Whangārei and Dargaville, while Kerikeri and Warkworth are at or above average following the rain towards the end of March. (Table 5).
Table 5: Soil moisture deficit at NIWA climate stations
| NIWA Climate station | Observed Soil moisture deficit (mm) as of 01/04/2019 | Average March soil moisture deficit | Difference between Expected and Average |
| Kaitaia | -115mm | -90mm | -20 |
| Kerikeri | -50mm | -50mm | 0 |
| Kaikohe | -115mm | -50mm | -65 |
| Whangārei | -90mm | -60mm | -30 |
| Dargaville | -90mm | -100mm | -10 |
| Warkworth | -75mm | -90mm | +15 |
Figures 8-13: NIWA Soil Moisture Deficit Plots