January 2022 climate report
21 Feb 2022, 3:35 PM
Summary
- Rainfall during January 2022 was less than normal at around 43% of rainfall typically recorded for the month
- The east coast received more rainfall due to thunderstorm activity
- River Flows were “Normal” or “Below Normal” for most of Northland
- Groundwater levels were “Above Normal” or “Normal” in most groundwater systems
- Soil moisture for January 2022 was generally below average at all sites but has increased sharply following early February rainfall indicating some relief to dry ground
- NIWA long-term outlook predicts “above average” temperature and “near average” to “above average” rainfall between February and April. NIWA note that some rain events may be heavier than expected as some ex-tropical storms may continue to affect Northland’s climate.
Outlook
January to March 2022:
The NIWA long term forecast for February to April 2022 indicate that La Nina conditions have peaked in January but have a 75% chance of continuing for the foreseeable future, and this is the driving factor of the weather from February - April. In Northland we are likely to see higher than average temperature, with excessive humidity, and average to above average rainfall for the region. There continues to be a chance that ex-tropical cyclone activity could bring heavy rain events. Soil moisture and river flows are likely to be below average but some heavy rain events could see those rise rapidly. For more details, please refer to NIWA’s seasonal climate outlook for February - April 2022:
See the seasonal climate outlook on NIWA's website: niwa.co.nz
NIWA Temperature, Rainfall, Soil Moisture and River Flows probabilities for the period of February 2022 to April 2022
(Expressed as % likelihood for either Above Average, Near Average or Below Average conditions).
| Temperature | Rainfall | Soil moisture | River flows | |
| Above average | 70• | 35• | 25 | 25 |
| Near average | 25 | 40• | 45• | 45• |
| Below average | 05 | 25 | 30 | 30 |
Rainfall
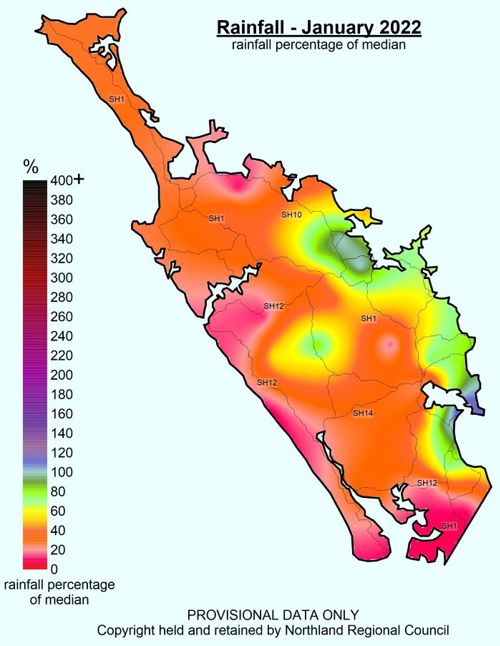
Rainfall in January was scattered and mainly dominated by sporadic showers and thunderstorm activity. Across Northland, the average rainfall was 33.6 mm, while usually we would expect an average rainfall of 79 mm, which translates to Northland receiving around 43% of its expected rainfall in January. Rainfall was not evenly distributed, with most of the west coast receiving less that 20 mm of rain (Oruru 11%, Pouto 10%, Kai Iwi 5% of expected rainfall).The east coast however did see higher rainfalls due to thunderstorm activity, with Marsden Point receiving 120% of its expected rainfall, and Kerikeri 101%.
Rainfall (% Median) for January 2022
3 and 6-Month SPI
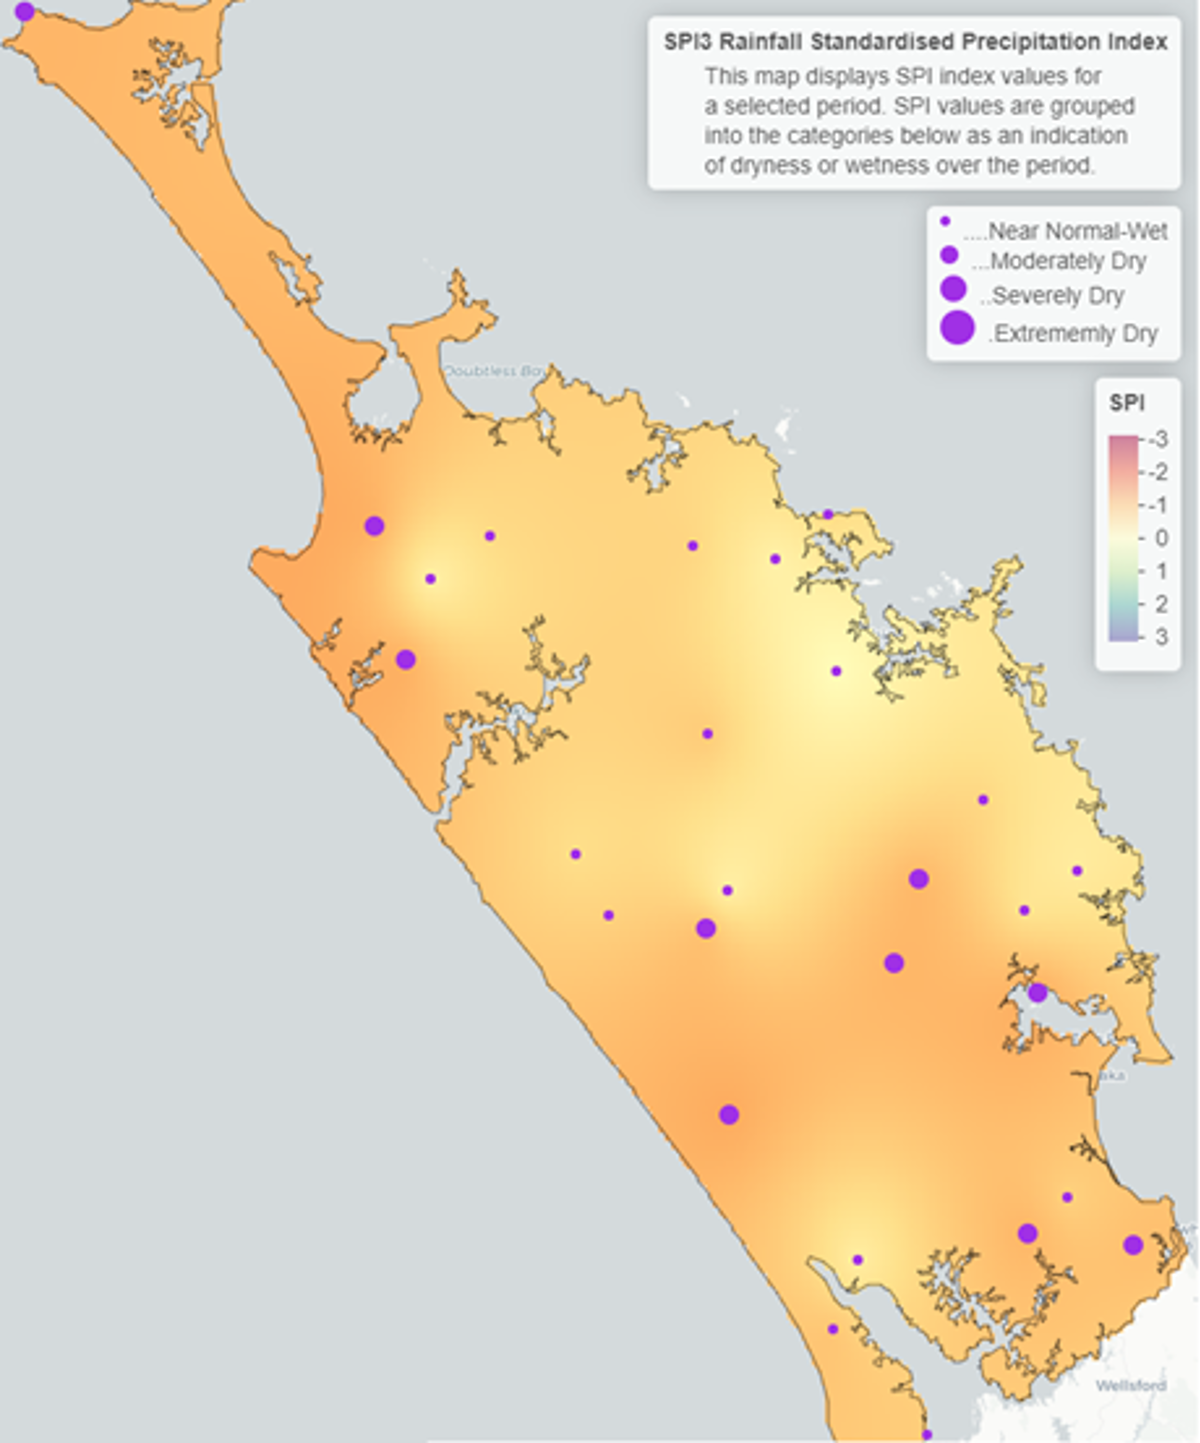
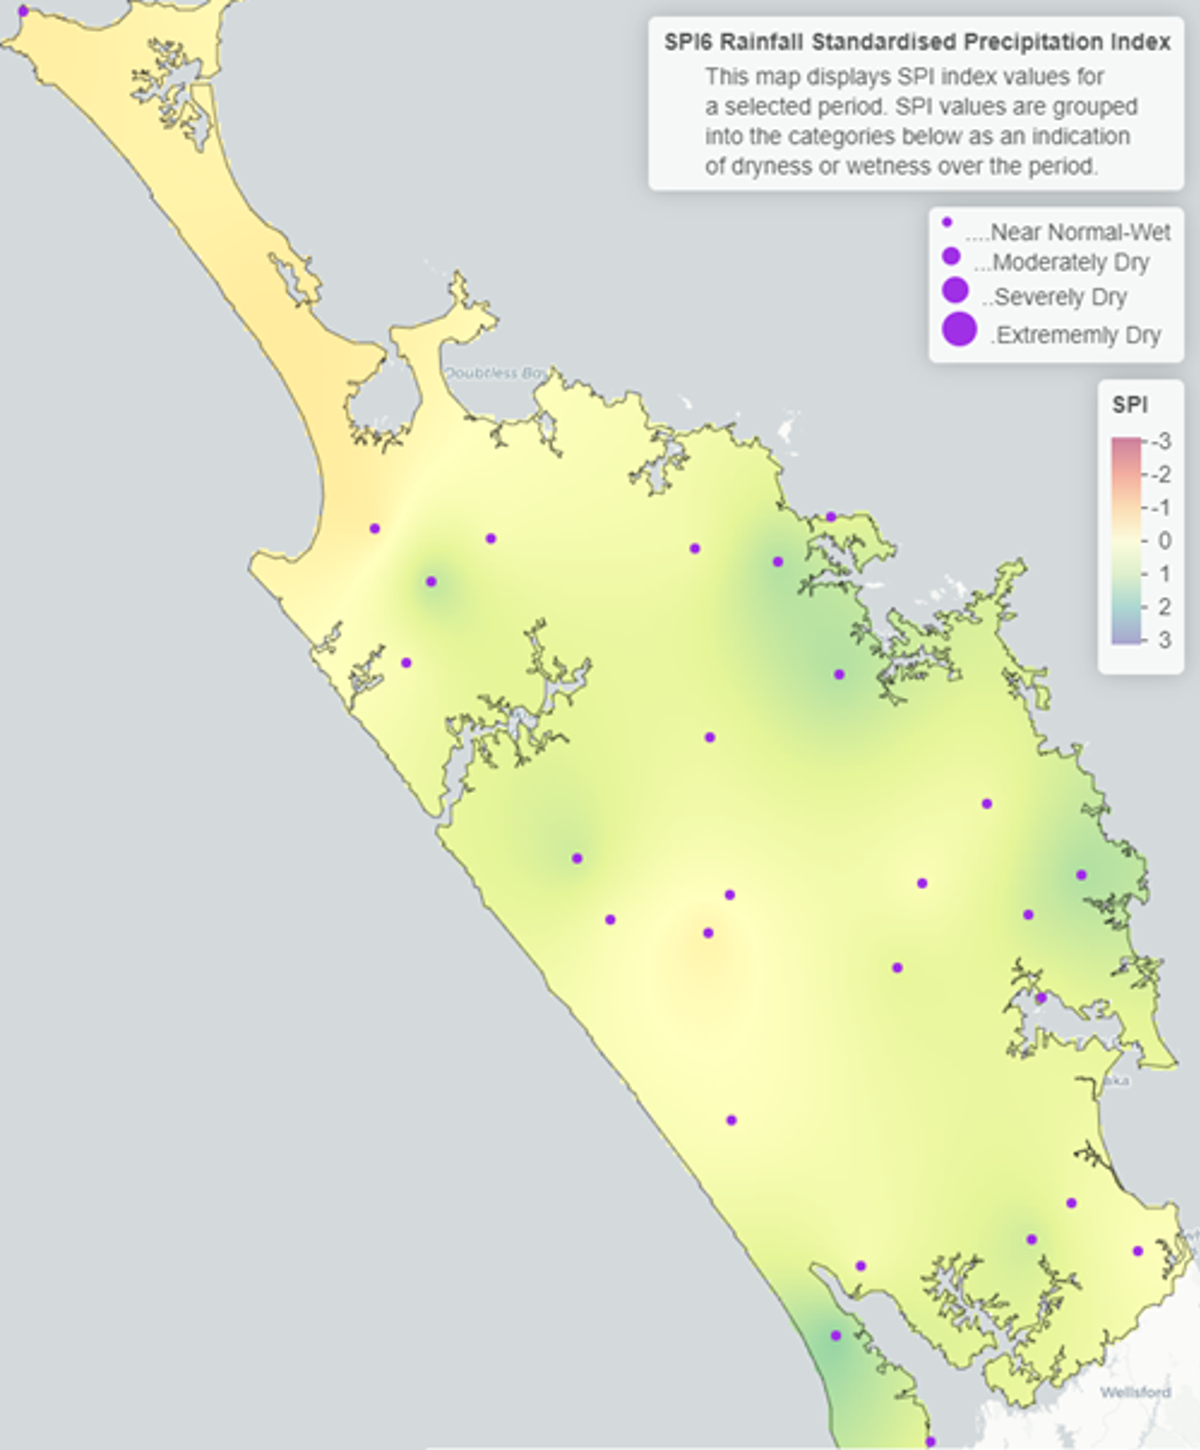


The 3-month standardised precipitation index (SPI 3) values for November 2021 – January 2022 reflect the drier conditions observed in December and January. Most of Northland shows near normal conditions over the three-month period, but scattered areas along the west coast, around Whangārei and to the south show moderately dry conditions. The 6-month standardised precipitation index (SIP 6) shows near normal to wet conditions from July 2021 – January 2022.
The values for the rainfall deficit for the previous periods from the end of January are shown in the table below, with all sites showing lower than normal rainfall ranging between -36 and -77 on a 1-month scale, this pattern is continued on the 3-month scale with all sites means being in a deficit. However, on a 6 – 12-month scale majority of sites across Northland show a greater than expected or near average rainfall for the respective period.
Rainfall deficit values (mm)
| Site | End date | 1 Month | 3 Months | 6 Months | 12 Months |
| Kaitaia Ews | January 2021 | -65.21 | 107.82 | -46.30 | -110.73 |
| Kerikeri Ews | January2021 | -39.41 | 63.66 | 237.09 | 278.41 |
| Kaikohe Aws | January2021 | -76.52 | 116.32 | 69.80 | -69.91 |
| Whangārei Aero Aws | January2021 | -67.40 | -138.35 | 79.87 | -7.13 |
| Dargaville 2 Ews | January2021 | -61.15 | -105.55 | -1.13 | -207.10 |
| Awaroa at Wallace Road | January2021 | -36.99 | -33.19 | 18.11 | -195.84 |
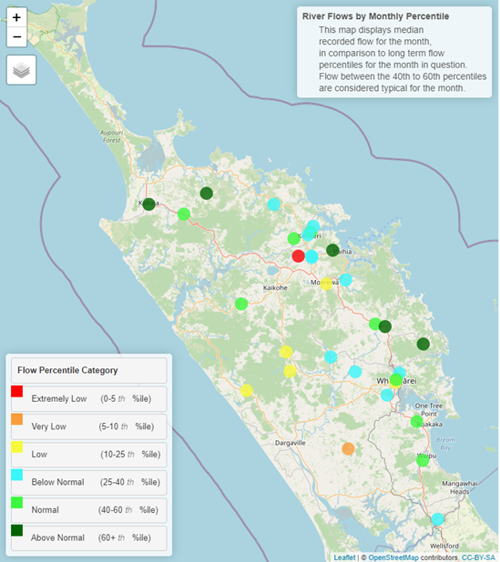
River flow
Across Northland, river catchments showed a large amount of variation in flow for January. Most of the Far North had either “Normal” or “Above Normal” flows, though further south in the region on the east coast, we see either “Normal” or “Below Normal” flows, while on the west coast most catchments are “Low”.
Flow map for January 2022
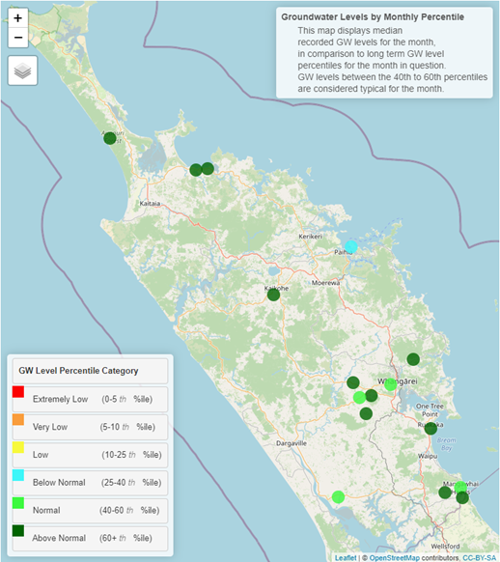
Groundwater
Groundwater levels were mostly “Above Normal” or “Normal” in January throughout Northland. The only site that is lower than normal is Russell. Groundwater generally remains elevated following a wet winter and spring. See table and map below.
Northland aquifer status table for January 2022
| Groundwater systems | Status | Percentile |
| Aupōuri | Above normal | 60th+ |
| Taipā | Above normal | 60th+ |
| Russell | Below normal | 25-40th |
| Kaikohe | Above normal | 60th+ |
| Poroti | Above normal | 60th+ |
| Whangārei | Normal | 40-60th |
| Mangawhai | Normal | 40-60th |
| Marsden - Ruakākā | Above normal | 60th+ |
| Ruawai | Normal | 40-60th |
Northland aquifer status map for January 2022
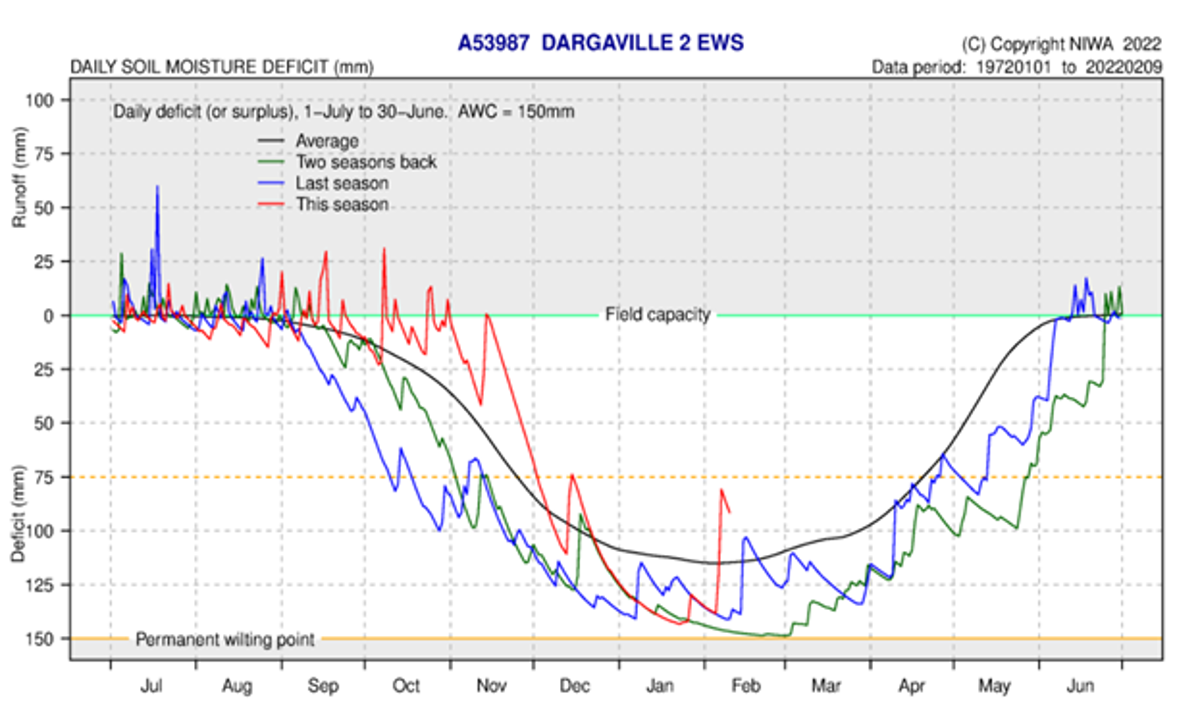
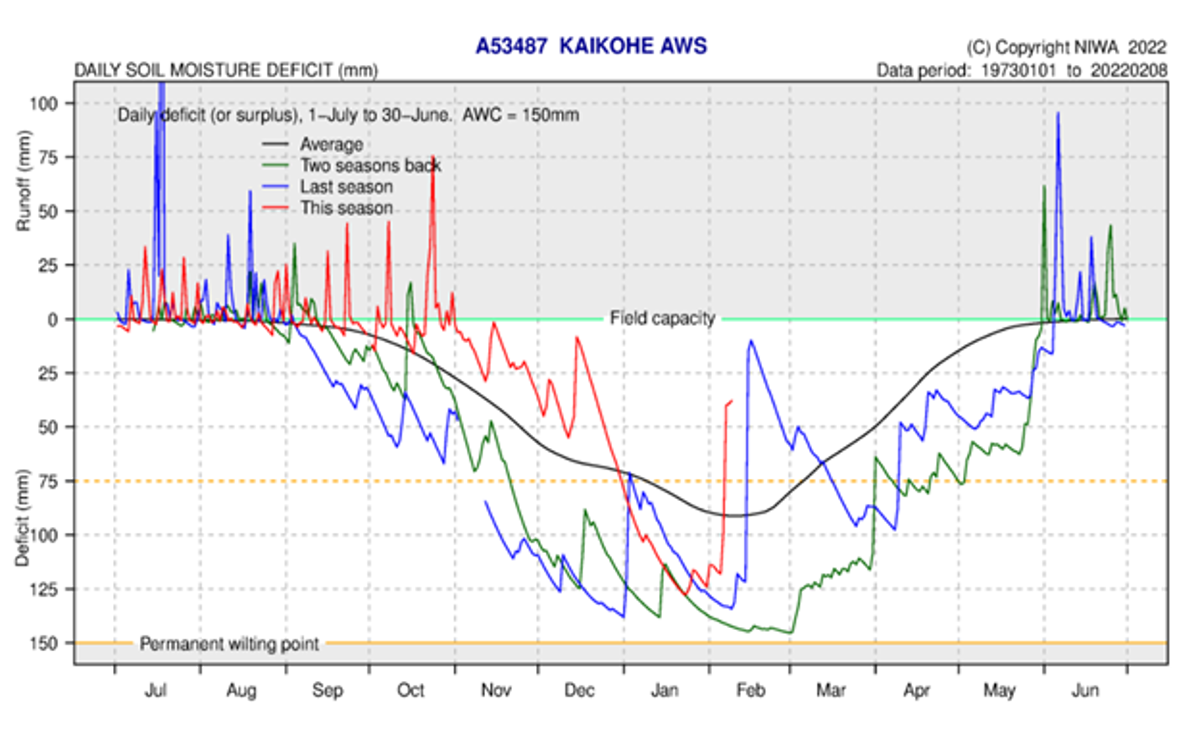
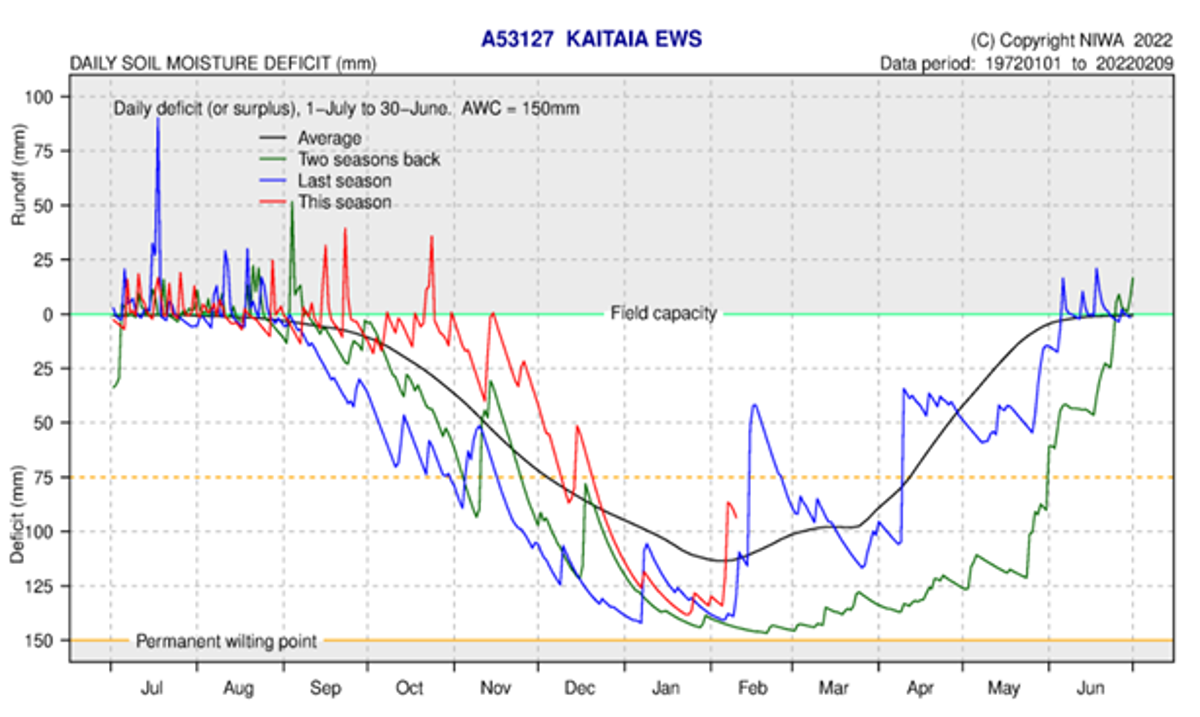
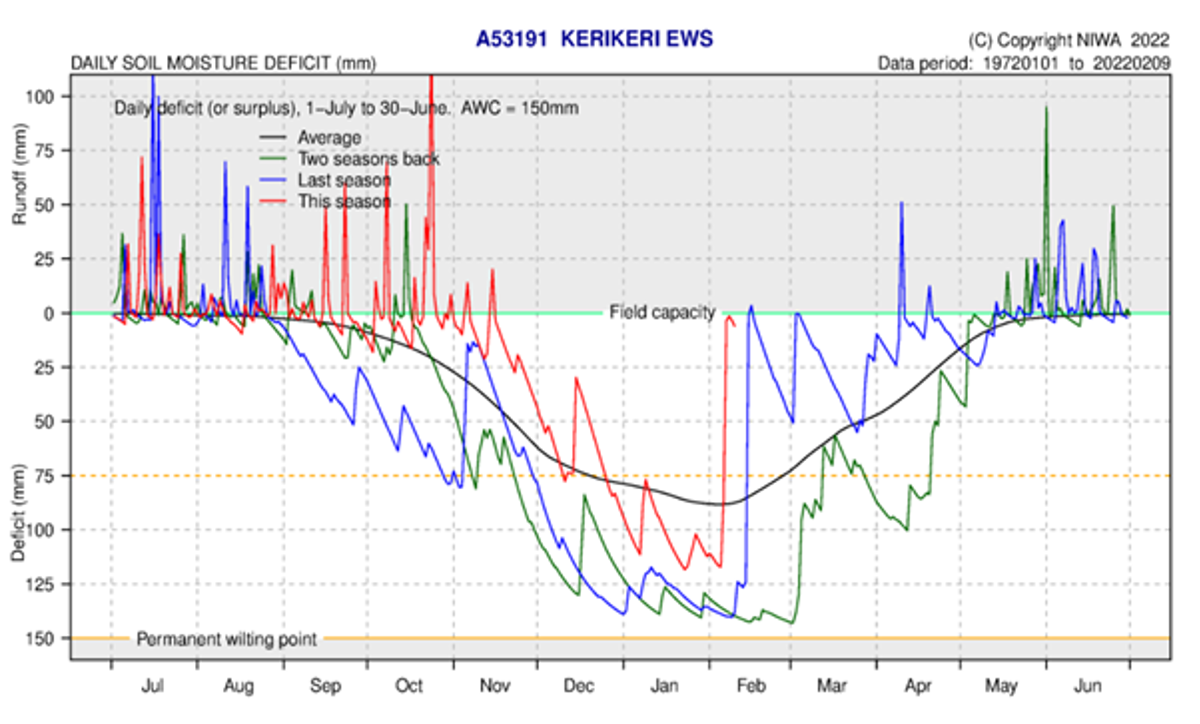
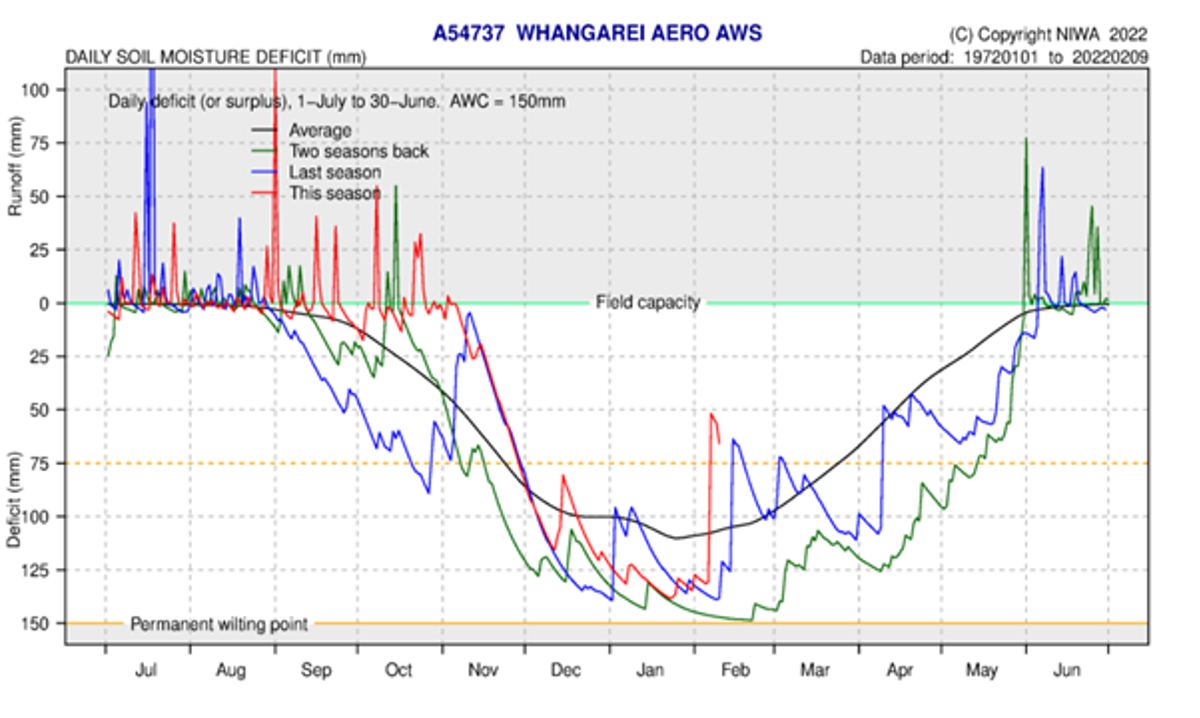
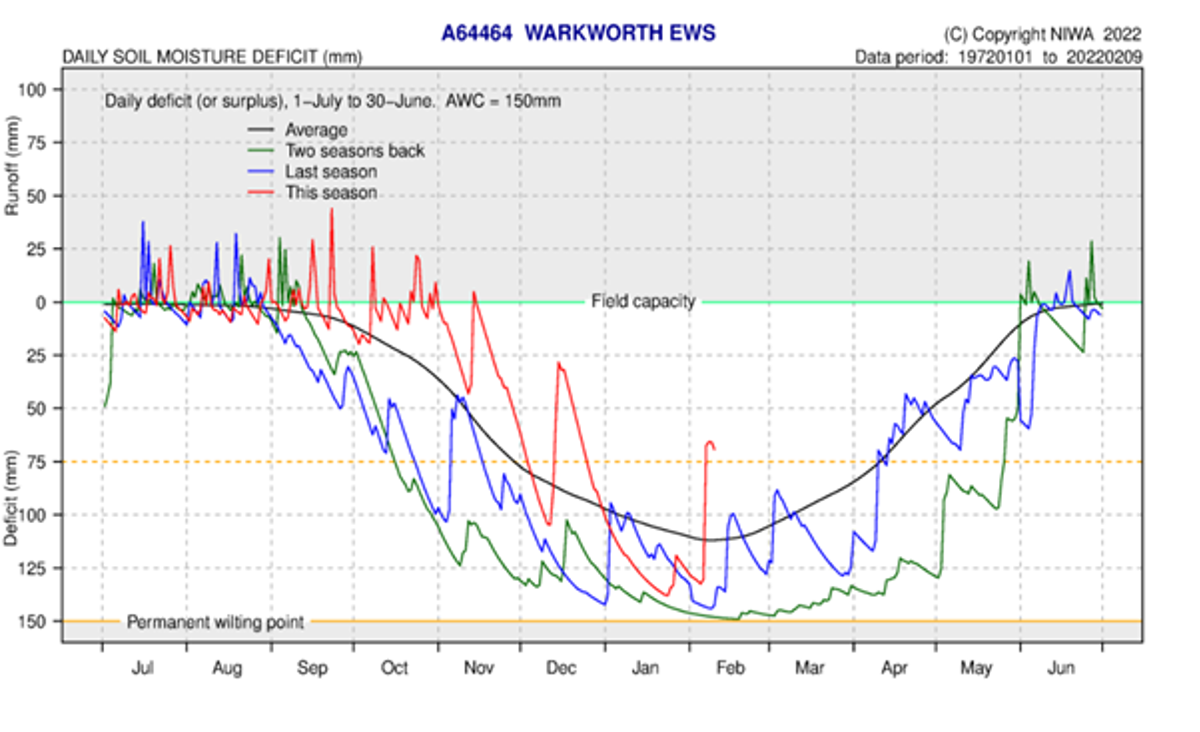
Soil moisture deficits
Soil moisture conditions for most of January 2022 were below average for this typically dry month, meaning that there was little available water for plants, which may have shown signs of distress. For January, all areas remained below the January average for soil moisture and had lower or similar soil moisture levels compared to last season across Northland, except for Kerikeri. Thankfully, Soil moisture levels have received some reprieve from rainfall in in early February.
With all sites below field capacity this indicating that minor rainfall events are not likely to cause any significant river runoff, which is the expected scenario for this time of the year. The soil moisture deficit is calculated based on incoming daily rainfall (mm), outgoing daily potential evapotranspiration (mm), and a fixed available water capacity (the amount of water in the soil 'reservoir' that plants can use) of 150 mm” (NIWA).