NRC Hydrology climate bulletin for May 2020
18 Jun 2020, 9:08 AM
Summary
May 2020 was tending towards a very dry month right up the very end when some decent rainfall fell along the east coast of the region with a Tasman low pressure system. This rainfall led to normal or above normal rainfall figures for the east of the region, while the west of the region missed out on this rain and remained drier than normal for the month.
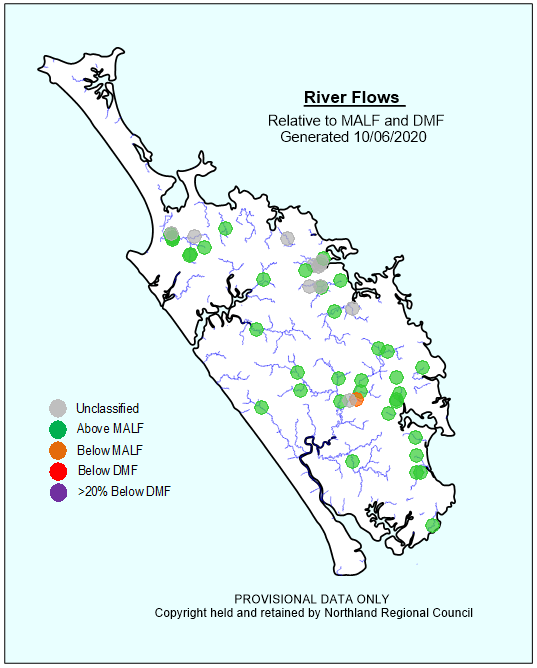
River flows for the month of May were below average for most areas, except the catchments that received high rainfall towards the end of the month (Kerikeri catchment, Northern Whangārei catchments and Hakaru catchment). Although monthly average river flows were below average in many catchments, the current flows in most rivers are now looking much healthier across the region following the Queen’s Birthday weekend rain and regular wintery showers. Flows appear to have stabilised consistently above MALF, with river base flows finally increasing.
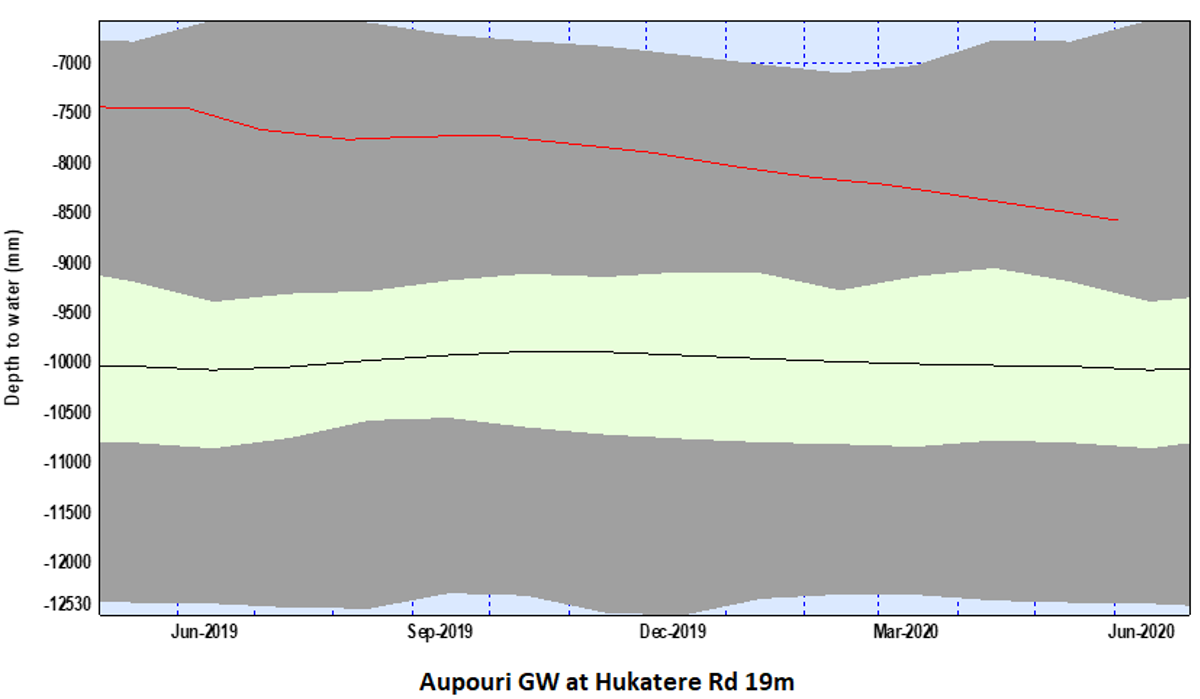
Soil moisture levels are at capacity for Kerikeri, Whangārei and Kaikohe, but a soil moisture deficit of -40 mm to -50 mm remains in Kaitaia and Dargaville. These areas received little rain during May, so were not bumped up to field capacity during the month like the other locations. Groundwater levels at most systems remain very low, below the 20th percentile for this time of year, but the Aupouri and Ruawai (after recent rain) aquifers appear ok.
Northland has had a very long run of months with predominantly below normal rainfall (since July 2018), and large rainfall deficits remain. Although the pressure on water supplies from rivers has lessened with recent rainfall, water storage and groundwater are still very low for this time of year. The forecast for the next quarter is for normal to below normal rainfall, so we need to be mindful that these long period dry conditions may persist as we move through winter and enter the dry months of summer once again.
Outlook
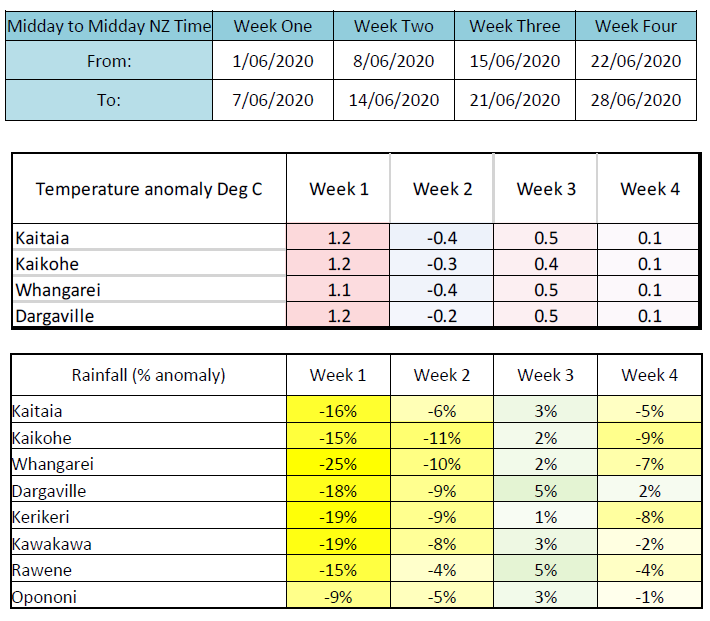
June:
Rainfall totals for June overall are predicted to be lower than normal. Week three from the 15th to the 21st may be the exception with wetter than normal conditions, but the other weeks through the month are forecast to be drier than normal.
June – August:
The long-term climate outlook from NIWA predicts near average or below average rainfall for the quarter. Soil moisture and river flows are predicted to be below average.
MetService June 2020 forecast
NIWA Temperature, Rainfall, Soil Moisture and River Flows probabilities for June to August 2020
| Temperature | Rainfall | Soil moisture | River flows | |
| Above average | 45• | 15 | 15 | 15 |
| Near average | 40 | 40 | 35 | 35 |
| Below average | 15 | 45• | 50• | 50• |
Rainfall
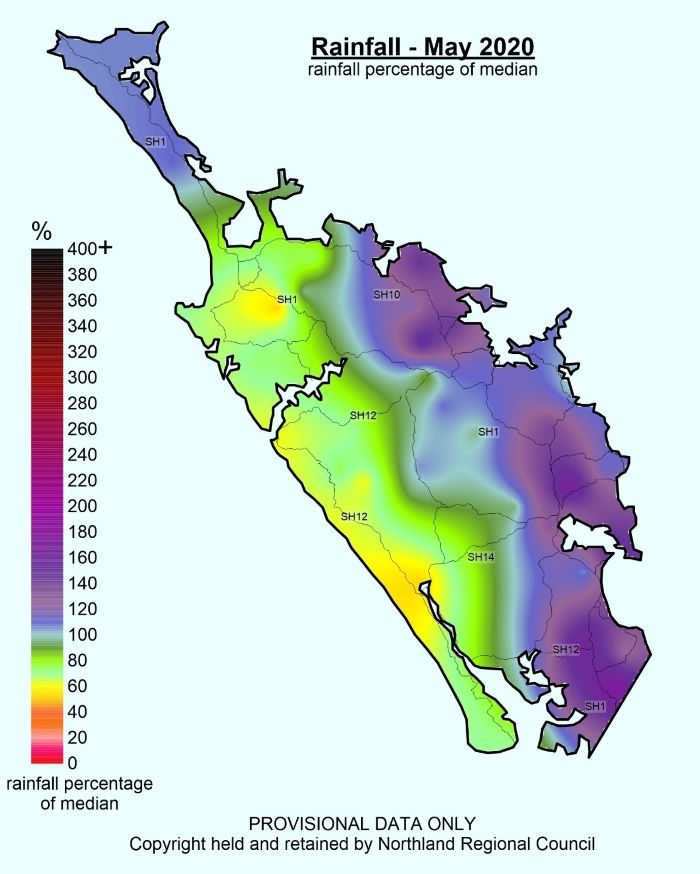
May 2020 was heading towards a very dry month, until the rain at the end of the month was received. At the end of the month there was a large contrast in rainfall from east to west during May, with the west coast receiving a lot less rainfall than typical for the month, while the east received near normal rainfall, and in some areas, much higher than normal rainfall. The areas with higher than normal rainfall are all due to the rainfall that fell during the Queen’s Birthday weekend rain event. This deep low system delivered some good rainfall to Maungaturoto (180mm), Glenbervie/Whakapara (150mm) and Touwai near Kaeo (130mm). Some very intense rainfall was recorded during this event, with provisional 1-hour totals at our Hakuru gauge equating to a 1:50 year event and at the Maungaturoto gauge, a 1:100 year event. The result was normal to above normal rainfall totals in the east and generally much lower than normal rainfall totals int the west.
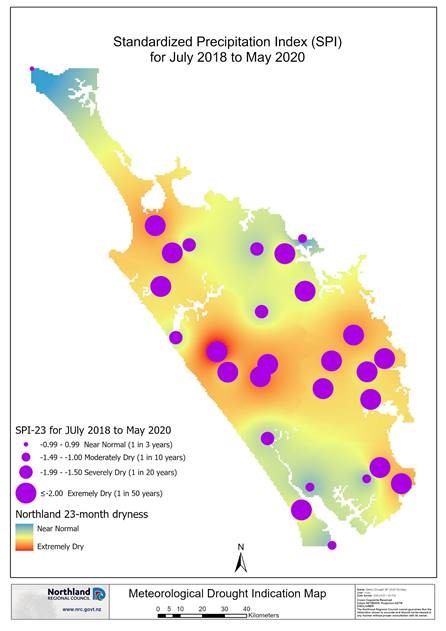
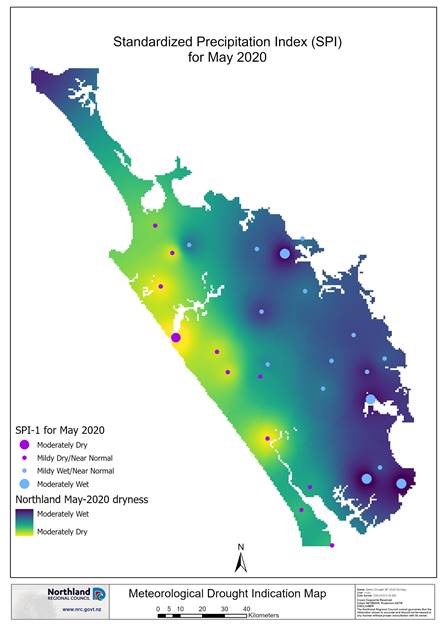
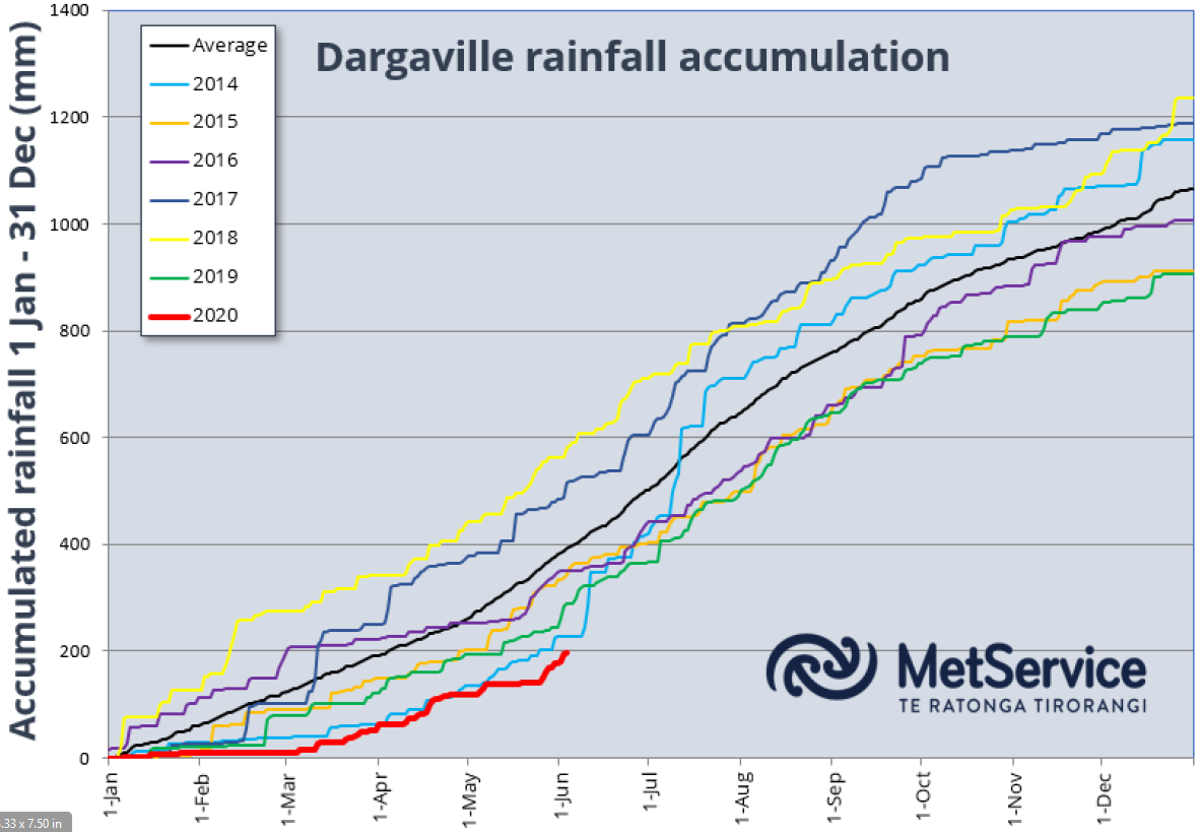
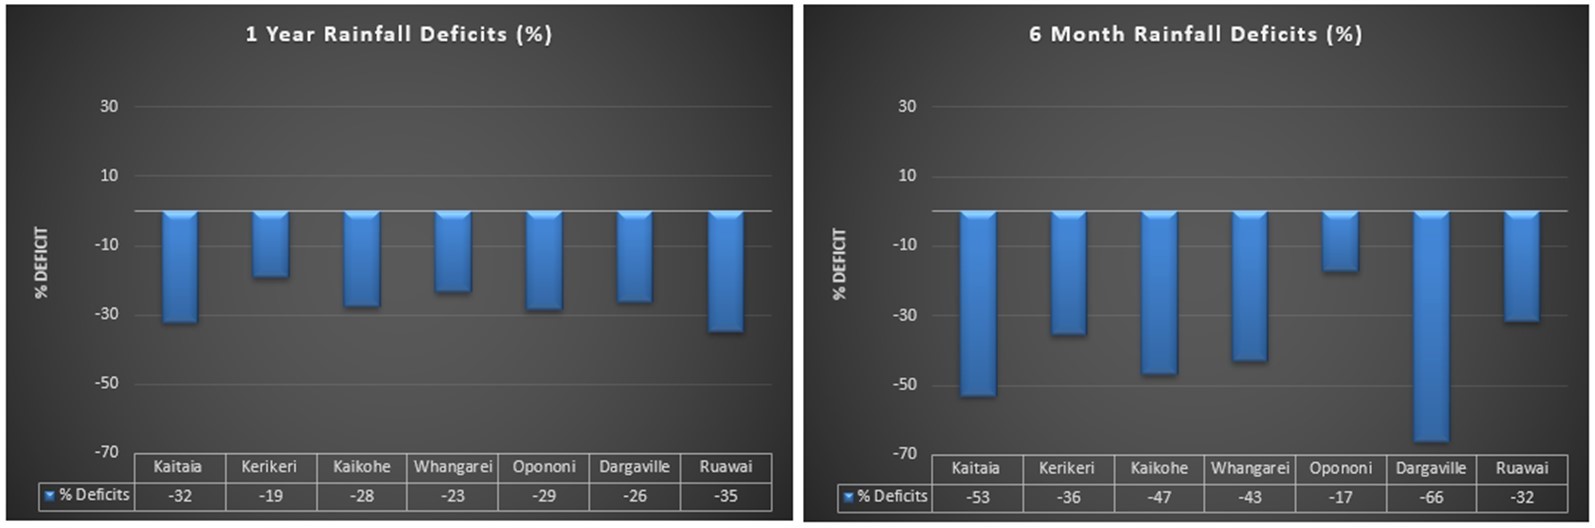
The NRC Standardised Precipitation Index rates the west coast as mildly to moderately dry, and the east coast as mildly to moderately wet for the month. Although parts of the region received some reasonable rainfall in May, a look at the long tern rainfall numbers tells us that we still need to be aware of persisting long term dry conditions. The SPI index for the period of dry conditions (which spans from July 2018 to now) paints the picture of an extremely dry region, as does the rainfall deficit figures, with rainfall deficit of around -30% throughout the region for the last 12 months and between -17 to -66% deficit for the last 6 months. Dargaville retains the highest 6-month deficit of -66%, with an extremely dry year so far.
Rainfall % median map for May 2020
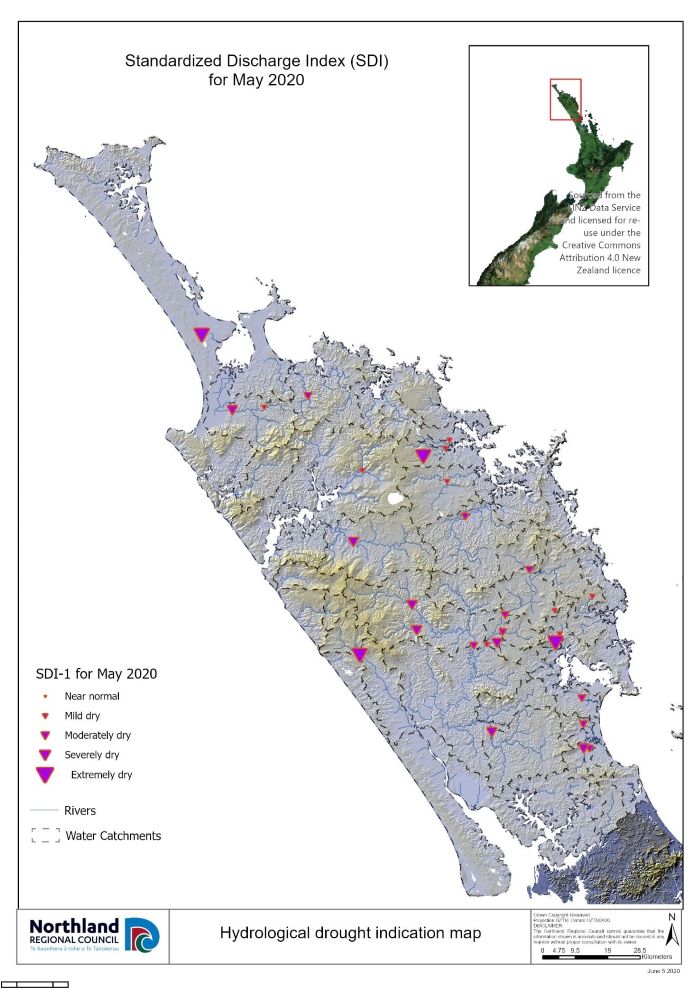
SPI Index map for the dry period, July 2018 to May 2020 and for the most recent month May 2020
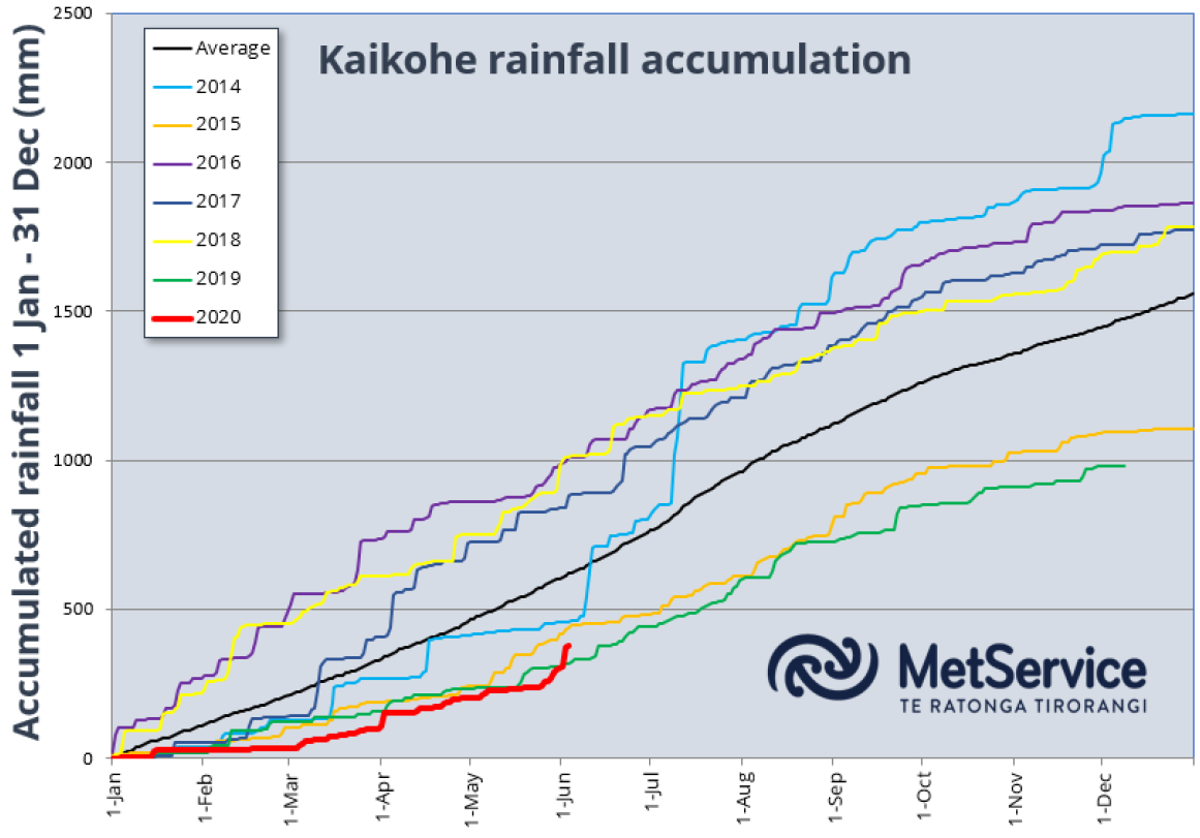
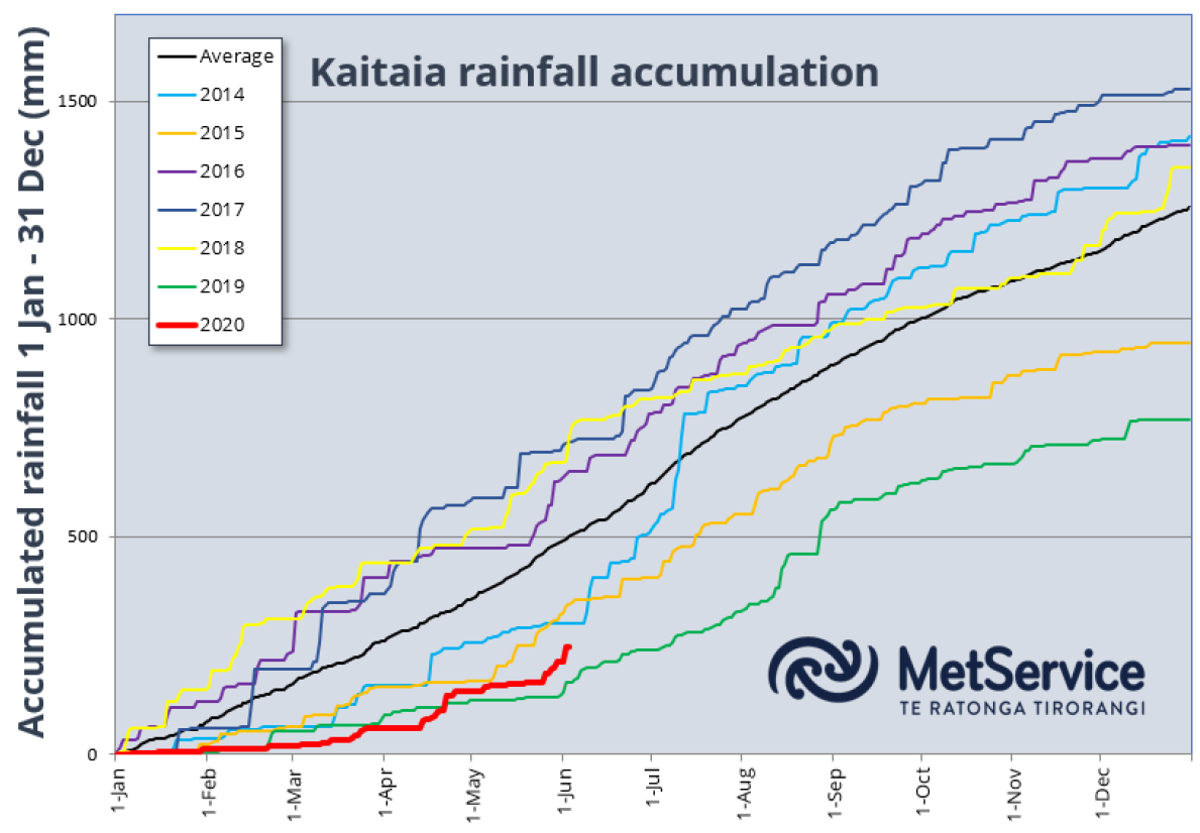
Accumulated rainfall


One year and six-month rainfall deficit percentage values
River flow
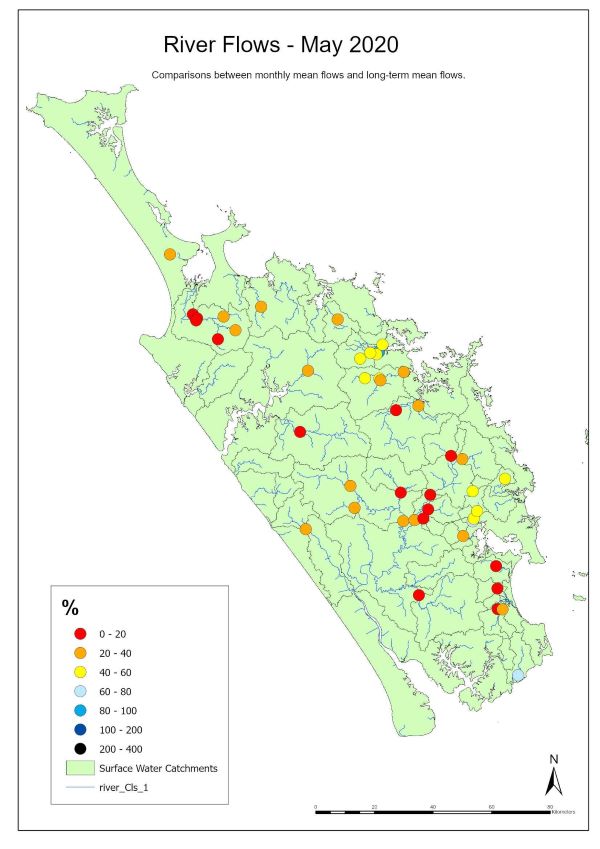
Rivers throughout the region were in low flow conditions, right up to the weather event at the end of the month. This weather event bumped up flows in all rivers, but especially on the east coast where the bulk of the rain fell. As a result, average monthly flow in some of the rivers on the east coast where near normal for the month overall, while rivers on the west remained lower than normal for the month. Although many rivers may still be lower than typical for this time of year, the Queen’s Birthday rainfall event combined with frequent showers means that most rivers are now consistently flowing above MALF.
Flow Map - May 2020
Current (10/6/2020) River Flows relative to Mean Annual Low Flow (MALF) and 1:5 year low flows (DMF)
Groundwater
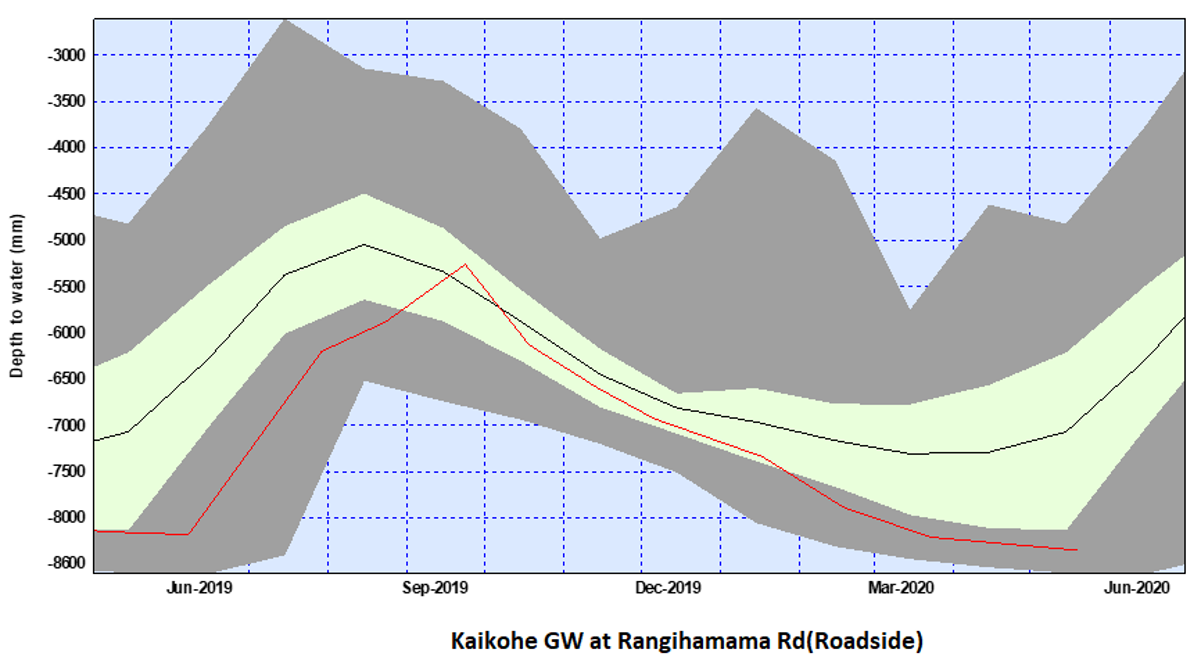
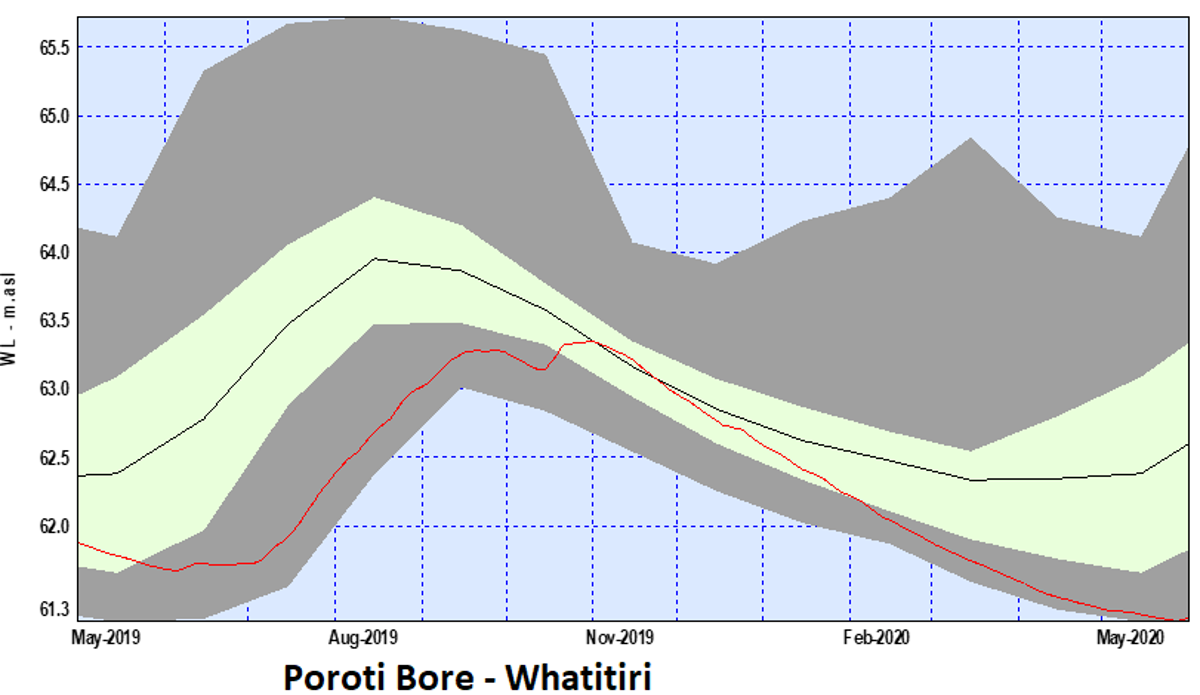
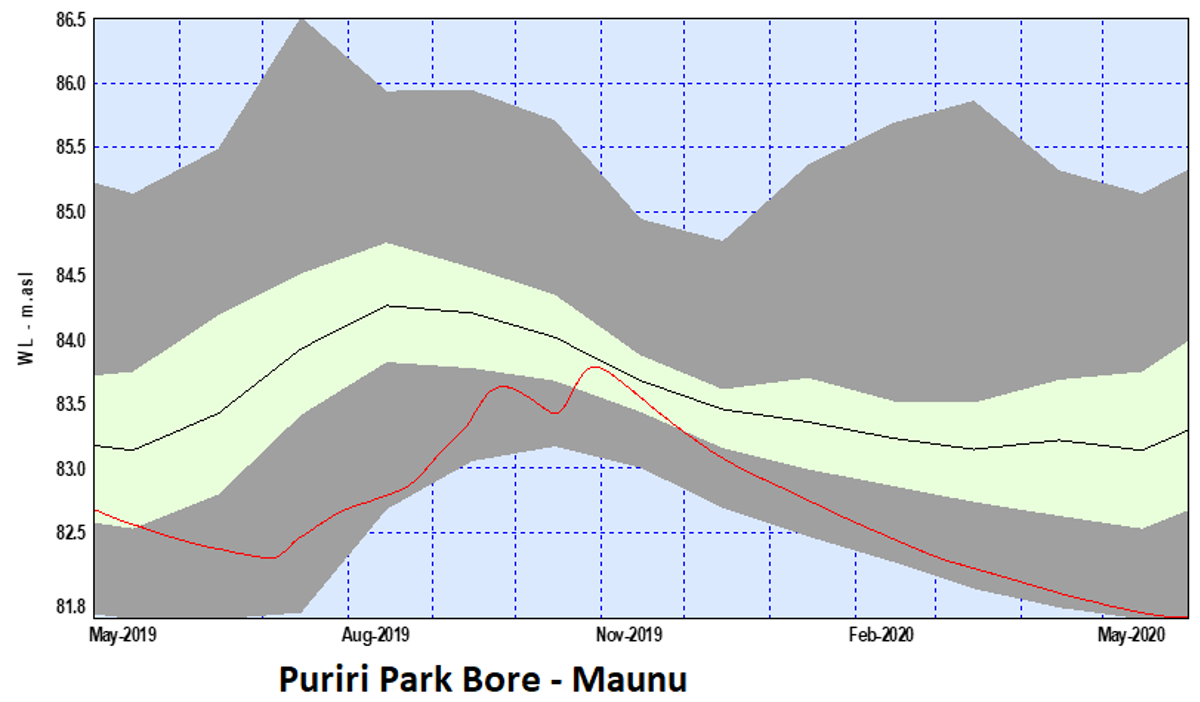
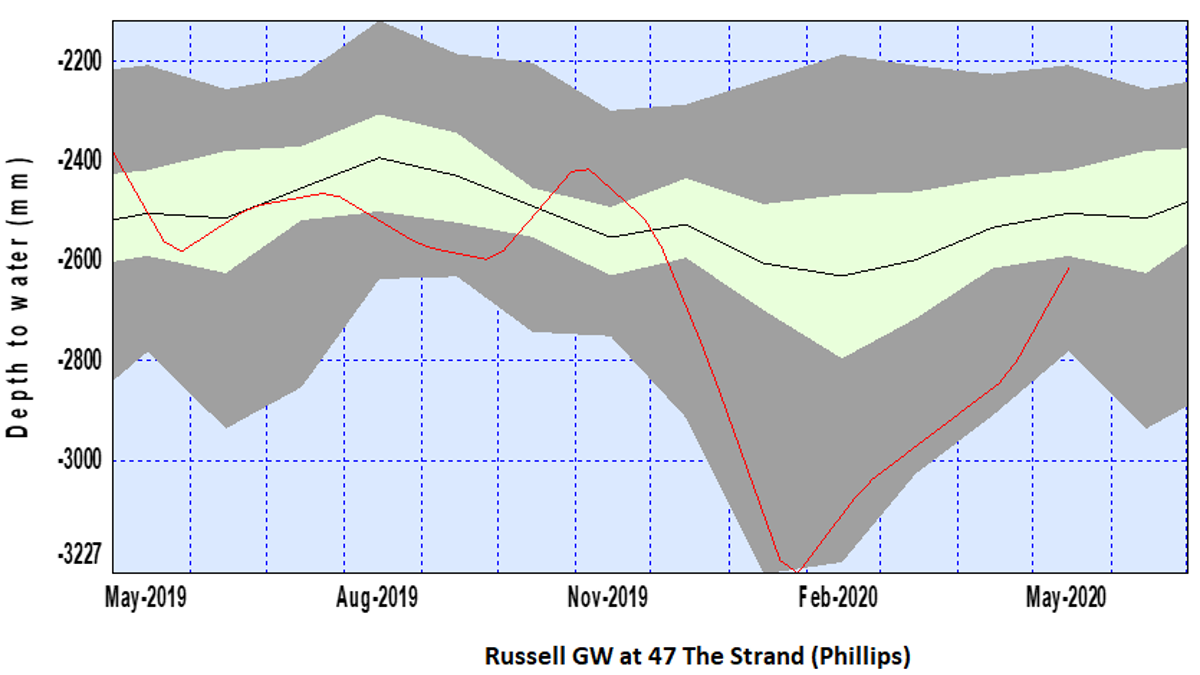
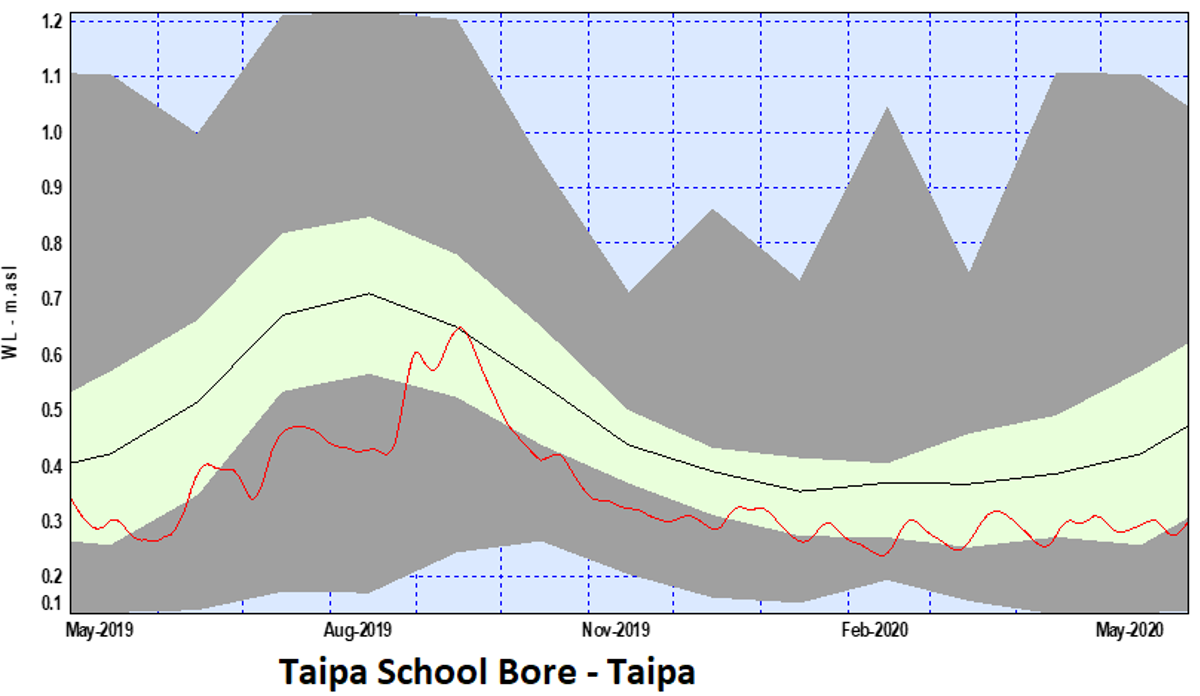
Water level readings indicate that all groundwater monitored systems except the Aupouri are below average for May 2020. The “One-year groundwater trend” plots below show that many of the systems are at or below 20th percentile levels. (note that the rainfall at the end of the month may have increase these levels in June, but this increase is not displayed here due to the monthly frequency of measurements).
|
Groundwater Systems |
Status for May 2020 |
|
Aupouri |
OK |
|
Taipa |
BELOW AVERAGE |
|
Russell |
BELOW AVERAGE |
|
Kaikohe |
BELOW AVERAGE |
|
Whangārei |
BELOW AVERAGE |
|
Marsden-Ruakaka |
BELOW AVERAGE |
|
Mangawhai |
BELOW AVERAGE |
|
Poroti |
BELOW AVERAGE |
One-year groundwater trends (red) relative to the long-term average (black) and upper and lower percentiles (bottom grey area denotes 0-20th percentiles)


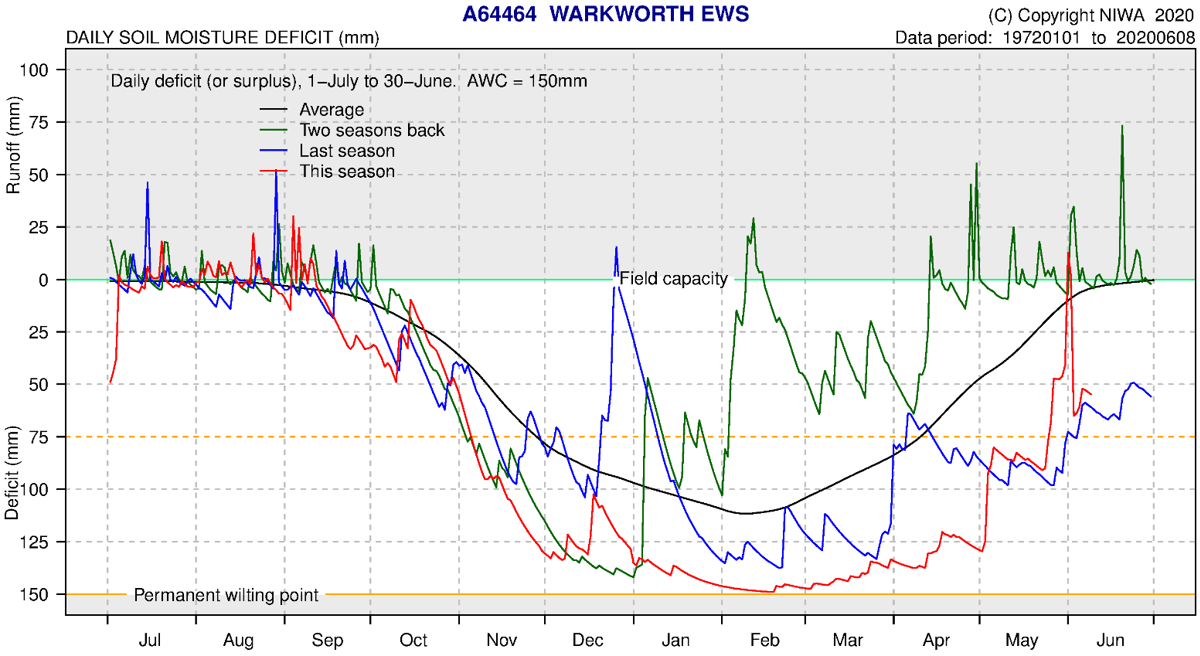
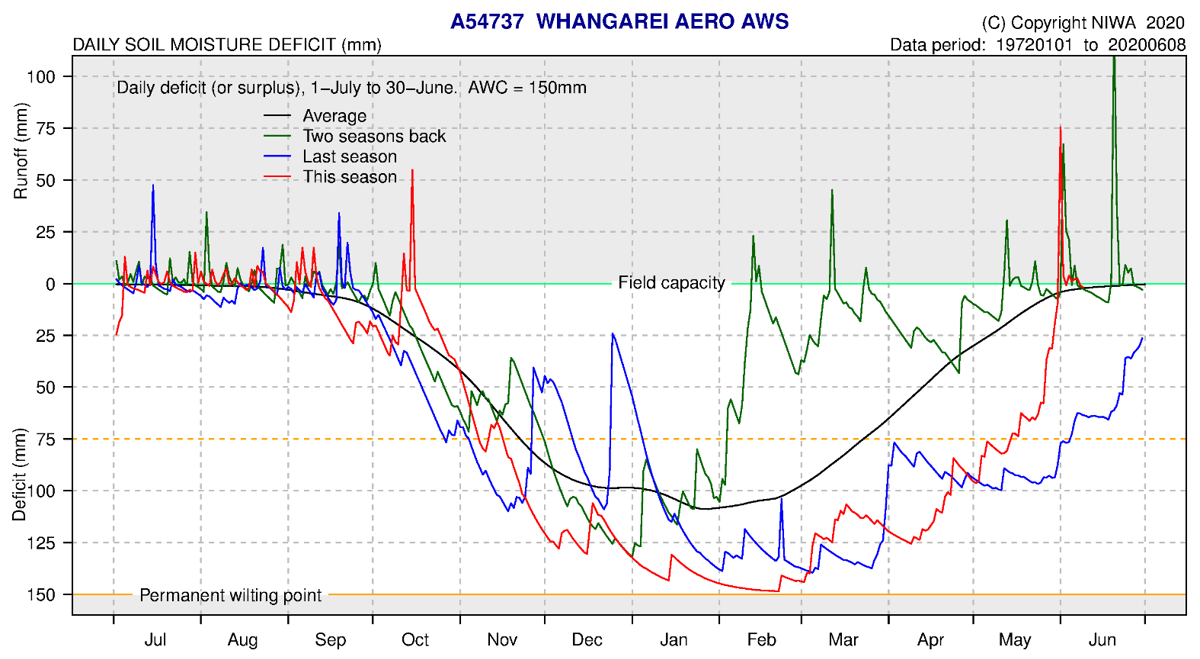
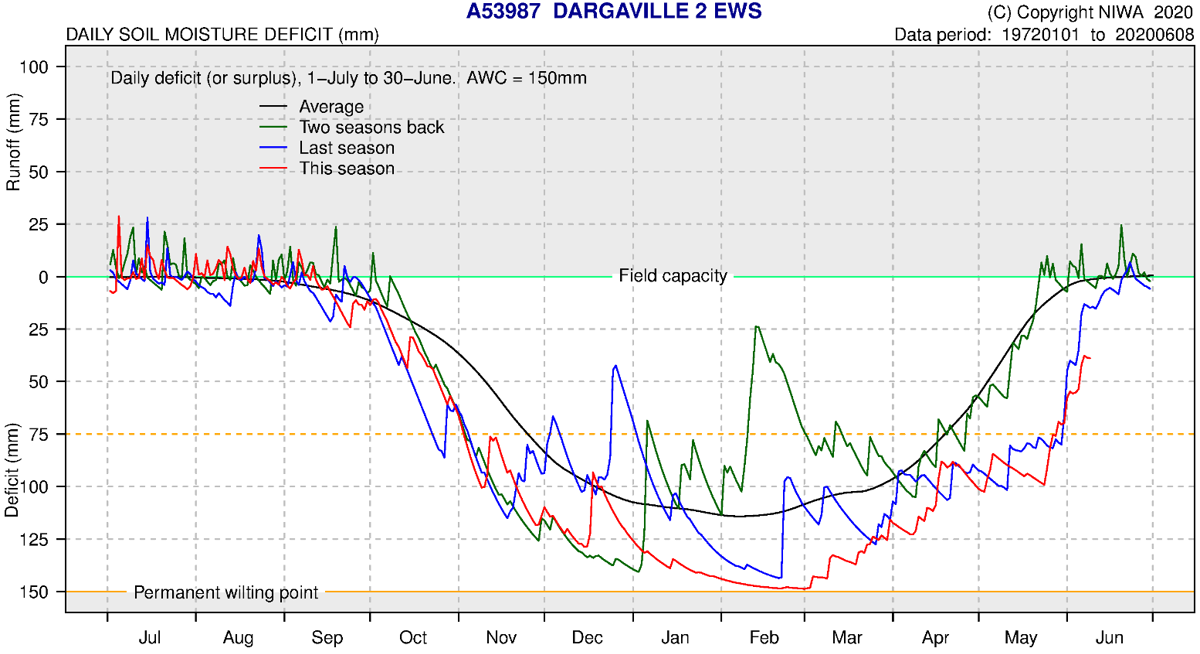
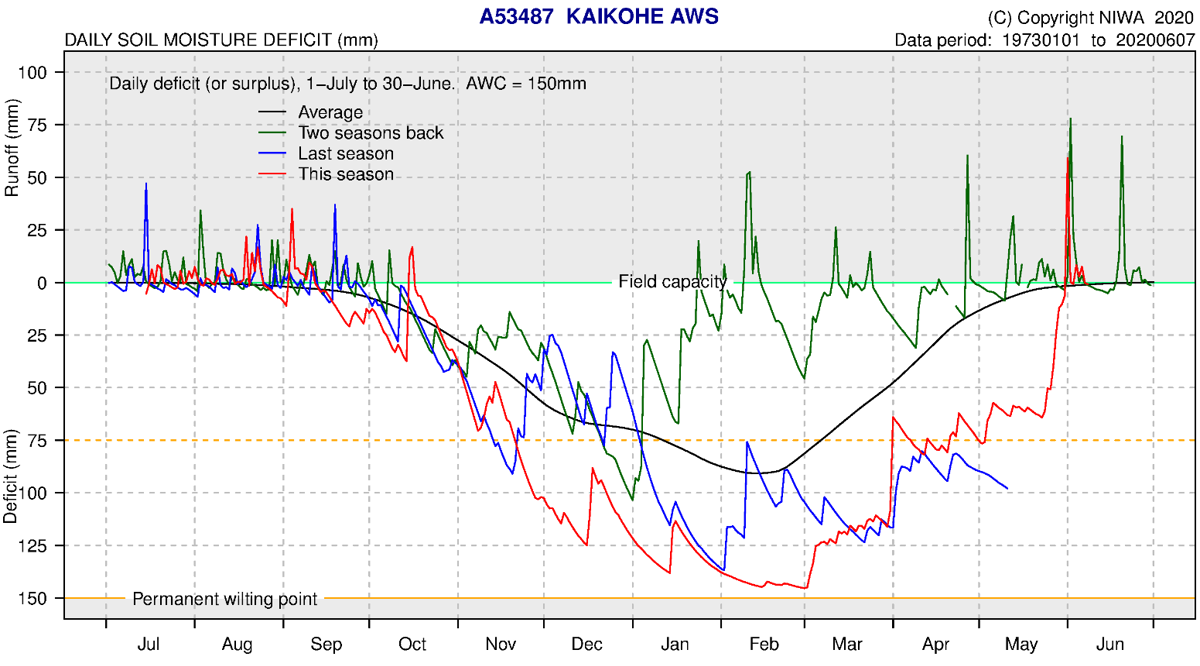
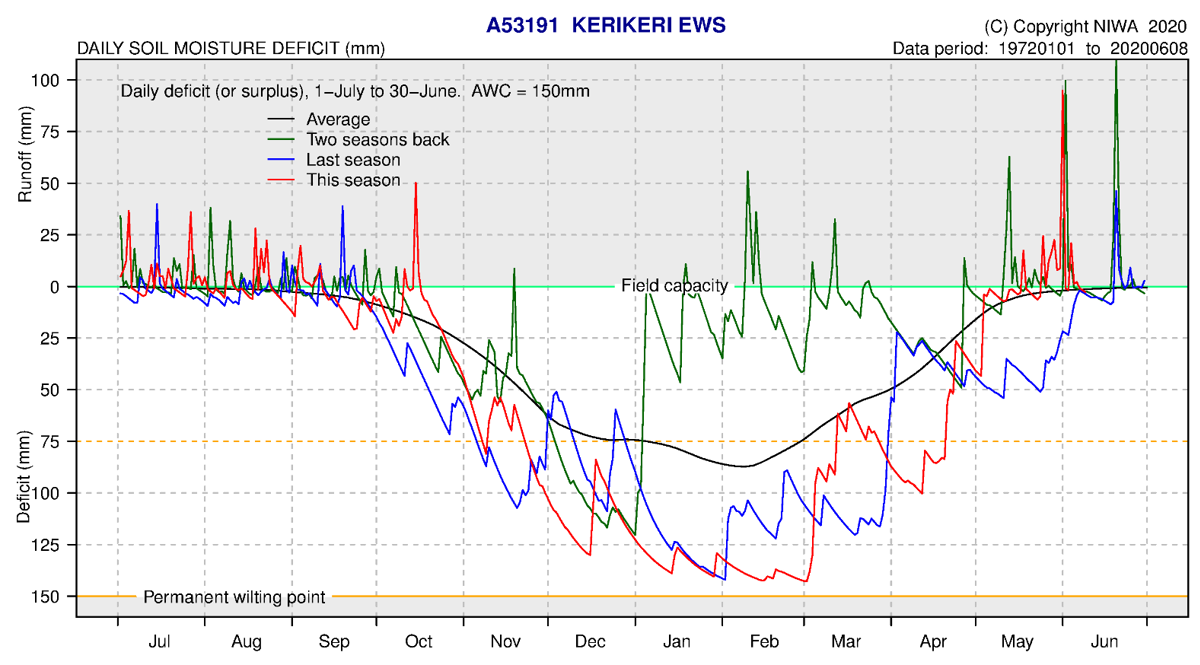
Soil moisture deficits
NIWA water balance modelling indicates soil moisture deficit is close to the average and at or just above field capacity for Kerikeri, Whangārei and Kaikohe, but -40mm to -50mm below field capacity in Kaitaia, Dargaville and Warkworth. Typically, all areas would be at field capacity at this time of year. “SMD is calculated based on incoming daily rainfall (mm), outgoing daily potential evapotranspiration (PET, mm), and a fixed available water capacity (the amount of water in the soil 'reservoir' that plants can use) of 150 mm” (NIWA).
Soil moisture deficit at NIWA climate stations
|
NIWA Climate Station |
Observed Soil moisture deficit (mm) as of 08/06/2020 |
Average April soil moisture deficit |
Difference between Expected and Average |
|
Kaitaia |
50 mm |
0 mm |
-50 |
|
Kerikeri |
0 mm |
0 mm |
0 |
| Whangārei |
0 mm |
0 mm |
0 |
|
Kaikohe |
0 mm |
0 mm |
0 |
|
Dargaville |
40 mm |
0 mm |
-40 |
|
Warkworth |
50 mm |
0 mm |
-50 |