February 2024 climate report
6 Mar 2024, 5:00 PM
Summary
- El Niño Southern Oscillation (ENSO) conditions are expected to start declining through autumn.
- Temperatures for the coming months are likely to be “above average", while rainfall is likely to be “near average” or “below average”.
- Rainfall in Northland during February was below average, with only 40% of the regional average recorded.
- Standardised rainfall on a three-month scale shows “moderate dryness” around Northland.
- River flows in February are varied, but most Northland catchments are either “below normal” or “low”.
- Most aquifers are “normal “or better, except for: Ruawai and Kaikohe which are “below normal”, while Russell is “very low”.
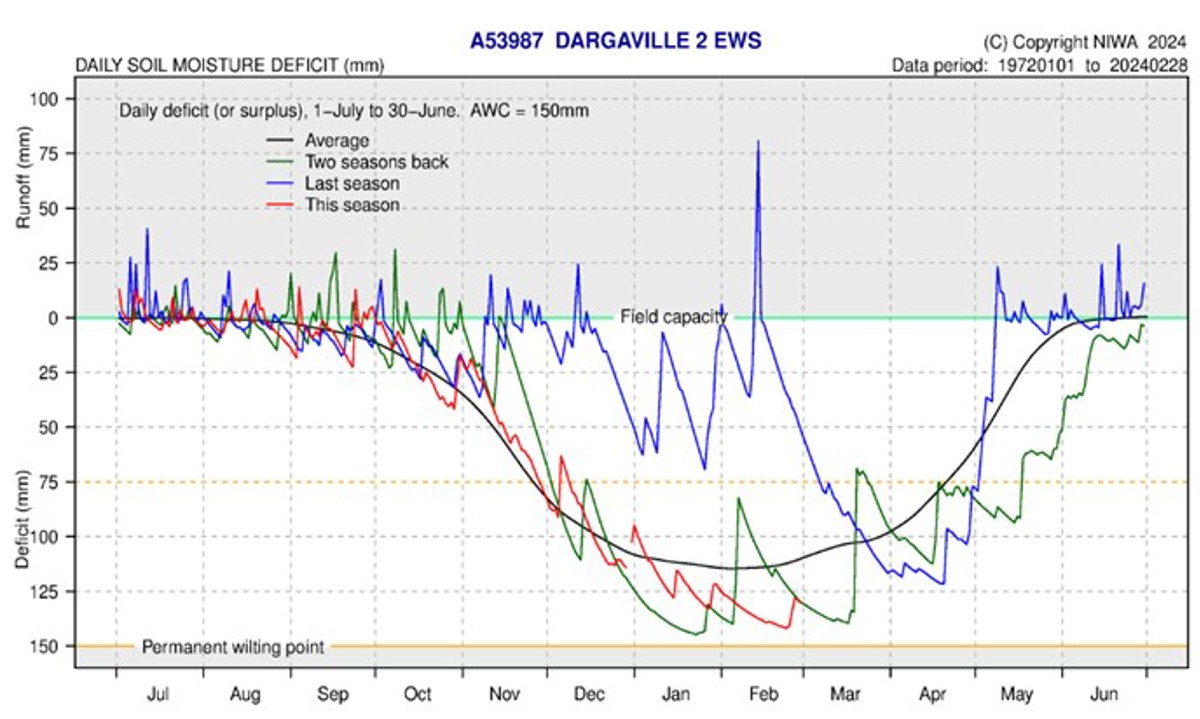
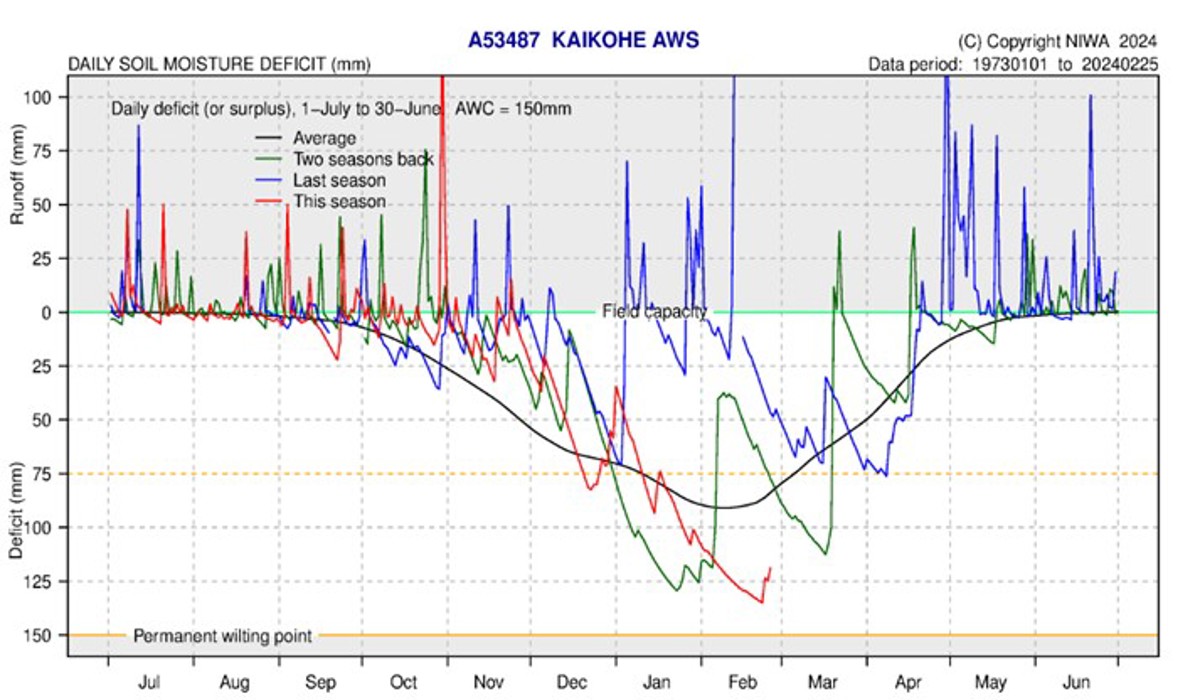
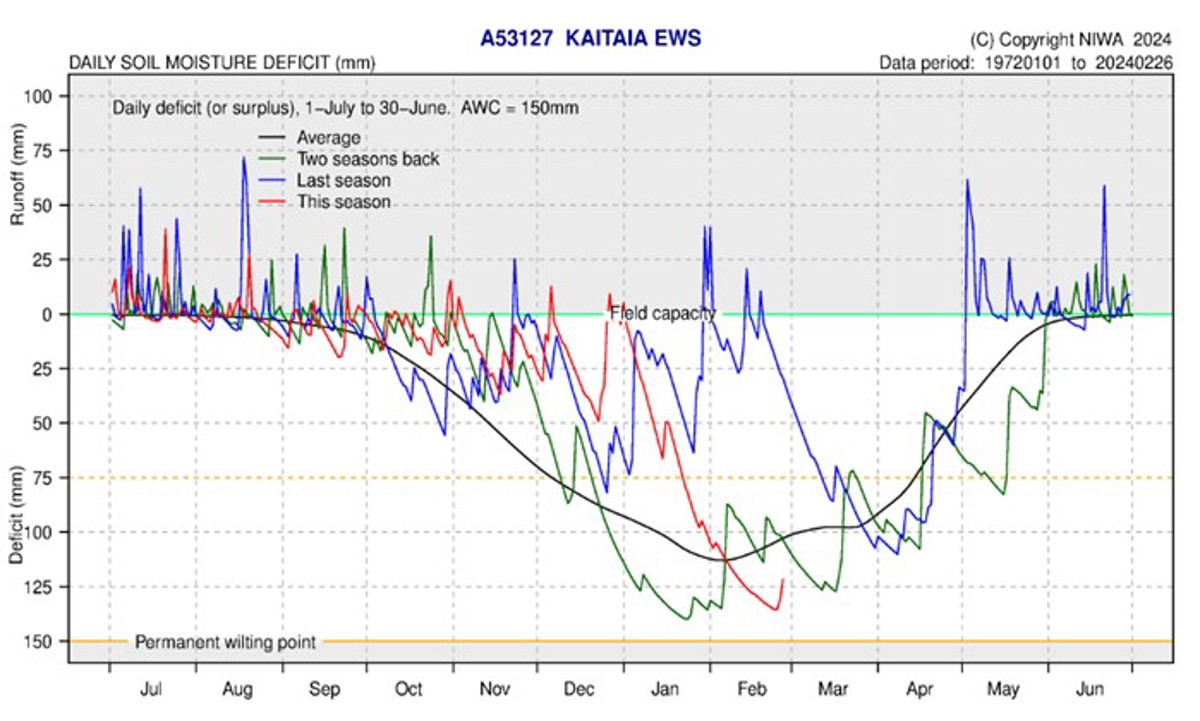
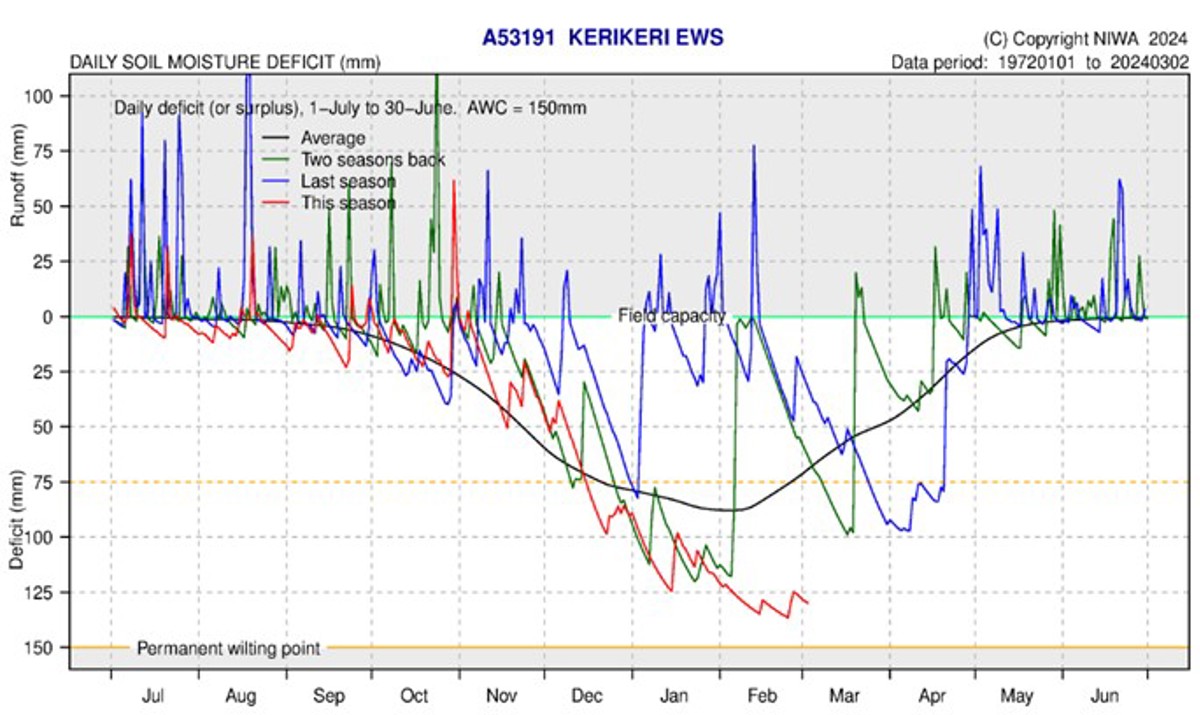
- Soil moisture across the region has a deficit greater than 75 mm, meaning that there is no “available water” for plants, and some temporary wilting is likely to be occurring.
Climate Outlook for March to May 2024
During autumn, El Niño is expected to ease and enter neutral conditions. The Madden-Julian Oscillation is expected to pass from the Indian Ocean into the Pacific Ocean during March, historically this movement brings wetter conditions to Northland. Between March – May the active climate drivers are expected to result in “above average” temperatures in Northland, “Near Average” or “Below average” rainfall and river flows, and “below average” soil moisture. Winds will continue to be dominantly from the northwest.
For more details, please refer to NIWA’s seasonal climate outlook for March - May 2024:
NIWA Temperature, Rainfall, Soil Moisture and River Flows probabilities for the period of March to May 2024
(Expressed as % likelihood for either Above Average, Near Average or Below Average conditions).
| Temperature | Rainfall | Soil moisture | River flows | |
| Above average | 55• | 25 | 10 | 15 |
| Near average | 40 | 40• | 40• | 40• |
| Below average | 05 | 35• | 50• | 45• |
The drought forecasting tool (NIWA35) for March predicts no “very dry” – “metrological drought” conditions following the New Zealand Drought Index model (NZDI) which combines rainfall, soil moisture and evapotranspiration. Rainfall conditions are expected to be “normal” in most areas of Northland. This tool can be accessed, and rerun daily at: shiny.niwa.co.nz/drought-forecast
NIWA35 Rainfall anomaly model for 1 March 2024 – 4 April 2024
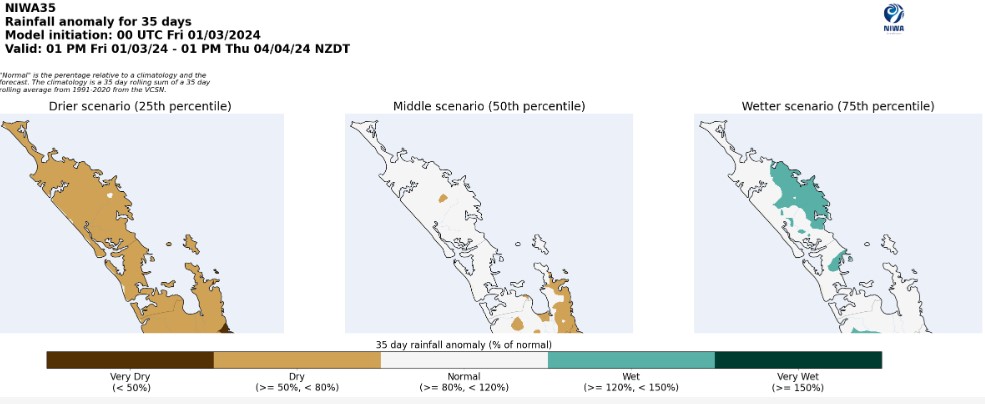
NIWA35 Rainfall anomaly model for 1 March 2024 – 4 April 2024.
Rainfall
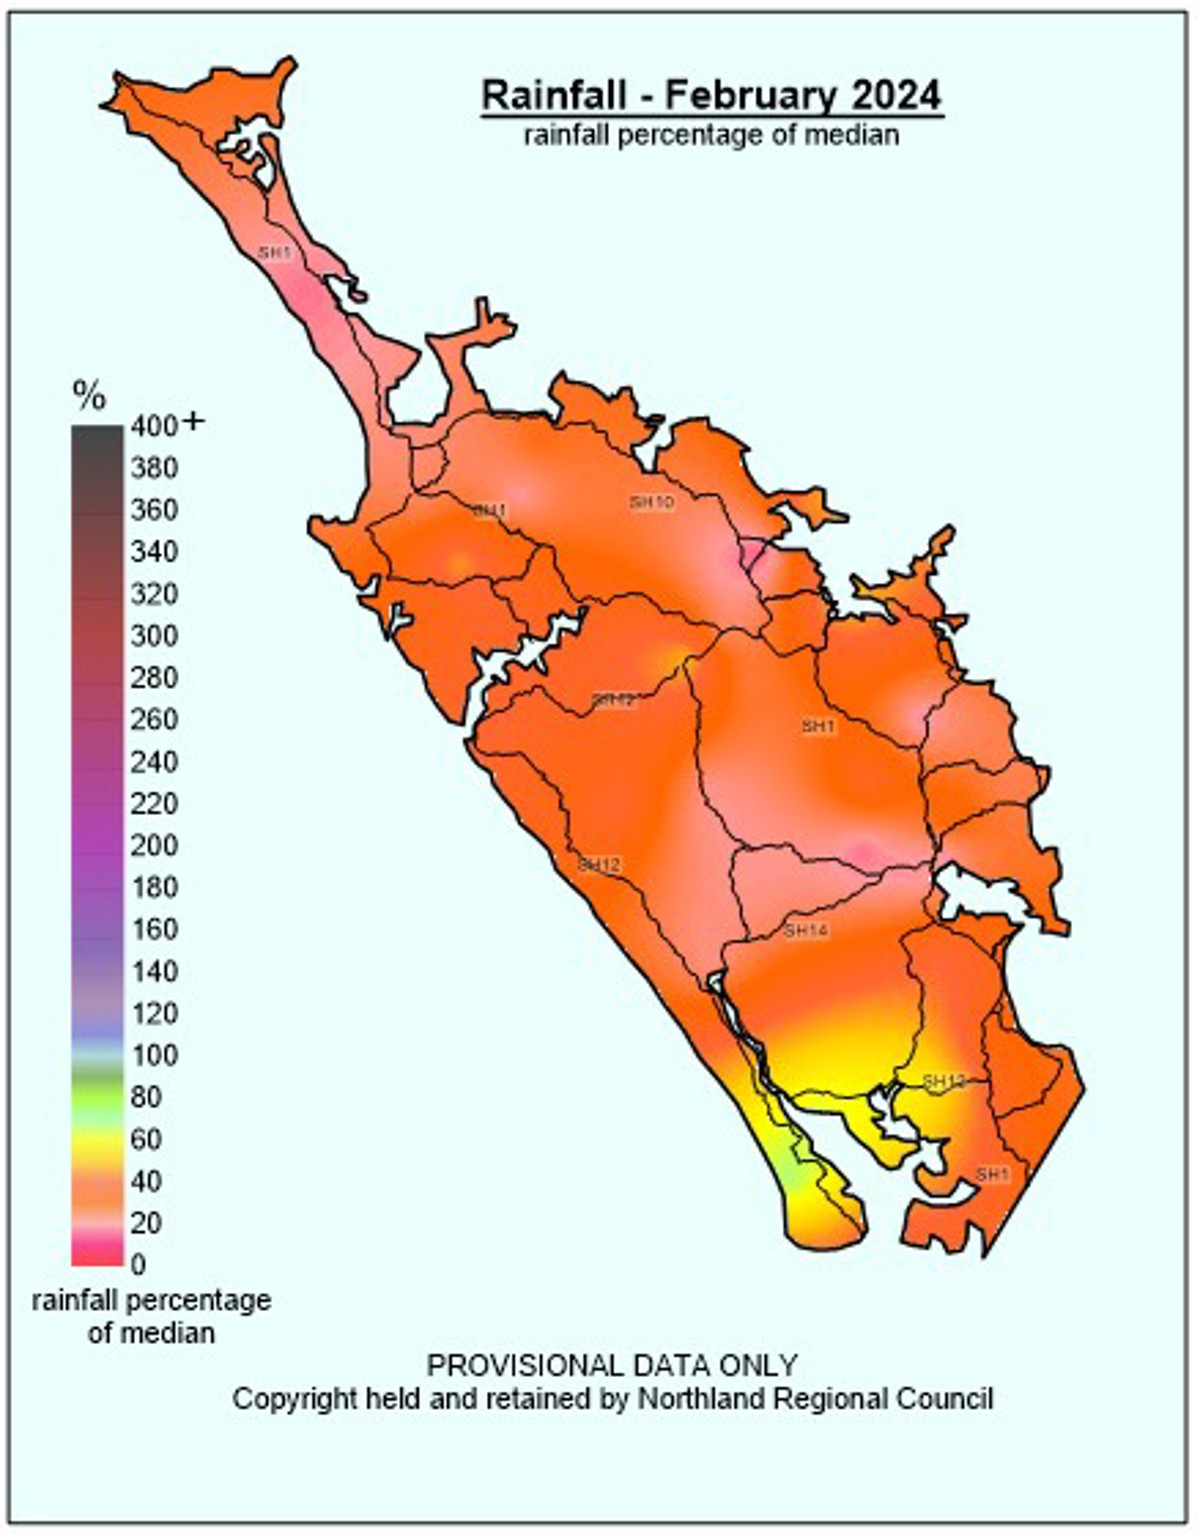
During February the El Niño effect strongly effected Northland, bringing hot dry conditions with the dominant winds and rain being from the west. Overall Northland was much dryer than average, receiving approximately 40% of what the expected, which translates to just over 20mm. The highest rainfall total was 44mm at Waimamaku (South Hokianga), while the lowest was Waihopo with 11.5 mm. The driest areas, compared to each sites’ median, were Kerikeri 16%, followed by Poroti (inland from Whangārei) and Waihopo on the Aupōuri Peninsula, both with 18%. While the highest percentages were in the southwest, with midway on the Poutō Peninsula having the highest expected percentage of 68%, followed by Ruawai with 62%.
Rainfall (% of Median) for February 2024 across Northland with a range of 16% to 68%

Standardised Precipitation index (SPI)
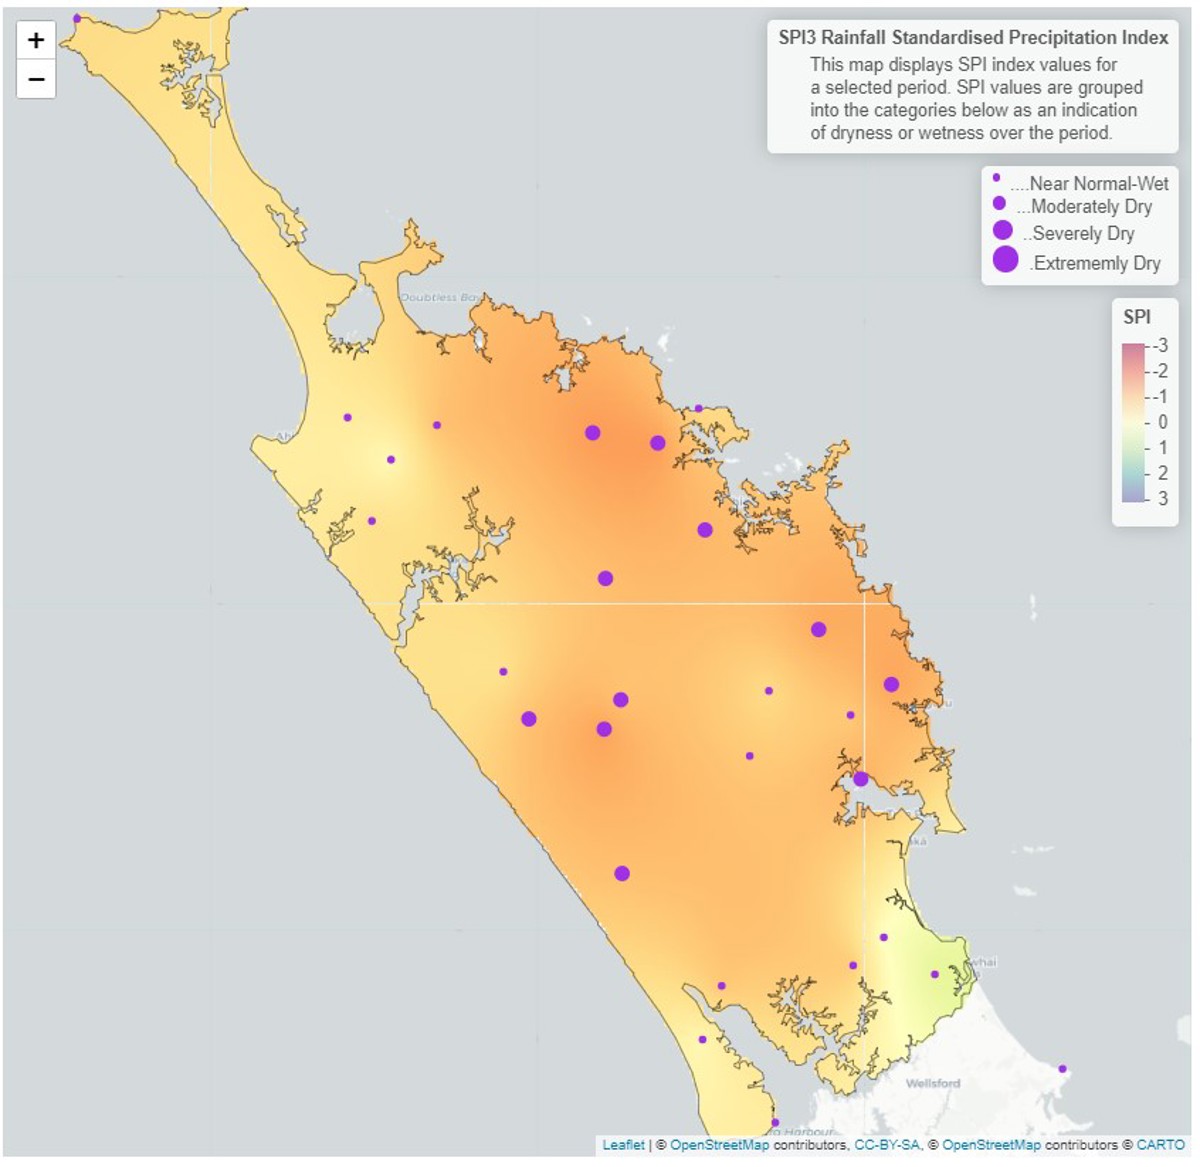
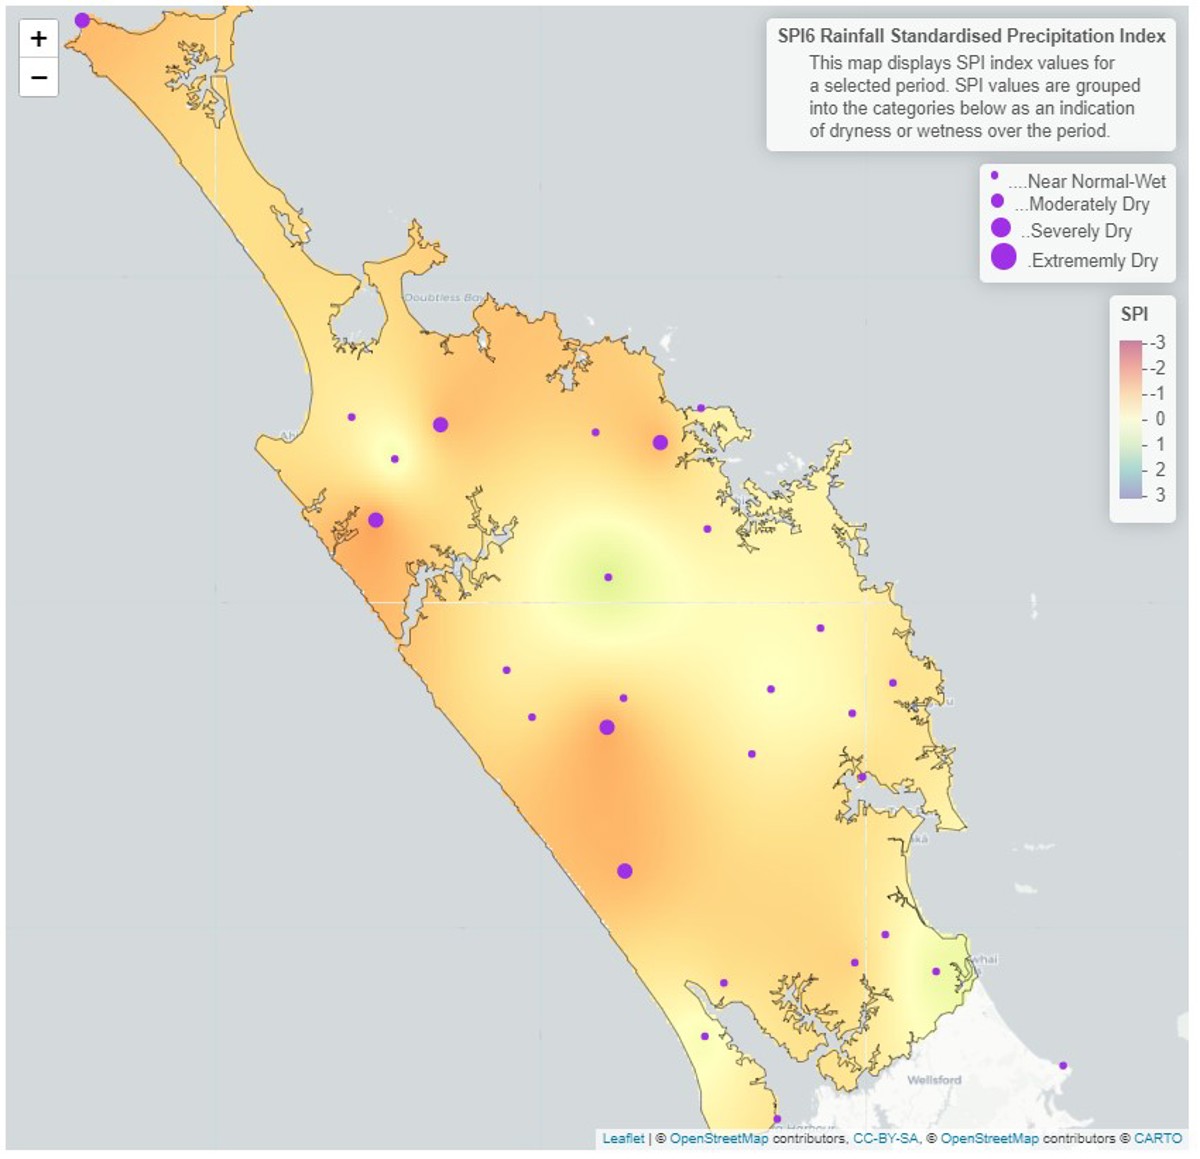
The Standardised Precipitation Index (SPI), which standardises the rainfall recorded in the region, on a three-month scale shows that most areas are “moderately dry” in the centre of the region, while the south, and far north are “near normal”. On a six-month scale between September 2023 – February 2024 Northland is mostly “near normal”.
3-month (December 2023 – February 2024) and 6-month (September 2023 – February 2024) SPI maps


River flow
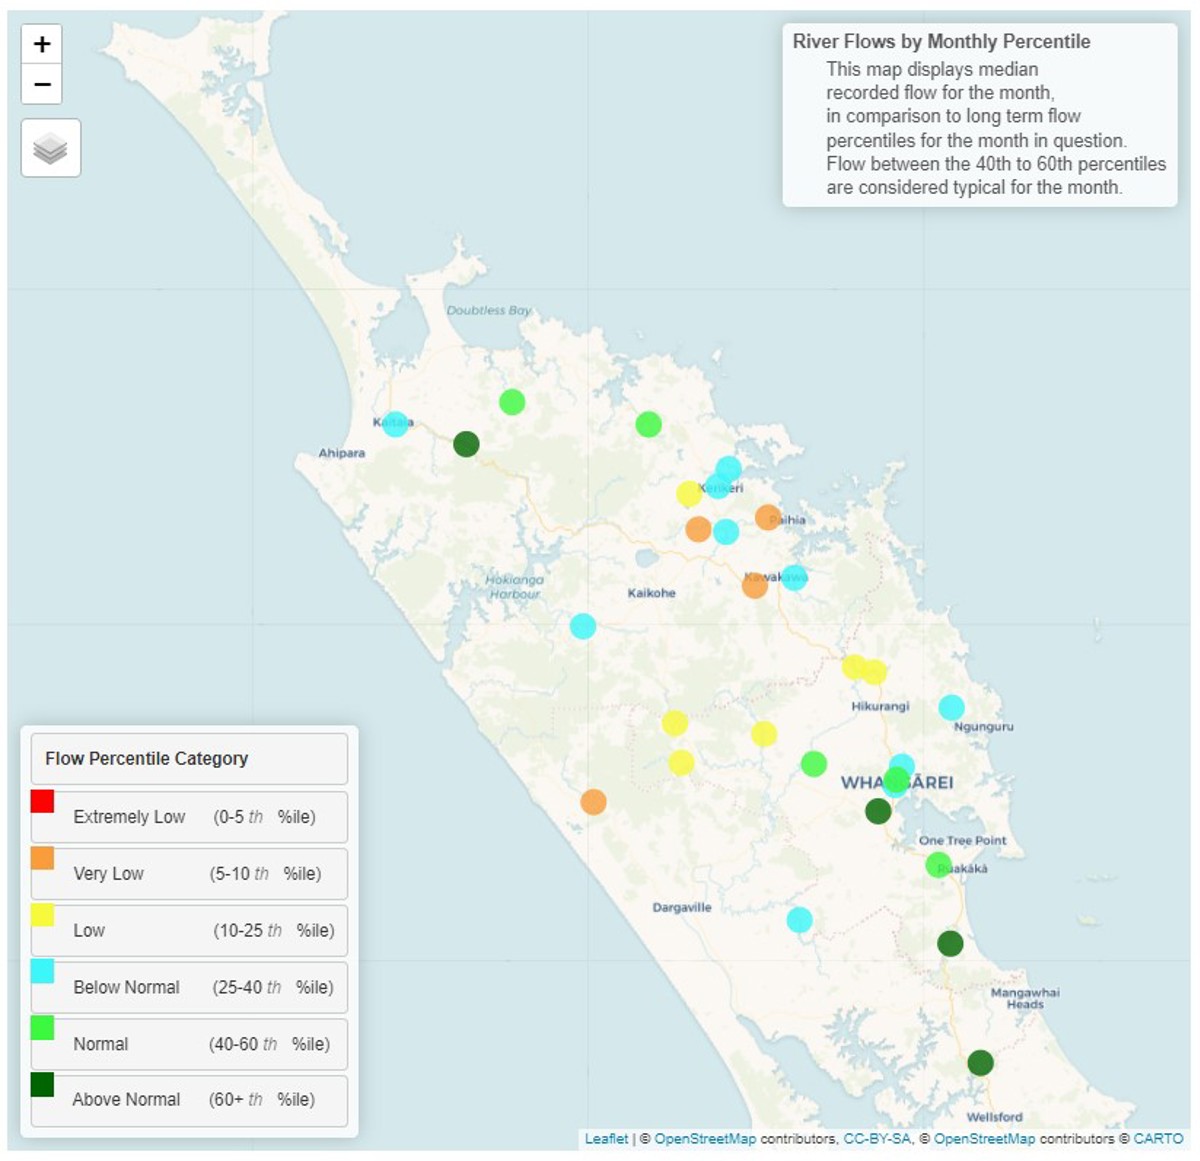
River flows for February are a mixed bag across Northland in general, however catchments are either “below normal” or “Low” with the Kaihu River and some of the Bay of Islands sites currently “very low”.
Monthly percentile River Flows for February 2024

Groundwater
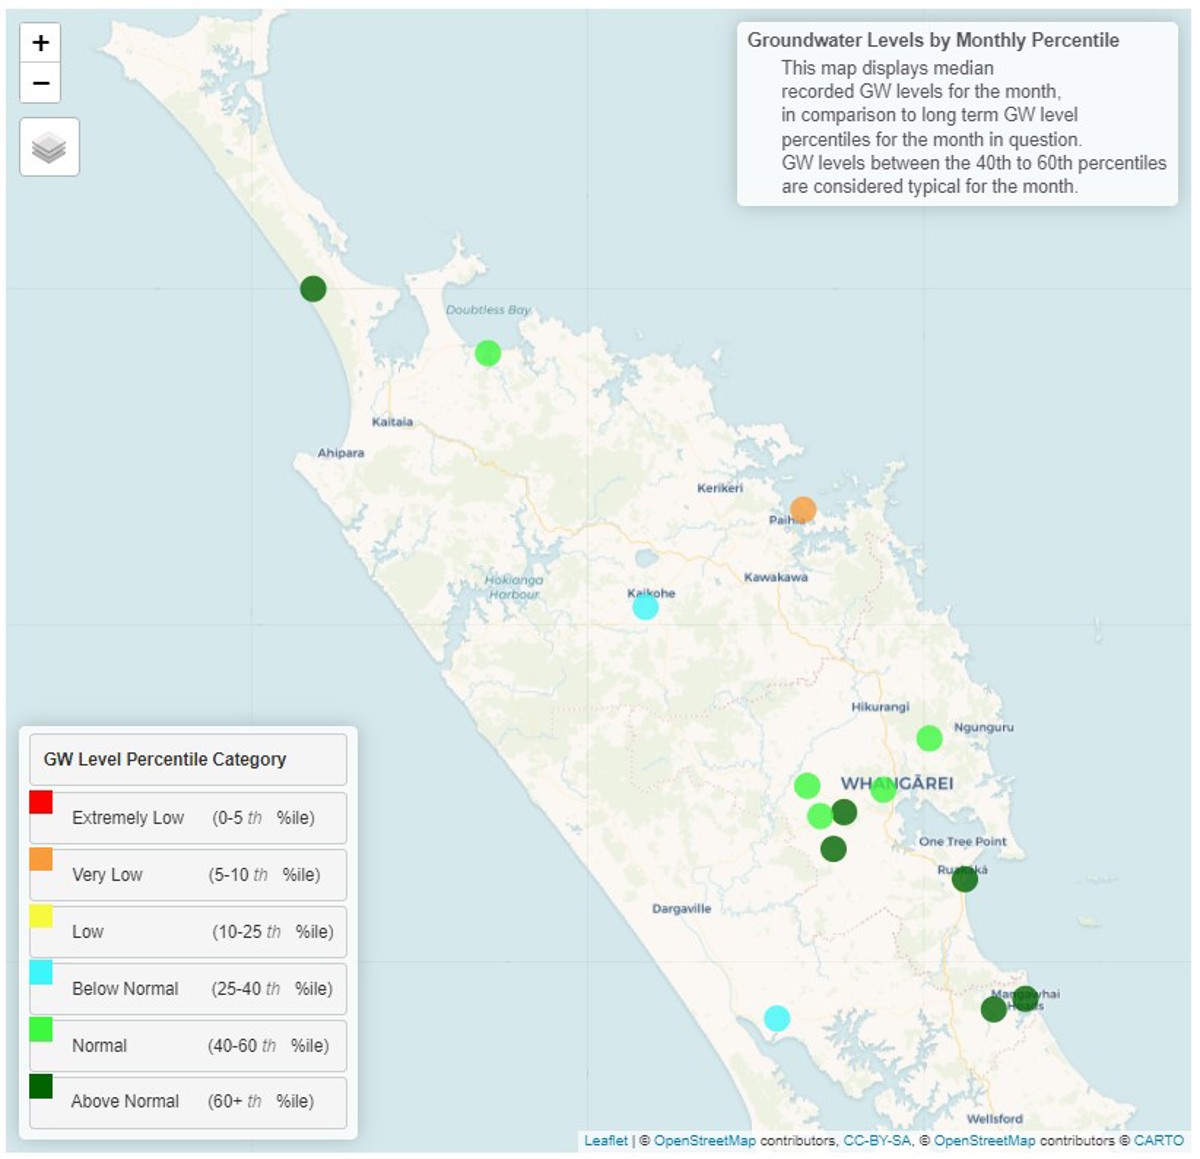
Across Northland aquifers, there is large amount of variation in water levels. Most sites are either “Normal” or “Above Normal” compared to historical February levels/ Kaikohe and Ruawai are currently “Below Normal”, while Russell is “Very Low”.
| Aquifer | Status | Percentile |
| Aupōuri | Above normal | 60th+ |
| Taipā | Normal | 40th-60th |
| Russell | Very low | 5th - 10th |
| Kaikohe | Below normal | 25th-40th |
| Poroti | Normal | 40th-60th |
| Whangārei | Normal | 40th-60th |
| Mangawhai | Above normal | 60th+ |
| Marsden - Ruakākā | Above normal | 60th+ |
| Ruawai | Below normal | 25th-40th |
Groundwater levels for February 2024

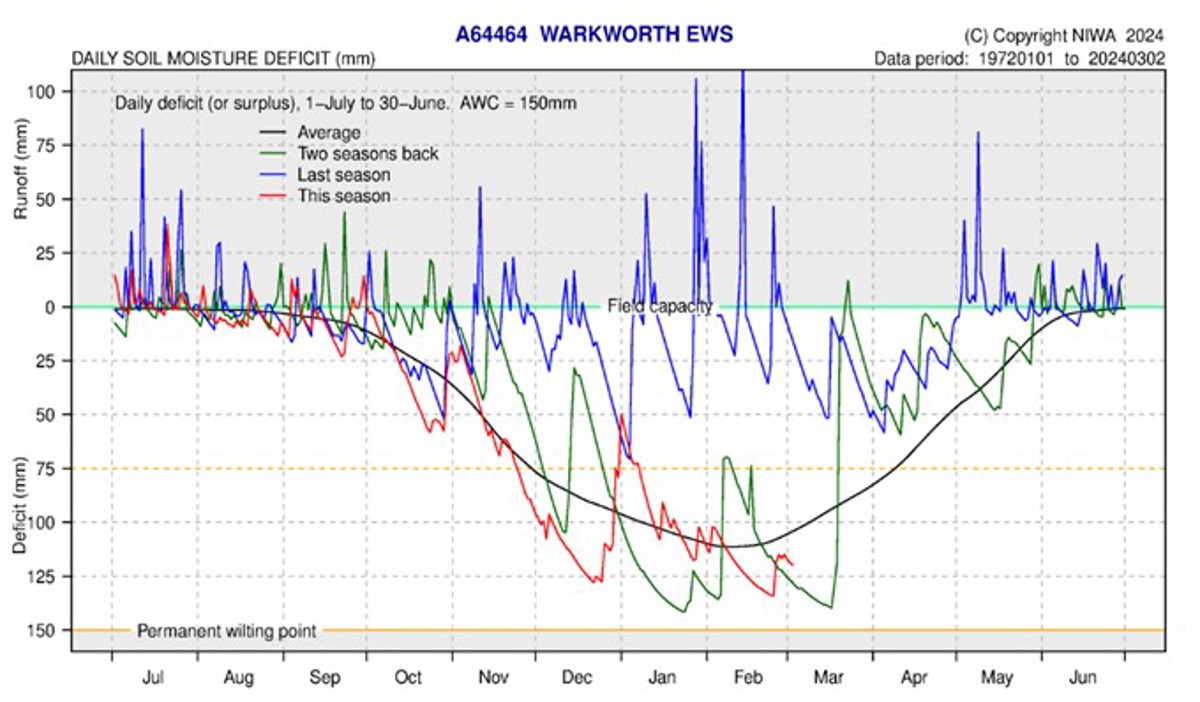
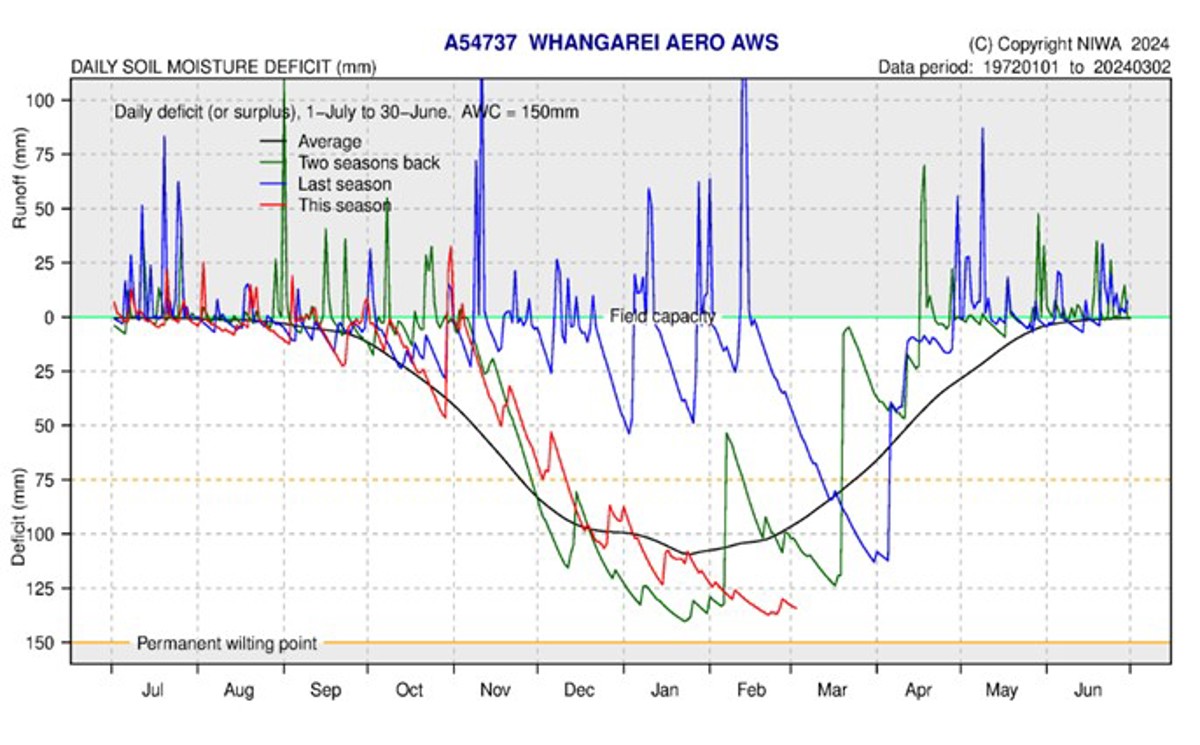
Soil Moisture
Soil moisture levels across Northland are all below average, and drier than January. Generally, the driest period is January with significant recovery seen in February, so this season the continued plant stress could be causing stress for industry. All sites currently have no “available water” for plants (more than 75 mm deficit). Plant growth is likely to be very slow limited to small bursts when showers pass through, and wilting of tender or shallow rooted plants is likely. The soil moisture deficit is calculated based on incoming daily rainfall (mm), outgoing daily potential evapotranspiration (mm), and a fixed available water capacity (the amount of water in the soil 'reservoir' that plants can use) of 150 mm” (NIWA).