January 2024 climate report
8 Feb 2024, 10:30 AM
Summary
- El Niño Southern Oscillation (ENSO) conditions are set to continue, with other climate drivers supporting atypical weather conditions associated with El Niño during February to April.
- Temperatures for the coming months are likely to be “above average", while rainfall is likely to be “near average” or “below average”.
- Rainfall in Northland during January was below average, with only 61% of regional average recorded.
- Standardised rainfall on a three-month scale shows “moderate dryness” on both coasts.
- River flows in January are “above normal” south of Whangārei, while north of Whangārei most catchments have “below normal” flows.
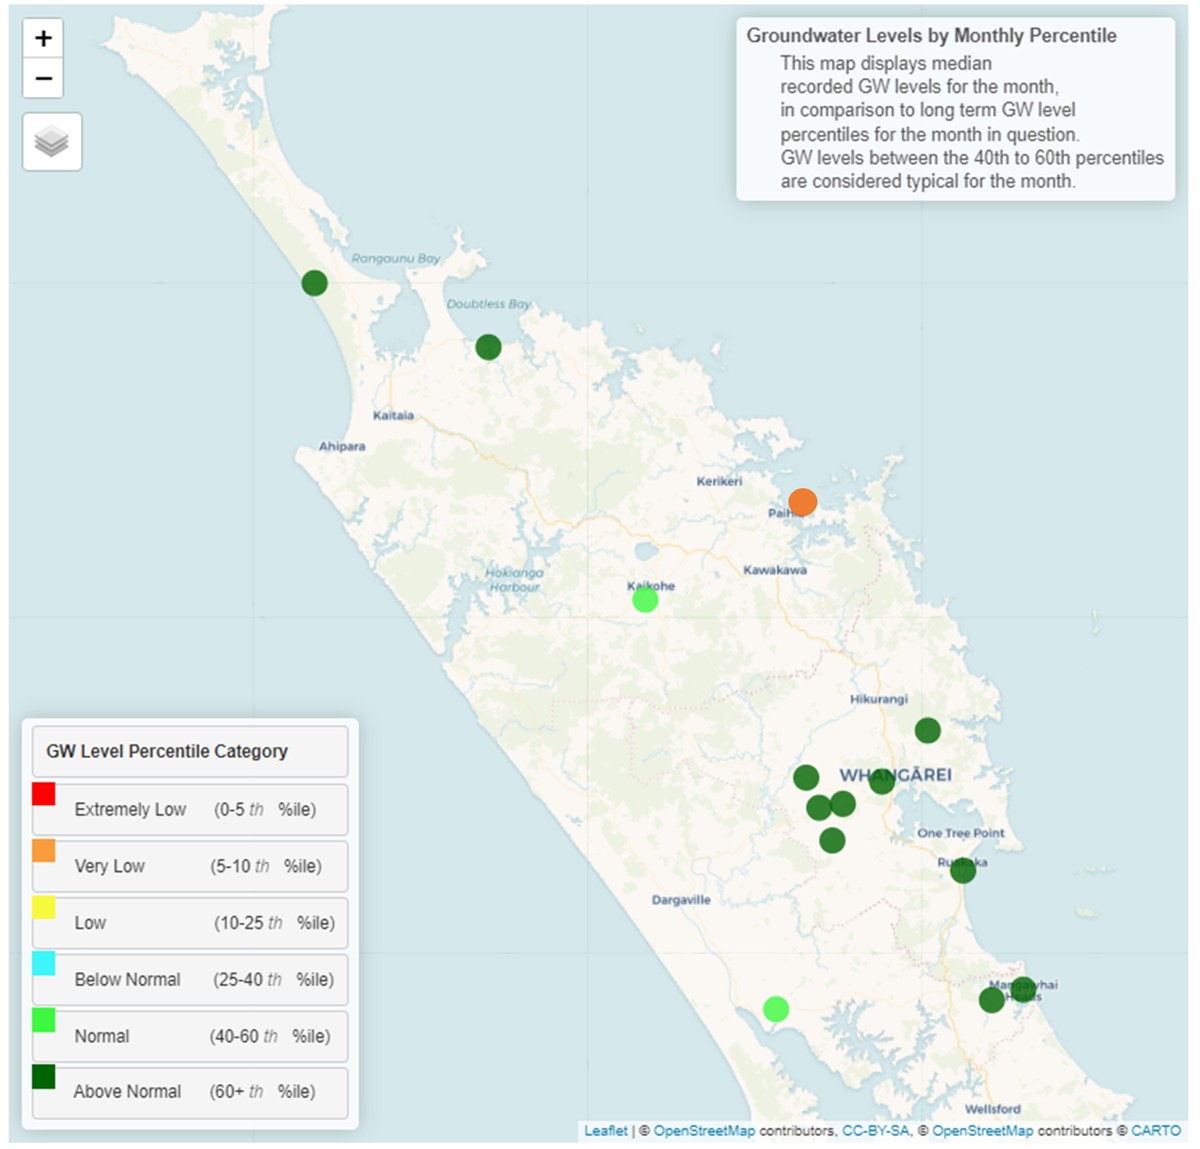
- Most aquifers are “above normal", however Russell is “very low”.
- Soil moisture across the region has a deficit greater than 75 mm, meaning that there is no “available water” for plants, and some temporary wilting is likely to be occurring.
Climate Outlook for February to April 2024
Northland is likely to experience “above average” temperatures, “below normal” rainfall and “average” river flows between February – April, due to four key climate drivers:
- El Niño peaked during January, with the system starting to decay, but conditions are expected to continue throughout autumn, with a possibility of neutral ENSO conditions in May - July.
- Trade wind intensities have increased, and this activity could influence an increase in the El Niño intensity during February.
- The Madden-Julian Oscillation is currently active in the West Pacific, which supports “below average” rainfall and “above average” temperatures, in Northland. The Madden-Julian Oscillation however also can increase the risk of cyclone activity – while this is unlikely to affect New Zealand, awareness is recommended.
- The convective forcing that has been active over the international date line for the last year is expected to wane between February – April. This means that Northland is likely to have less northerly low-pressure systems passing through and be dominated by westerly winds and persistent “drier than average” conditions.
For more details, please refer to NIWA’s seasonal climate outlook for February - April 2024:
NIWA Temperature, Rainfall, Soil Moisture and River Flows probabilities for the period of February - April 2024
(Expressed as % likelihood for either Above Average, Near Average or Below Average conditions).
| Temperature | Rainfall | Soil moisture | River flows | |
| Above average | 65• | 25 | 15 | 15 |
| Near average | 30 | 35• | 40• | 40• |
| Below average | 05 | 40• | 45• | 45• |
The drought forecasting tool (NIWA35) for February through to the start of March, shows that rainfall conditions in Northland are likely to be “Dry” – “Very Dry”. However the New Zealand Drought Index (NZDI), which combines rainfall, soil moisture and evapotranspiration, places only a small risk for Northland to experience “very dry conditions” and no risk of metrological drought being declared. This tool can be accessed, and rerun daily at: shiny.niwa.co.nz/drought-forecast
NIWA35 Rainfall anomaly model for 5 February 2024 – 5 March 2024
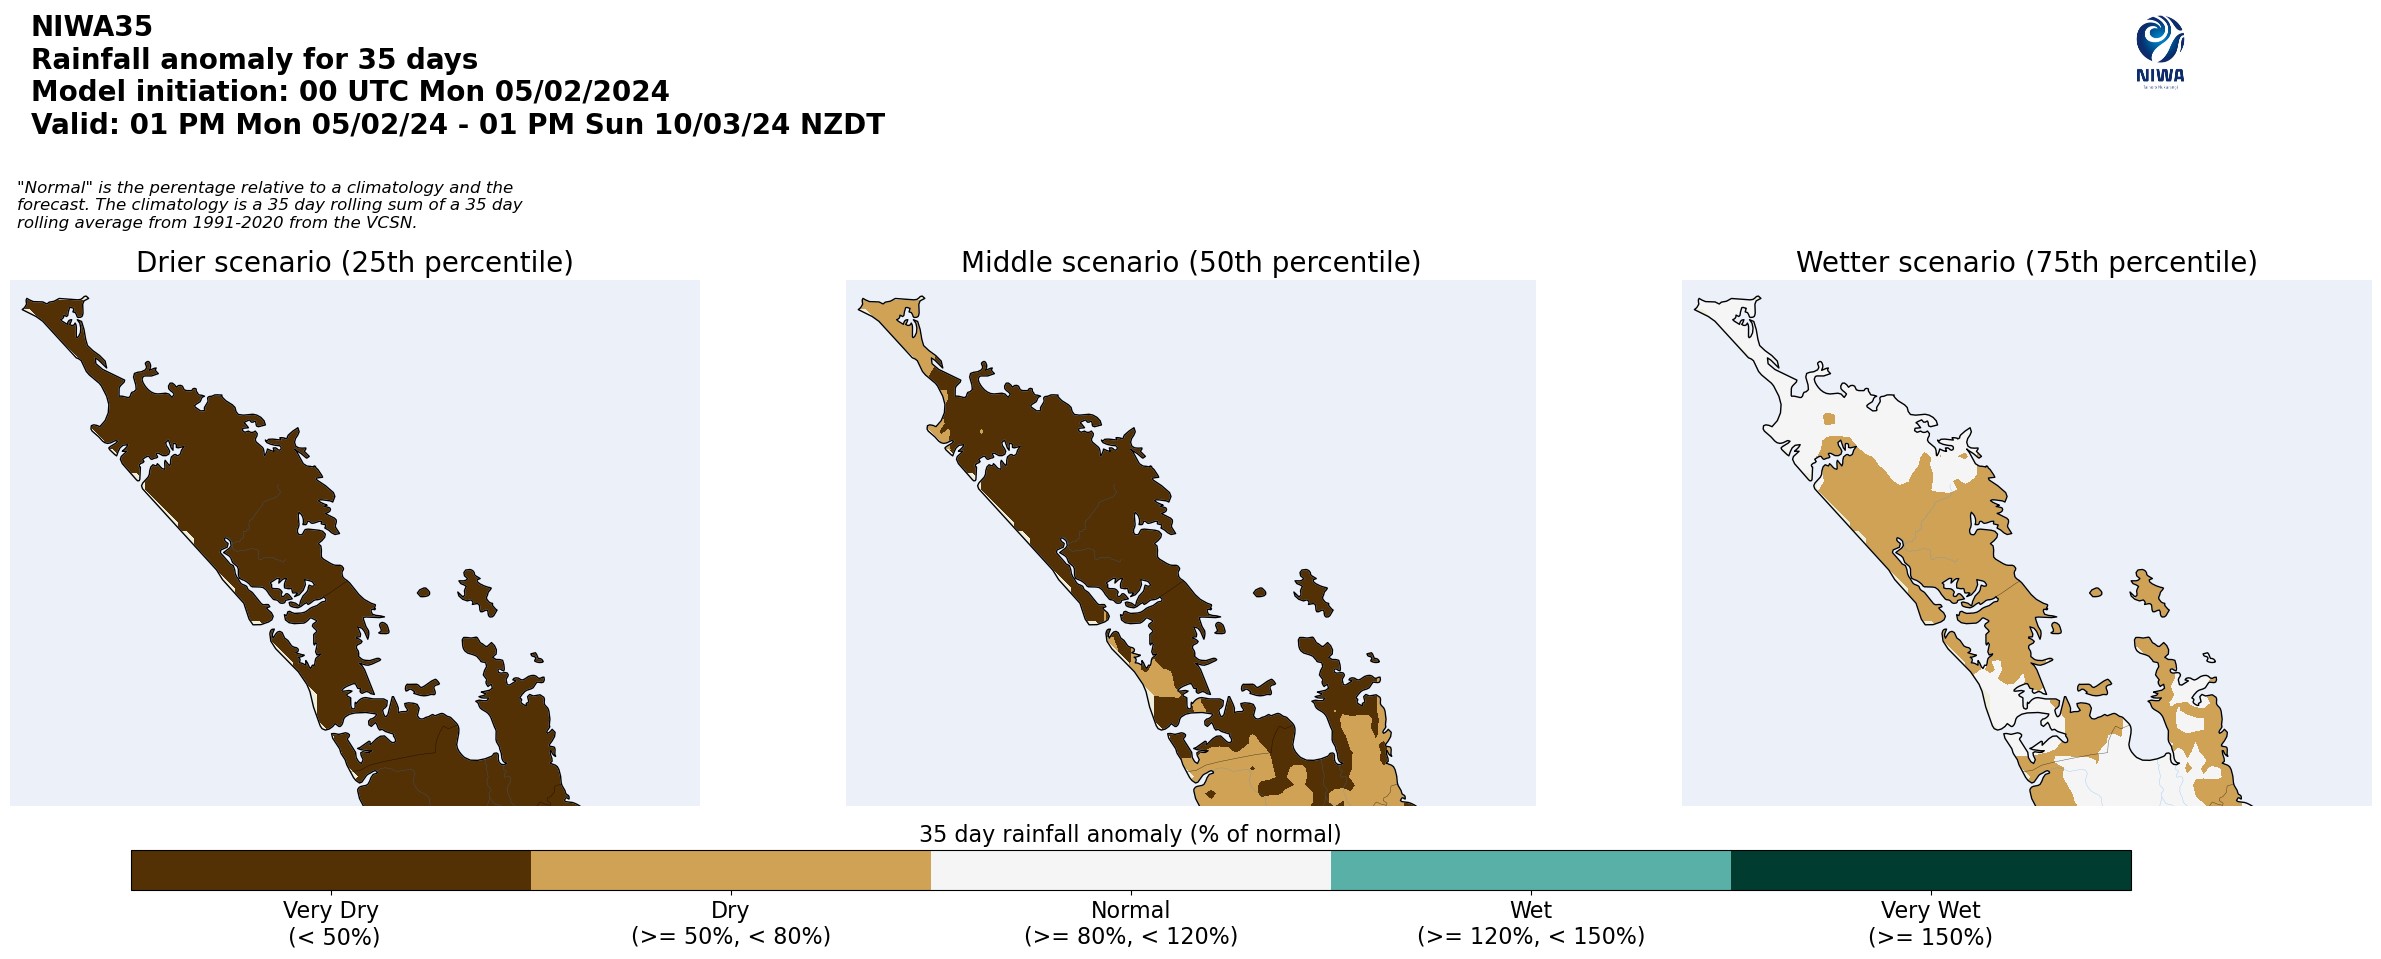
NIWA35 Rainfall anomaly model for 5 February 2024 – 5 March 2024.
NIWA35 New Zealand Drought Index model for 5 February 2024 – 5 March 2024
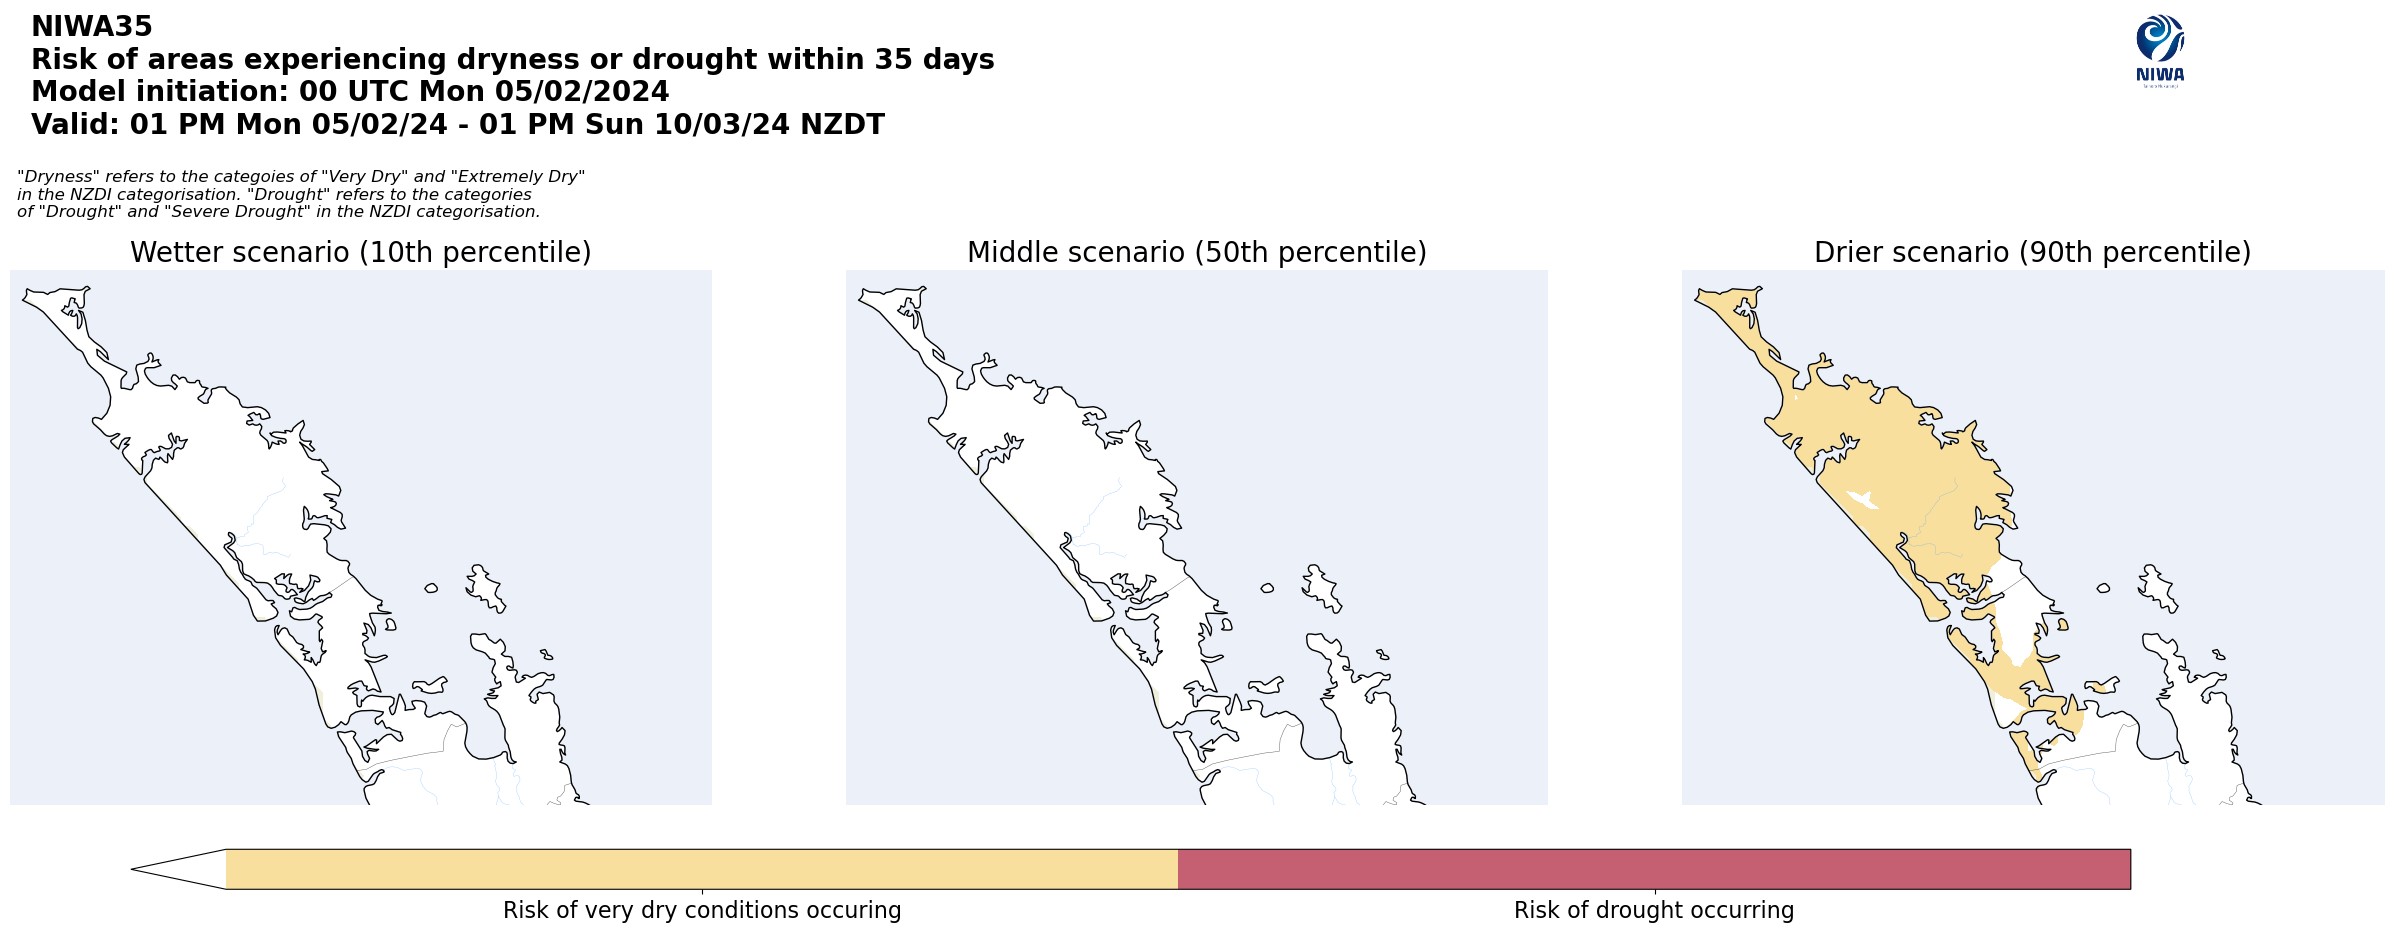
NIWA35 New Zealand Drought Index model for 5 February 2024 – 5 March 2024.
Rainfall
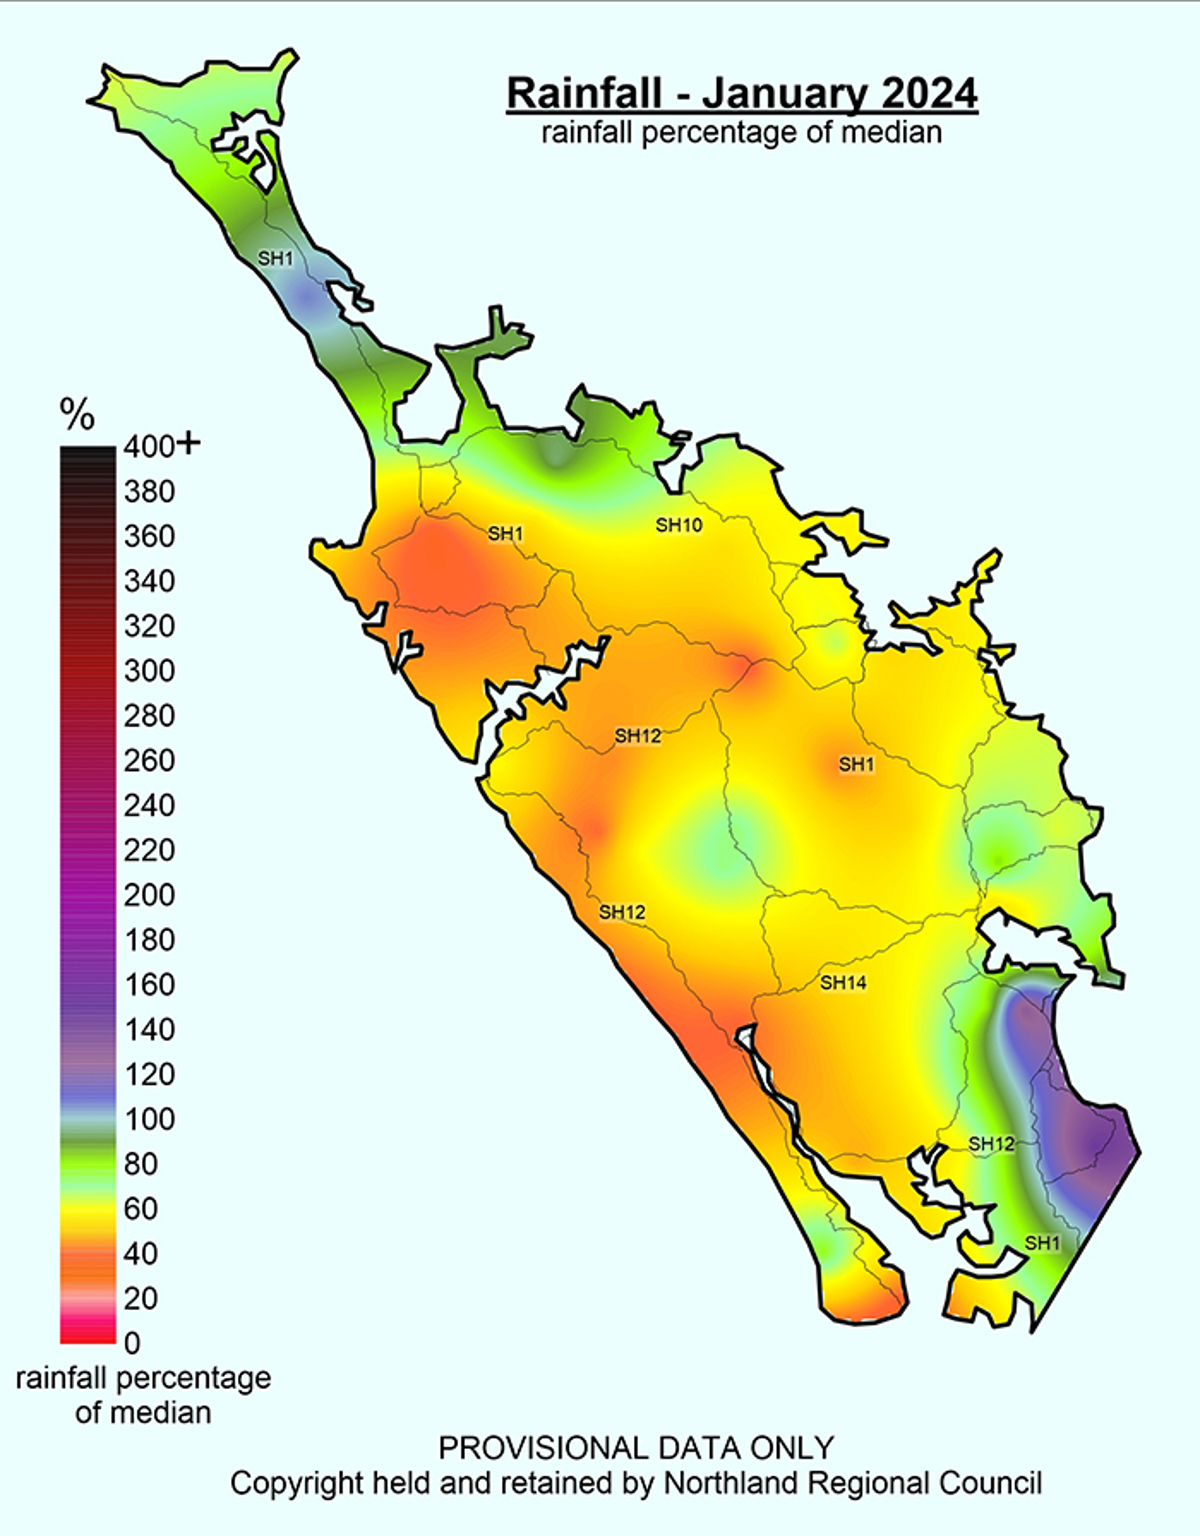
Rainfall in Northland was sparse for most of January, while the middle of the month was dreary, hourly intensities remained low. On average Northland recorded 61% of the expected regional rainfall for January. The highest rainfalls recorded were in the Mangawhai area, due to the geographic effect of the Brynderwyns. With the Hakaru catchment recording 98 mm (147%). In contrast the west coast and stretching into the central section of the region were particularly dry, with the minimum rainfall recorded, of 22.5 mm (35%), at Poutō Point. Overall Northland had an average of 61%.
Rainfall (% of Median) for January 2024 across Northland with a range of 147% to 35%

Standardised Precipitation index (SPI)
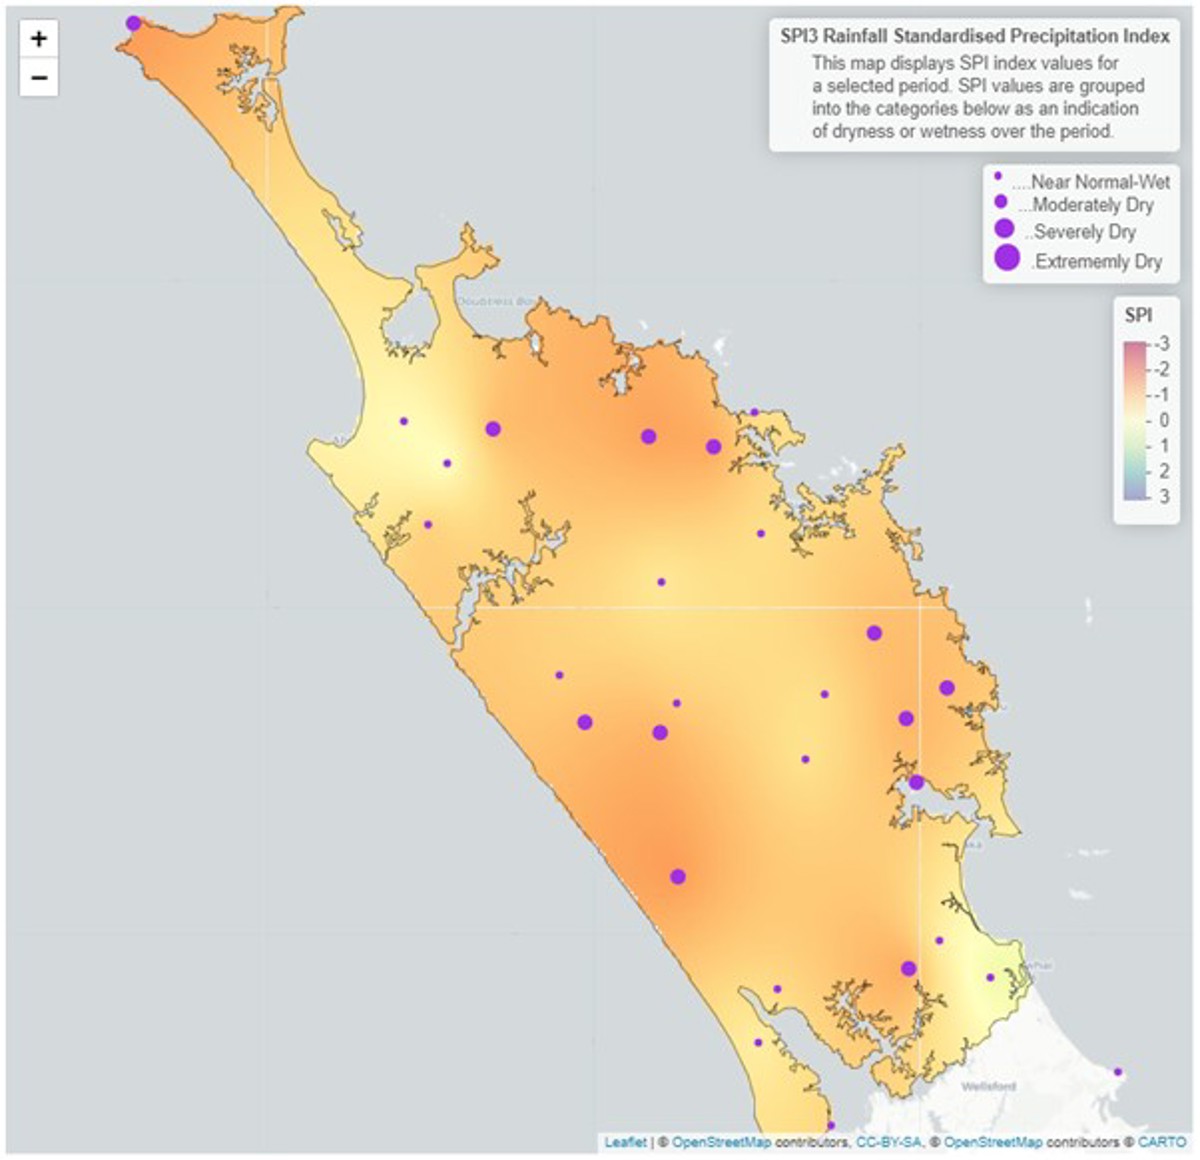
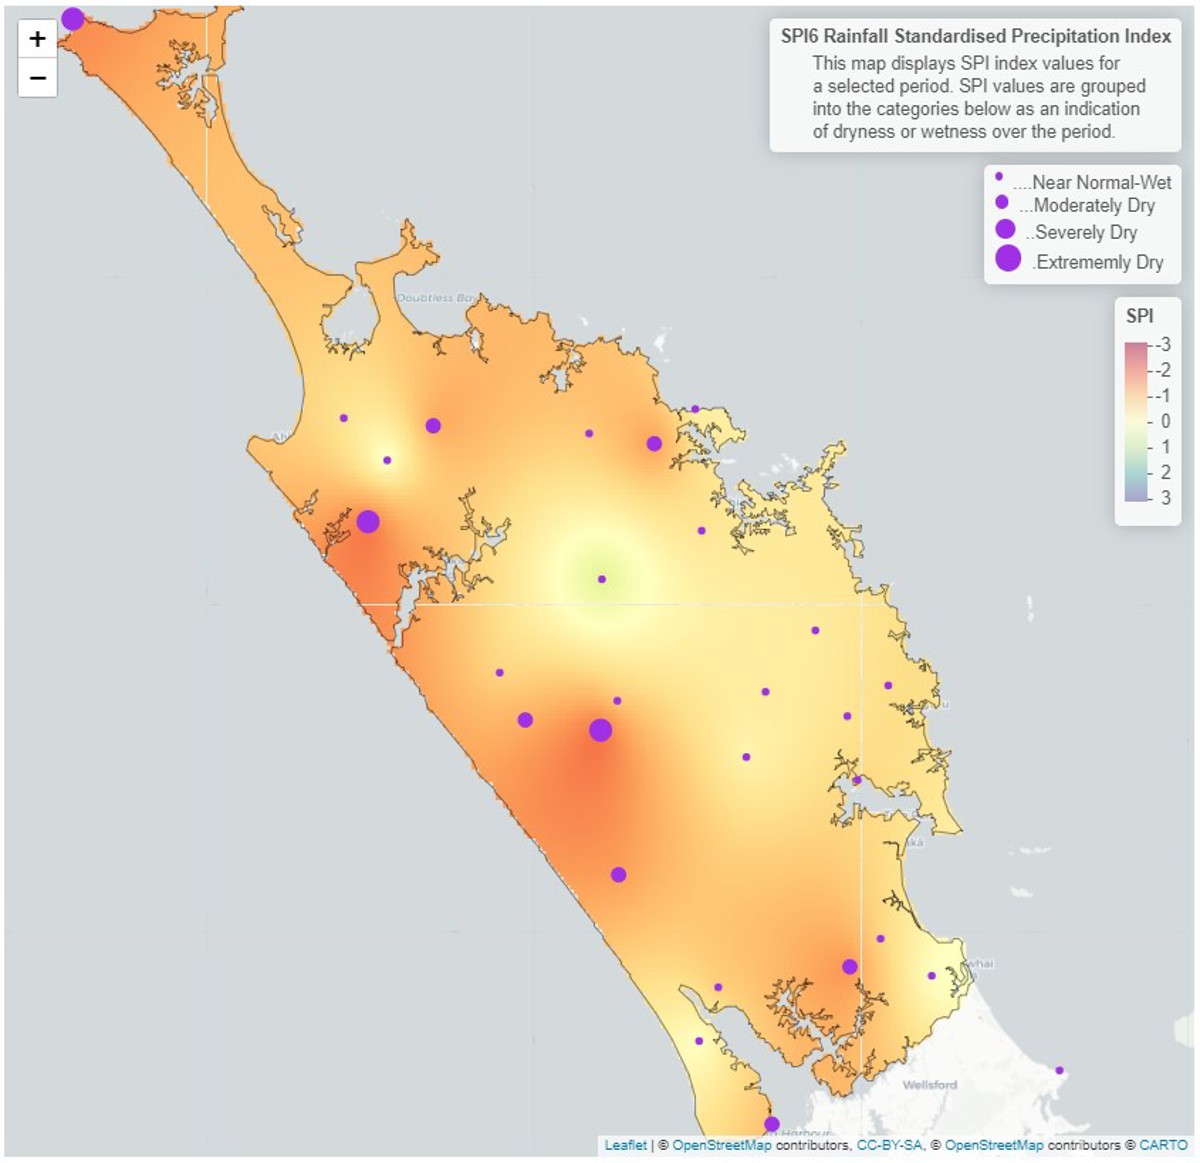
The Standardised Precipitation Index (SPI), which standardises the rainfall recorded in the region, on a three-month scale shows that most areas are “moderately dry” on both coasts, while moving through centre of the region conditions are “Near Normal”. On a six-month scale between August 2023 – January 2024 conditions have increased to “severely dry” while the rest of the region is mostly “near normal”.
3-month (November 2023 – January 2024) and 6-month (August 2023 – January 2024) SPI maps


River flow
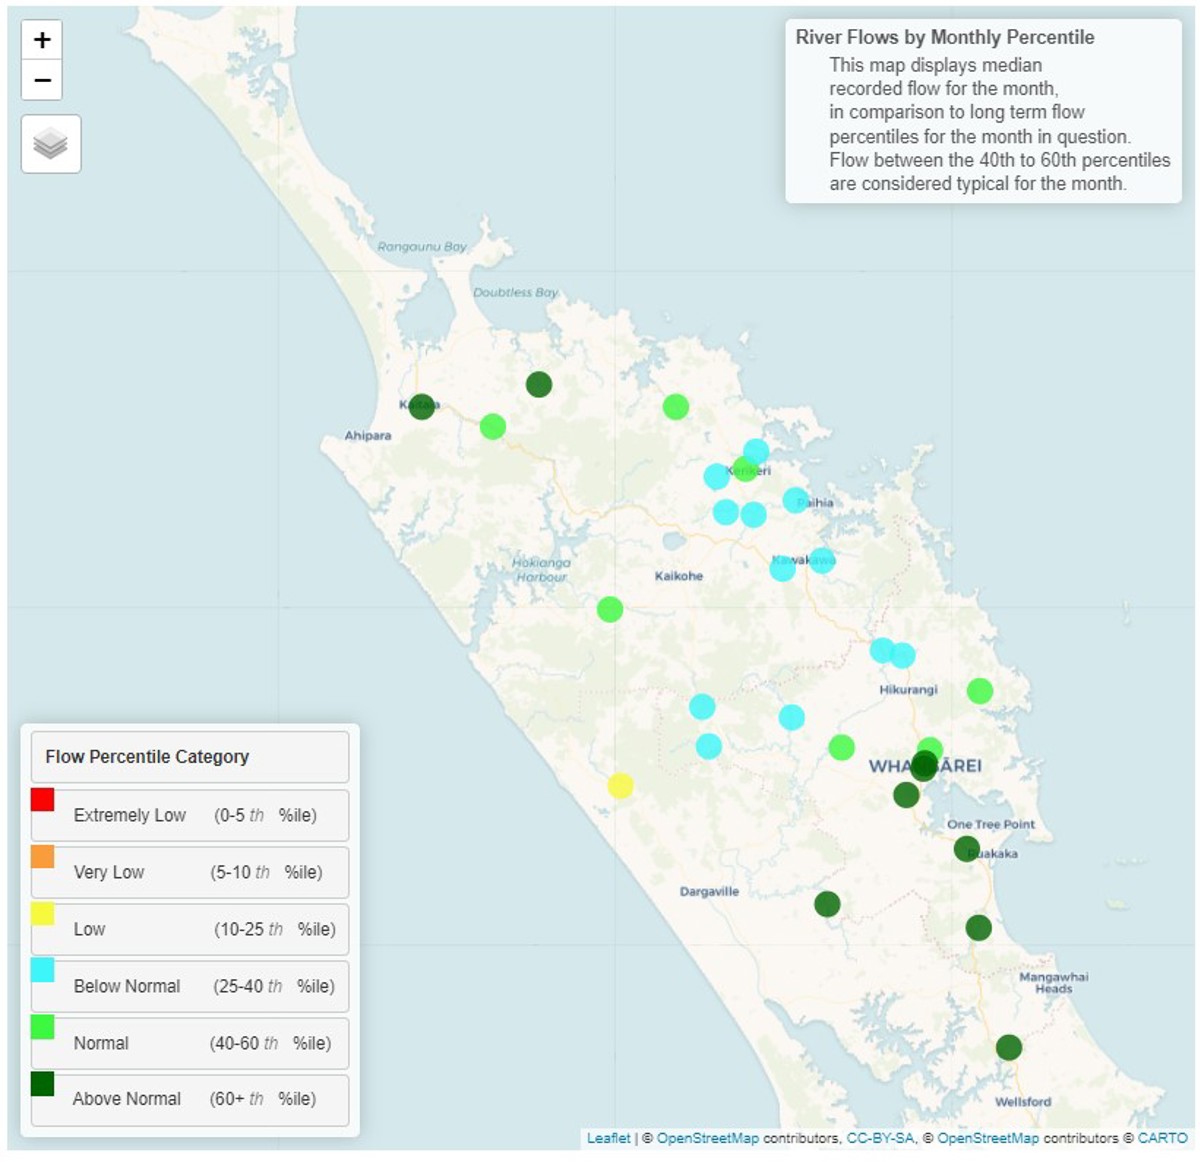
River flows in Northland in January are grouped into distinct areas, with the catchments south of Whangārei currently having “above normal” flows, which the catchments to the north are currently “normal” or “below normal”. The two differences to this pattern are the Kaihu river that is “low” for January and the Kaitaia catchments being “above normal”.
Monthly percentile River Flows for January 2024

Groundwater
Most water levels in Northland are currently recording “above normal” for January. However, the Russell aquifer is “very low”, while Kaikohe and Ruawai are “normal”.
| Aquifer | Status | Percentile |
| Aupōuri | Above normal | 60th+ |
| Taipā | Above normal | 60th+ |
| Russell | Very low | 5th - 10th |
| Kaikohe | Normal | 40th-60th |
| Poroti | Above normal | 60th+ |
| Whangārei | Above normal | 60th+ |
| Mangawhai | Above normal | 60th+ |
| Marsden - Ruakākā | Above normal | 60th+ |
| Ruawai | Normal | 40th-60th |
Groundwater levels for January 2024

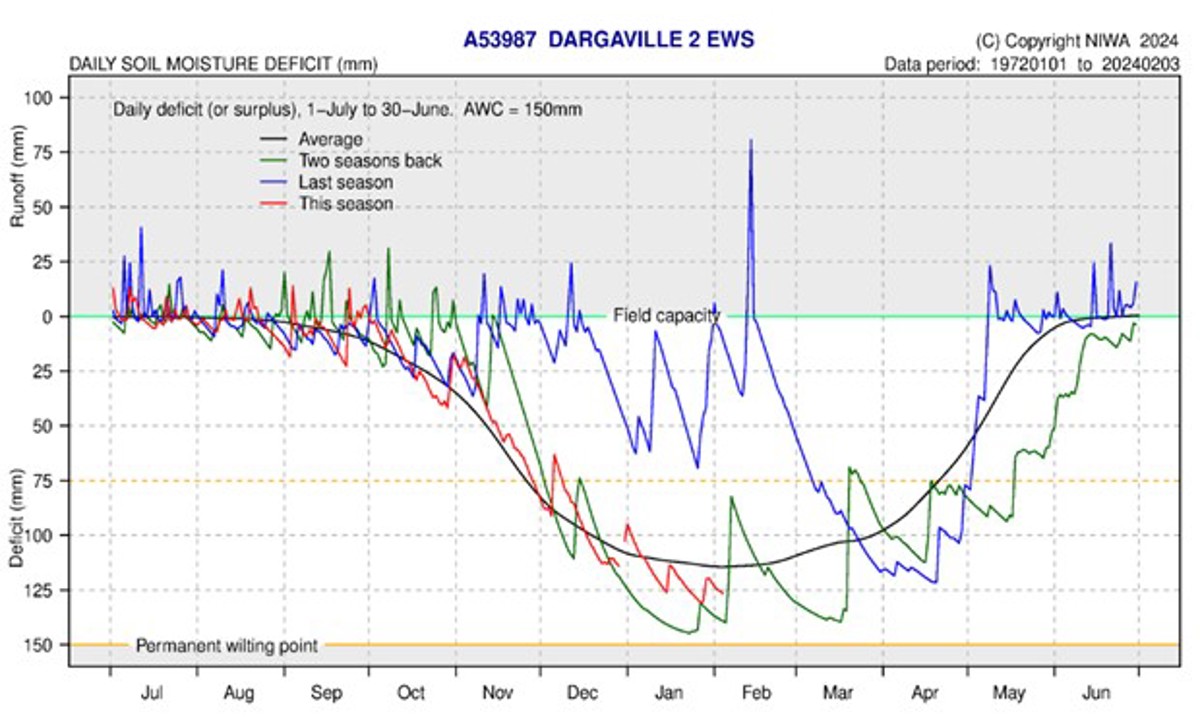
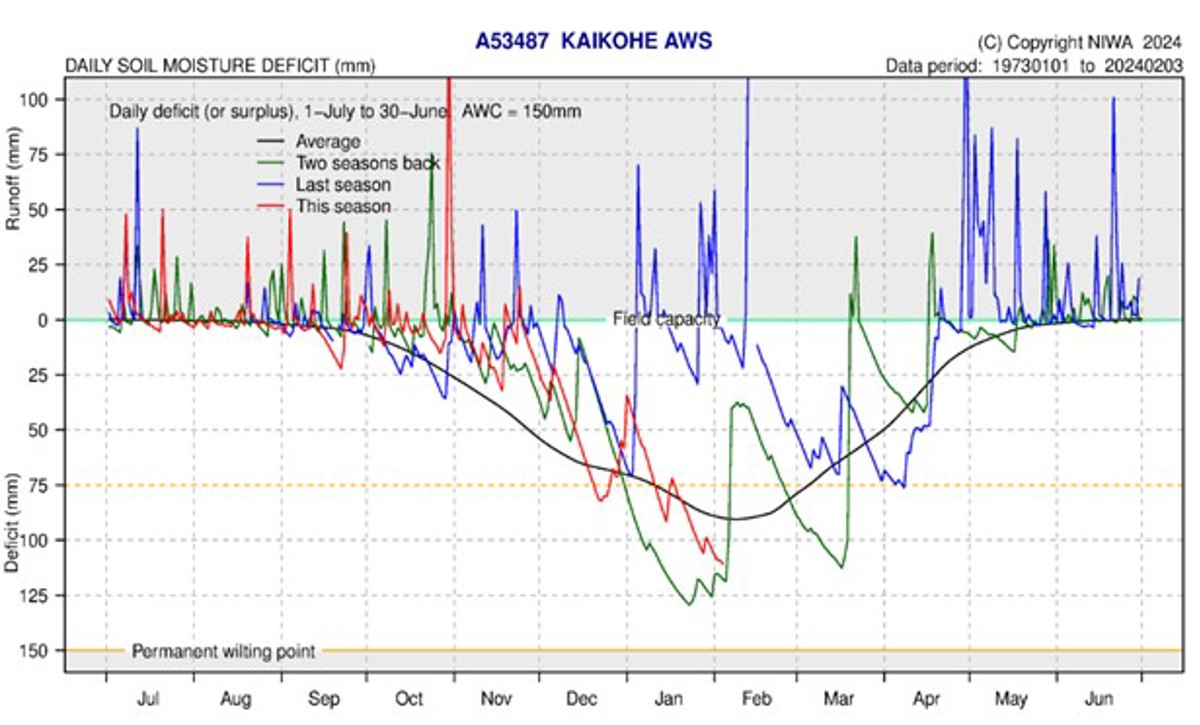
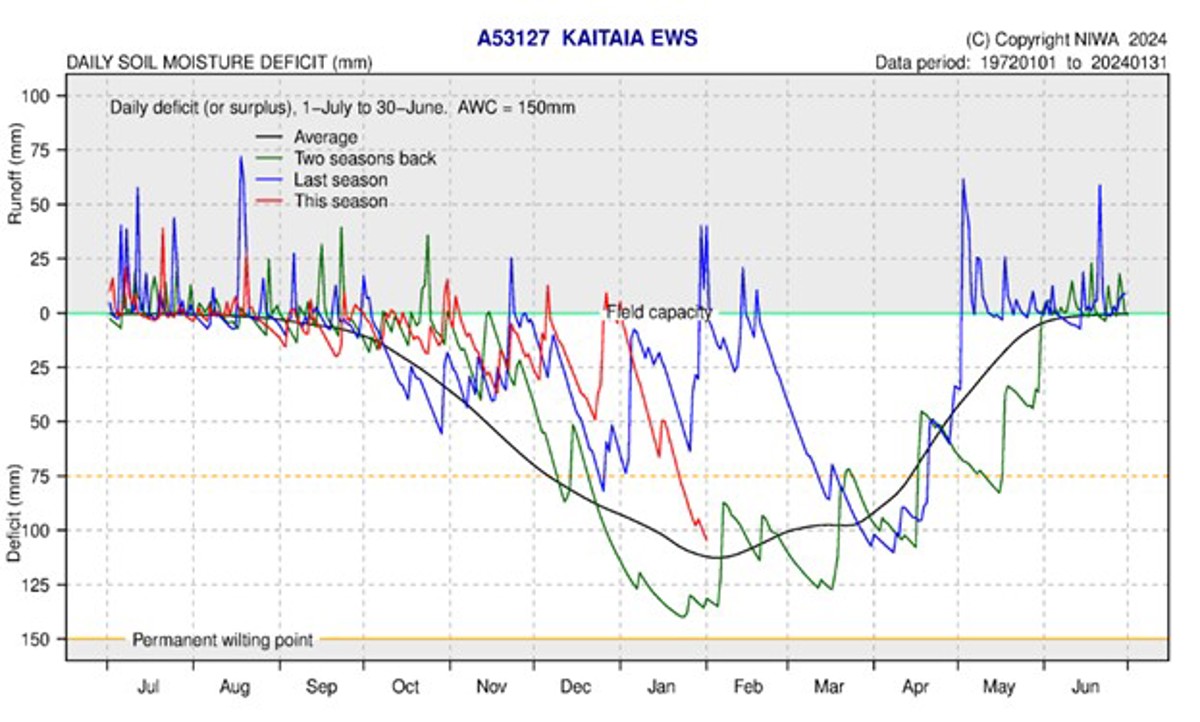
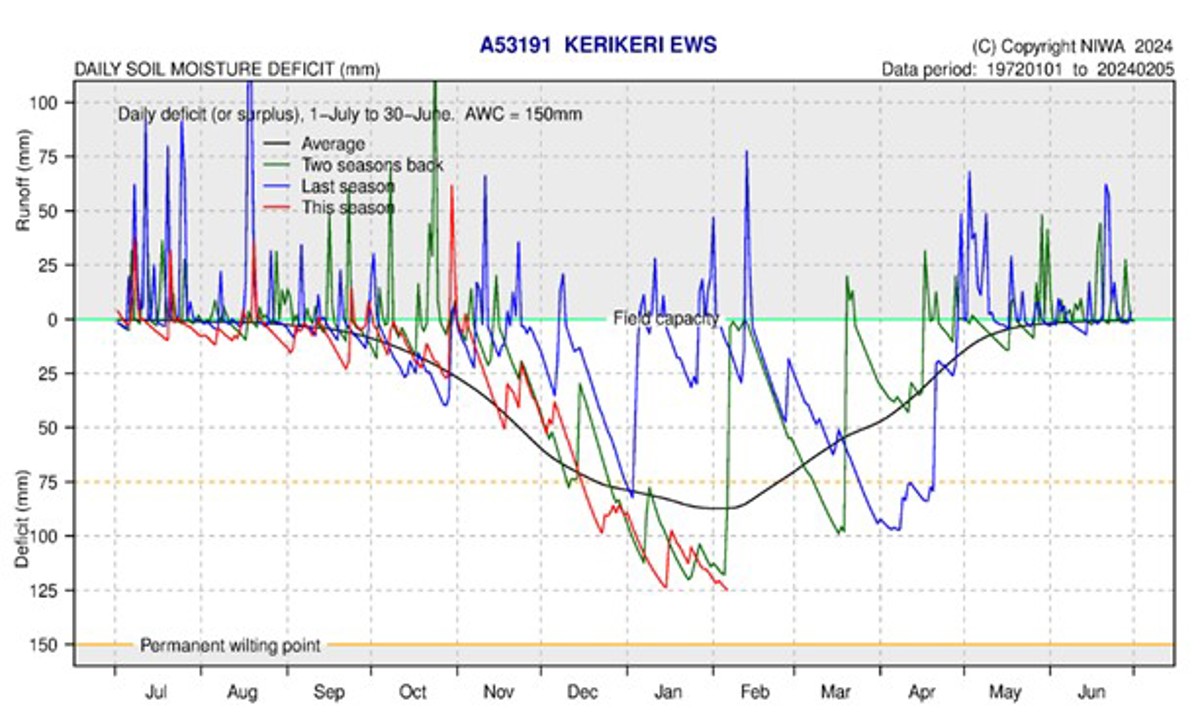
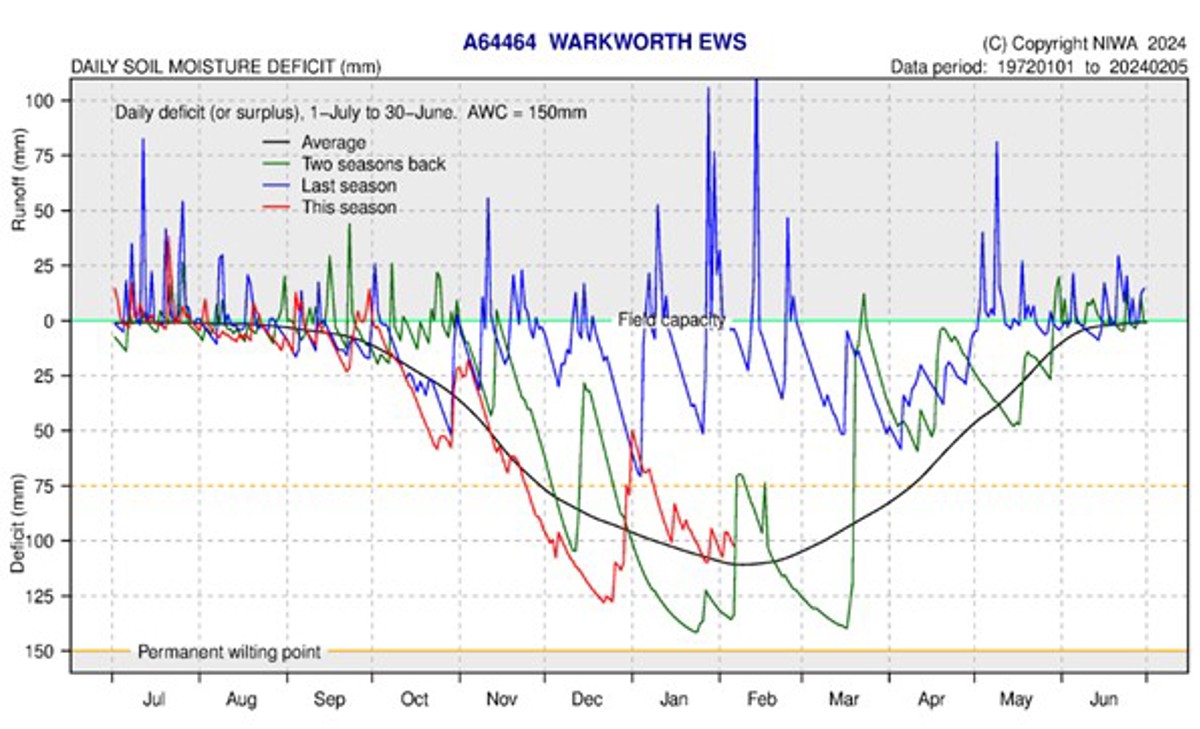
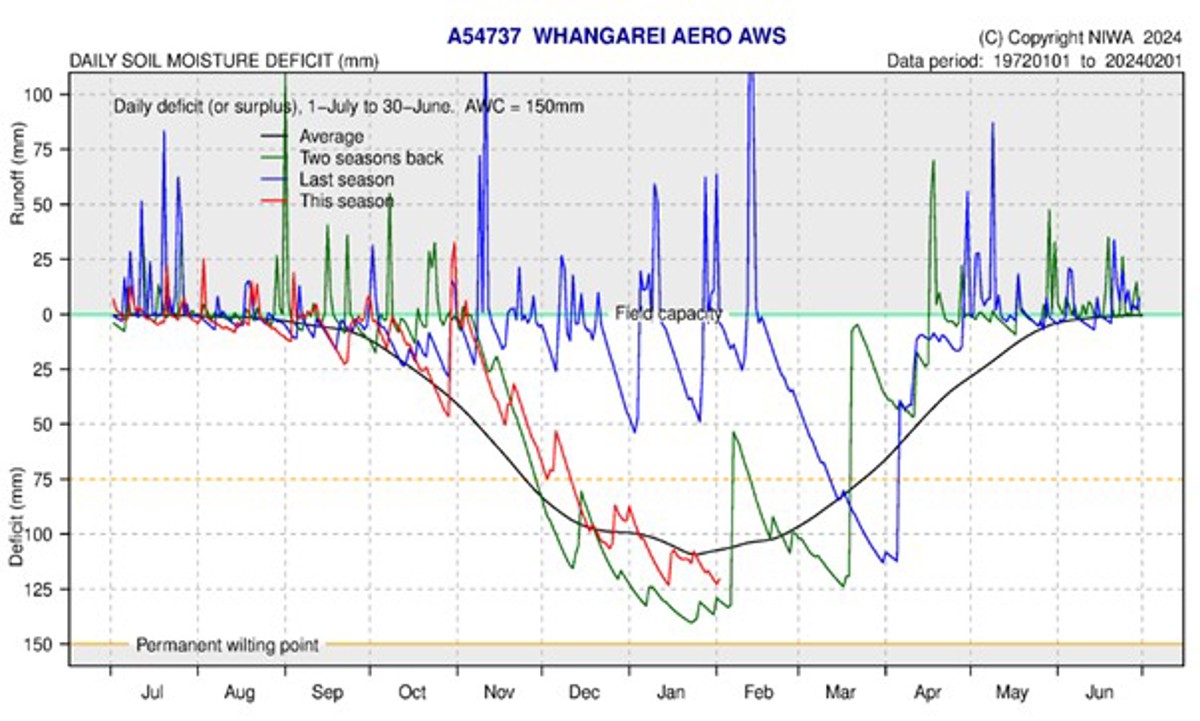
Soil Moisture
Soil moisture levels across the region have steadily dropped throughout January, with all sites entering February with no “available water” for plants (more than 75 mm deficit). Plant growth is likely to be very slow limited to small bursts when showers pass through, and temporary wilting of tender or shallow rooted plants is likely.
The soil moisture deficit is calculated based on incoming daily rainfall (mm), outgoing daily potential evapotranspiration (mm), and a fixed available water capacity (the amount of water in the soil 'reservoir' that plants can use) of 150 mm” (NIWA).