August 2023 climate report
5 Sep 2023, 11:20 AM
Summary
- El Niño is likely to be officially declared in New Zealand during September
- Spring temperatures are likely to be “near average”, while rainfall, soil moisture and river flows are likely to be “below average”.
- Rainfall during August was lower than expected across Northland with an average of 51% of expected rainfall recorded.
- River flows and ground water levels are “low” – “extremely low” for August for majority of the region.
- Soil moisture levels are sitting just below field capacity across Northland at the end of August.
Climate Outlook
September to November 2023
During August the Pacific Sea Surface temperatures continued to meet El Niño conditions, while the Southern Oscillation Index, the atmospheric driver for New Zealand, was closing in on the threshold for El Niño. It is likely that El Niño will be declared for New Zealand during September. During September to November weather patterns are expected to be predominantly from the southwest, however the start of September will be mostly from the east. In Northland temperatures for spring are likely to be “near average”, while rainfall, soil moisture and river flows are likely to be “below average”. The risk for the development of marine heatwave conditions during spring are low, as El Niño conditions become entrenched in the current New Zealand climate system. For more details see:
See the seasonal climate outlook on NIWA's website: niwa.co.nz
NIWA Temperature, Rainfall, Soil Moisture and River Flows probabilities for the period of September to November 2023
(Expressed as % likelihood for either Above Average, Near Average or Below Average conditions).
| Temperature | Rainfall | Soil moisture | River flows | |
| Above average | 35 | 20 | 20 | 15 |
| Near average | 50• | 35 | 35 | 40• |
| Below average | 15 | 45• | 45• | 45• |
Rainfall
August continued the same drier than expected pattern as July, with all parts of Northland recording less than the expected rainfall for the month. The first three weeks of the month was dominated by grey drizzly weather, however no large events passed through with the final part of the month being mostly sunny. On average Northland received 83mm of rain, which is 51% of the expected August rainfall. The highest rainfall recorded was 189 mm, in Waimamaku, which was 70% of expected. While the east coast received the least amount of rainfall, with Whakapara recording the lowest percentage with 34% of expected.
Rainfall (% of Median) for August 2023 across Northland with a range of 34% to 70%

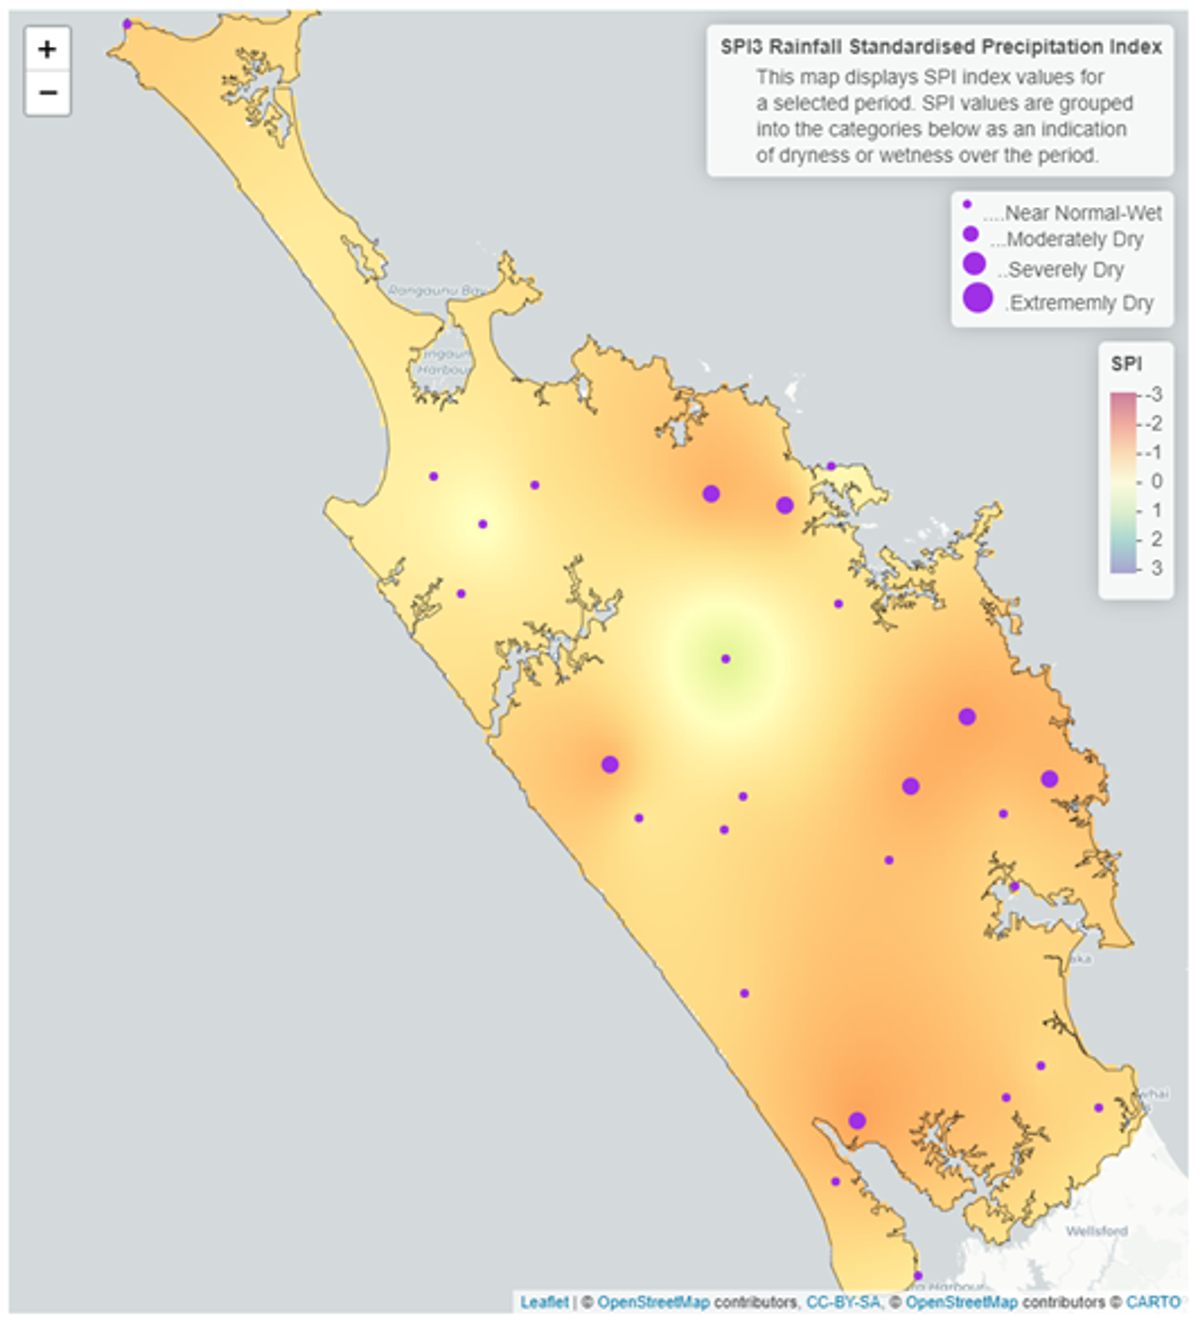
Standardised Precipitation index (SPI)
The Standardised Precipitation Index (SPI) on a three-month scale shows that all of Northland has been “near normal or wet”. The wettest areas in the region are spread from Kaikohe into the Hokianga and the upper areas of the west coast. The east coast and southern areas of the region are drier, with “near normal” rainfall compared to previous years between May - July.
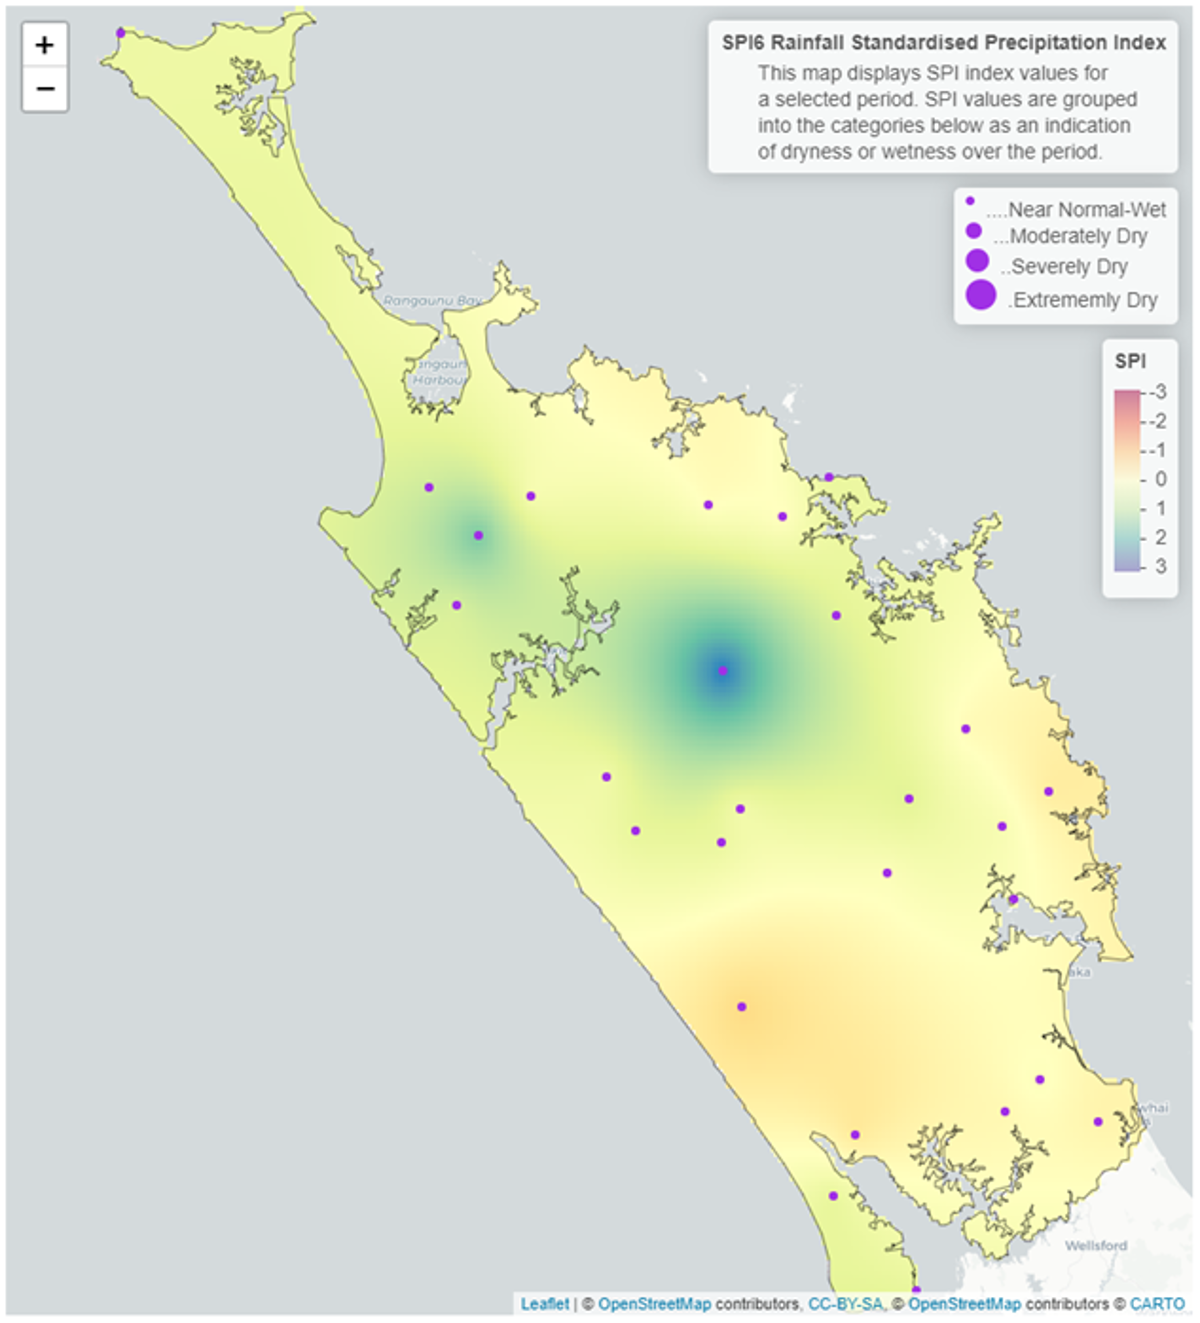
On a six-month scale between February – July 2023, the standardised rainfall averages Northland to being wetter than normal, with the Kaikohe area and the south-eastern corner of the region being extremely wet, driven from extreme rain events in February, though the drier times in July and March have influenced the coastal areas to have “normal” rainfall on the six-month period.
3-month (May-July 2023) and 6-month (February to July 2023) SPI maps


River flow
River flows in Northland trended towards “below normal” to “extremely low” flows for August. With only a few river catchments having “normal” flows. This is the expected result following two months of lower than expected rainfall.
Monthly percentile River Flows for August 2023

Groundwater
Water levels in the aquifers across Northland are varied, depending on their recharge characteristics, ranging from “extremely low” – “above normal” for August levels.
| Aquifer | Status | Percentile |
| Aupōuri | Above normal | 60th+ |
| Taipā | Normal | 40 - 60th |
| Russell | Extremely Low | 0 - 5th |
| Kaikohe | Low | 10 - 25th |
| Poroti | Normal | 40 - 60th |
| Whangārei | Normal | 40 - 60th |
| Mangawhai | Above normal | 60th+ |
| Marsden - Ruakākā | Above normal | 60th+ |
| Ruawai | Low | 10 - 25th |
Groundwater map for August 2023

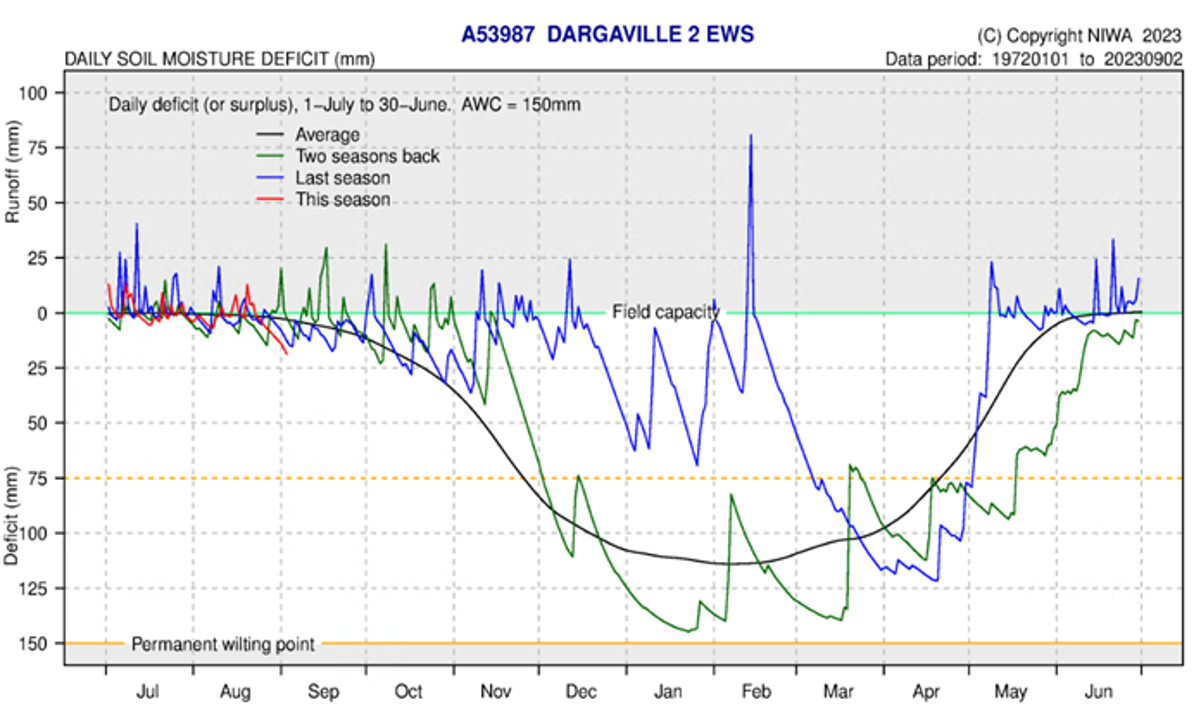
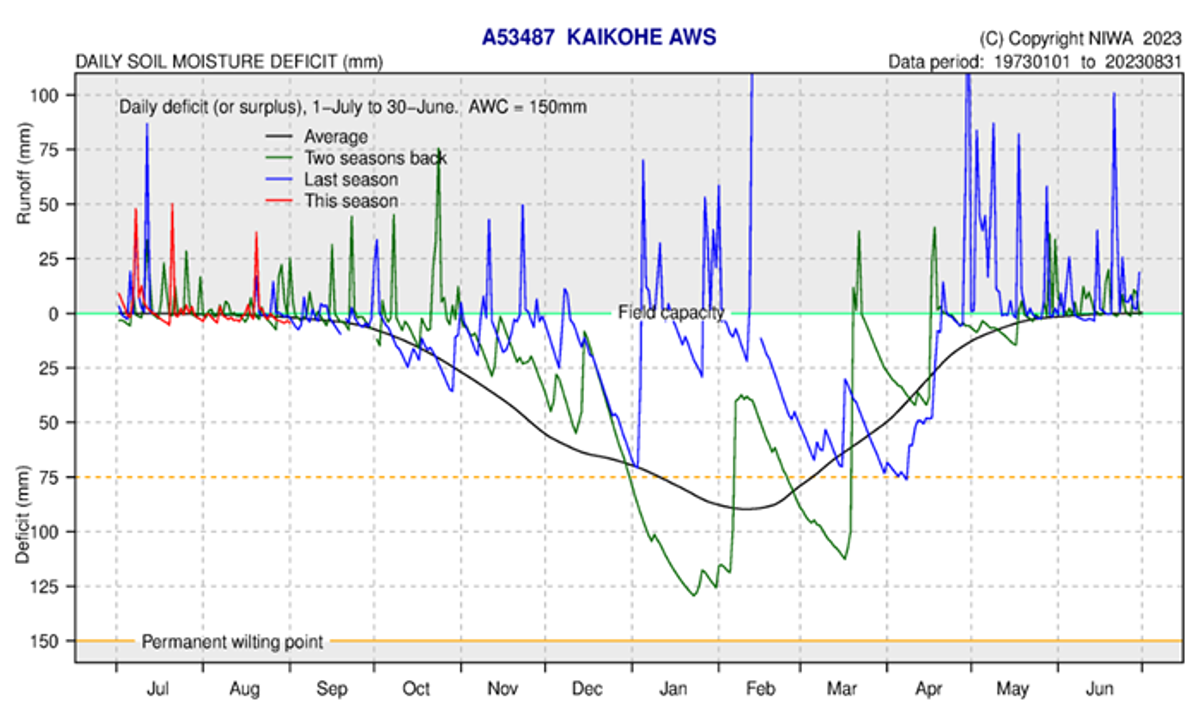
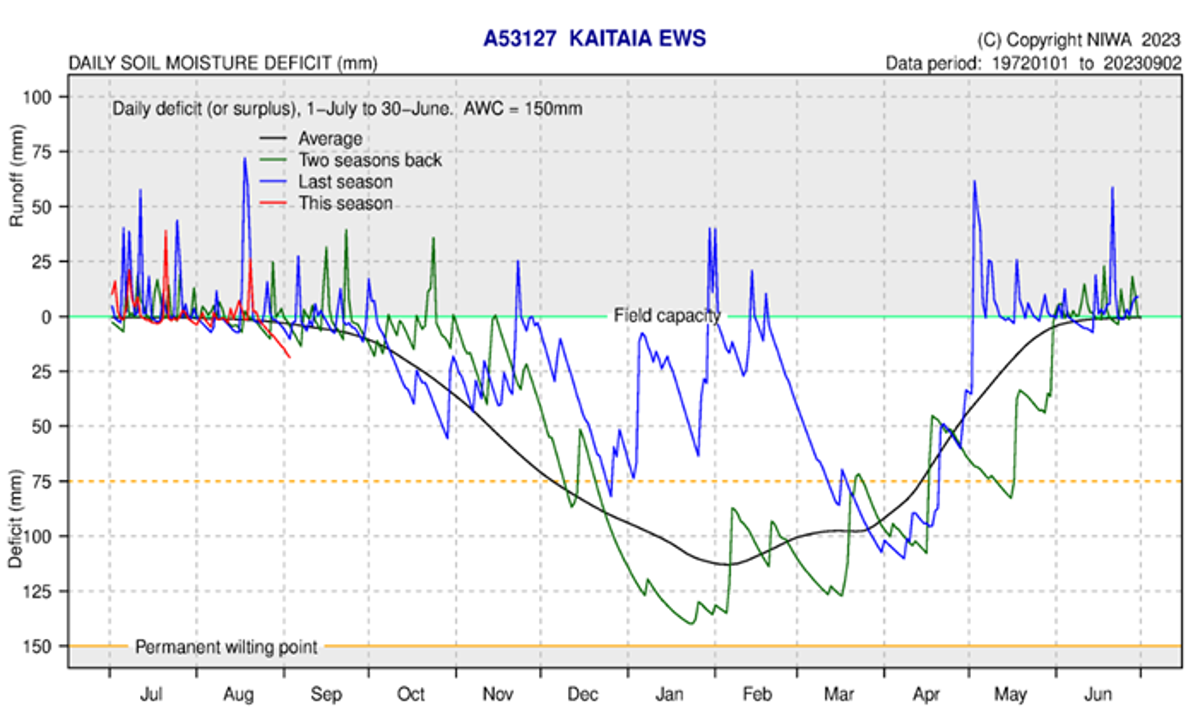
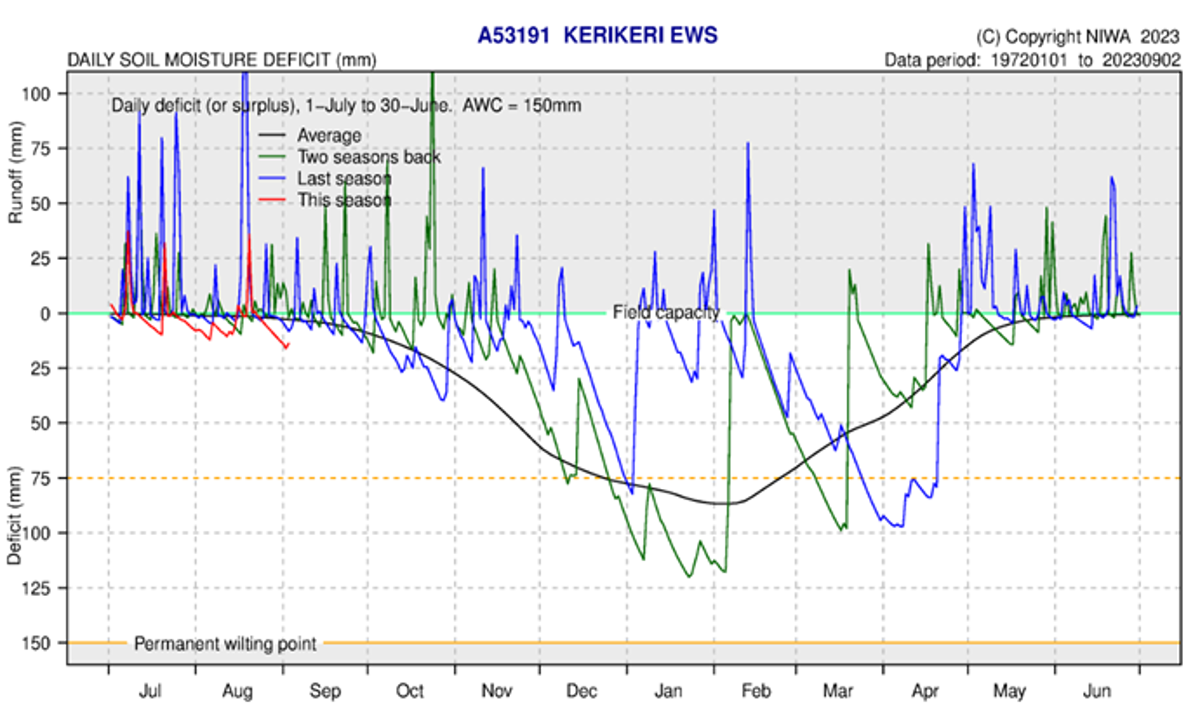
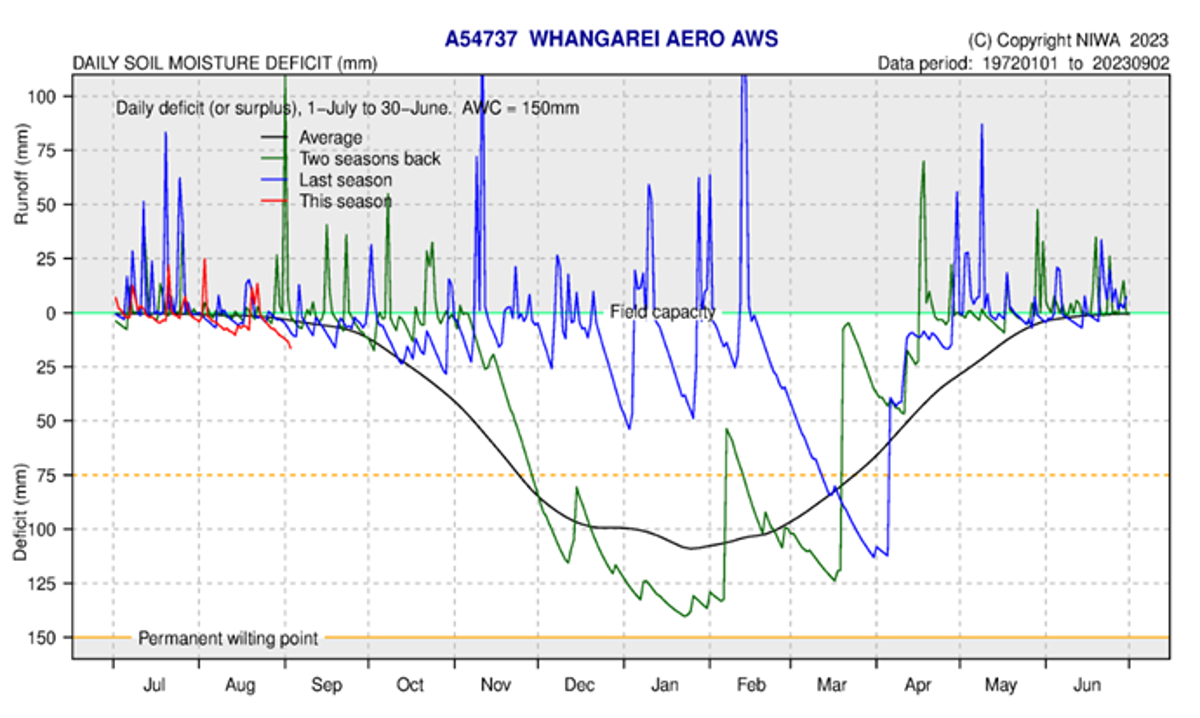
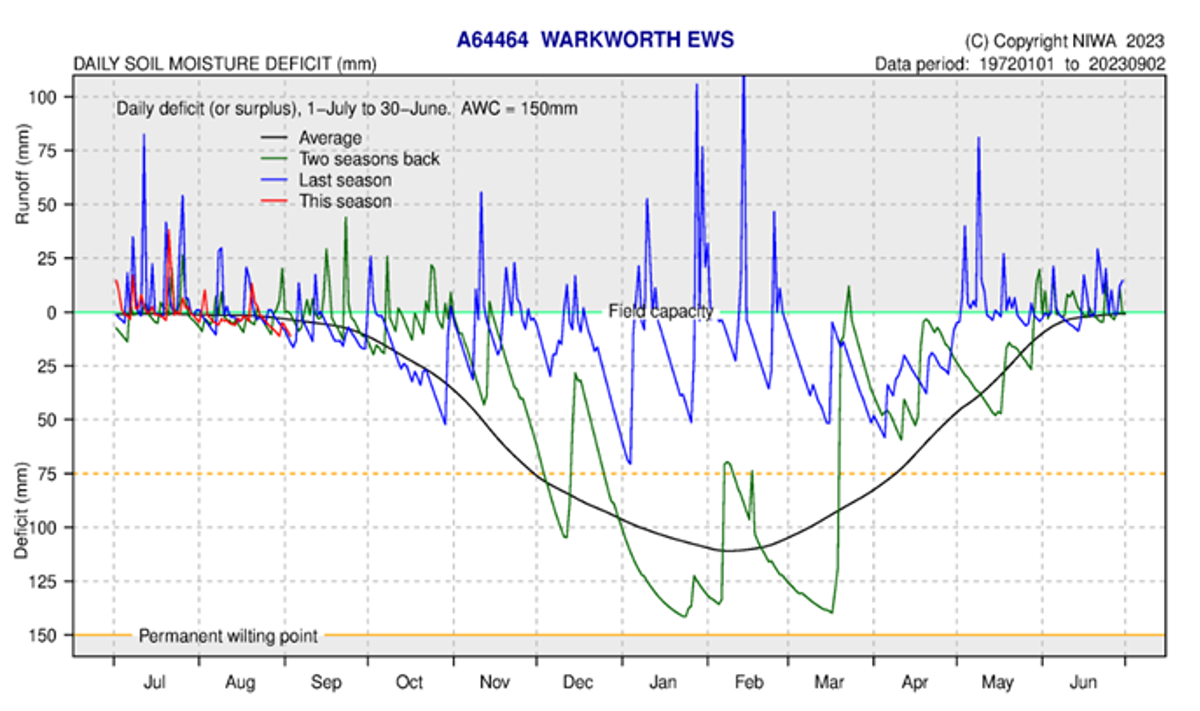
Soil Moisture
August followed a similar pattern to July with all measurement sites have been sitting at field capacity, with small run off events when rainfall passed through the local areas. The soil moisture deficit is calculated based on incoming daily rainfall (mm), outgoing daily potential evapotranspiration (mm), and a fixed available water capacity (the amount of water in the soil 'reservoir' that plants can use) of 150 mm” (NIWA).