July 2023 climate report
2 Aug 2023, 11:45 AM
Summary
- El Niño Southern Oscillation (ENSO) conditions continue to be met, and are starting to affect our weather; however, the southern oscillation index remains in neutral (Atmospheric driver).
- During August – October El Niño is forecasted to be declared in New Zealand when the above climate drivers align and begin working together.
- Temperatures for August – October are likely to be “above average”.
- Rainfall is forecast to be “below average” between August and October.
- During July, Northland recorded 72% of the expected rainfall, which is much lower than previous months.
- River flows in July are “Normal” in the west of the region, while in the east river catchments are either “normal” or “below normal” for July.
- All key groundwater aquifers have “above normal" water levels for July.
- Soil moisture in July is at field capacity with rain events causing run off.
Climate Outlook
July to September 2023
Throughout July ENSO conditions in the central pacific remained above the threshold for El Niño, however the Southern Oscillation Index (SOI), which is the main atmospheric driver for New Zealand remained in a neutral phase. The Sea surface temperatures driven by ENSO and the atmospheric conditions from the SOI are expected to align between August and October, creating El Niño conditions for New Zealand, and persist together through summer.
South-westerly winds are likely to continue and becoming more prominent through winter and early spring. Winds are likely to be stronger than normal. Temperatures are forecasted to be “above average” or “near average”, soil moisture and river flows are expected to be “near average” or “below average, while rainfall is forecasted to be “below average” between August – October.
For more details, please refer to NIWA’s seasonal climate outlook for August - 2023:
See the seasonal climate outlook on NIWA's website: niwa.co.nz
NIWA Temperature, Rainfall, Soil Moisture and River Flows probabilities for the period of August to October 2023
(Expressed as % likelihood for either Above Average, Near Average or Below Average conditions).
| Temperature | Rainfall | Soil moisture | River flows | |
| Above average | 50• | 15 | 20 | 15 |
| Near average | 45• | 35 | 35• | 40• |
| Below average | 05 | 50• | 45• | 45• |
Rainfall
Throughout July Northland was dominated by grey overcast skies, with small amounts of drizzle somewhere in the region each day, on average the region had 22 rain days (out of 31 days in July). However, unlike previous months, the total amount of rainfall recorded was much lower with only two small fronts passing over the region, bringing moderate rainfall intensities on 7 and 20 July.
Overall Northland recorded 72% of the average July rainfall (128 mm), the highest percentage of rainfall was recorded at Takahue, south of Kaitaia (106%), while the lowest percentage was along the east coast with Hikurangi Swamp only receiving 37%, Waipao west of Whangarei 48% and both Waiharakeke south of Moerewa and Kaeo at Bramleys recording 49%. The highest total rainfalls were recorded on the west coast, at Wekaweka Road (288.5mm), Tutamoe (212mm) and Takahue (201mm).
The change in rainfall distribution, which is the opposite pattern to previous months, with the east coast being the driest area and majority of the rainfall falling in the north and west, is a typical pattern of El Nino. El Nino is beginning to develop and is expected to be officially declared in the coming months.
Rainfall (% of Median) for July 2023 across Northland with a range of 37% to 106%
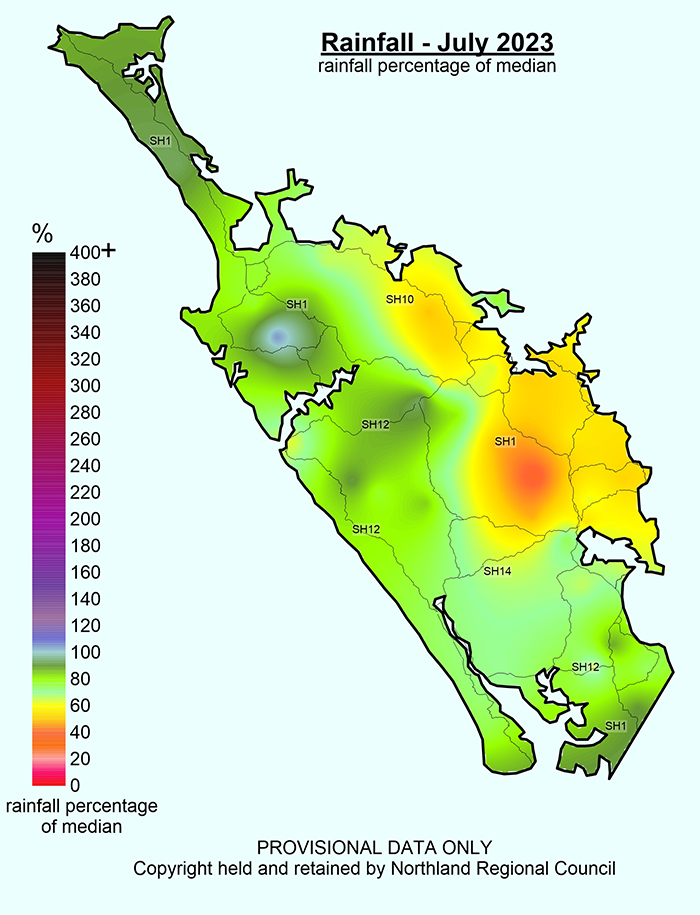
Map showing Rainfall (% of Median) for July 2023 across Northland with a range of 37% to 106%.
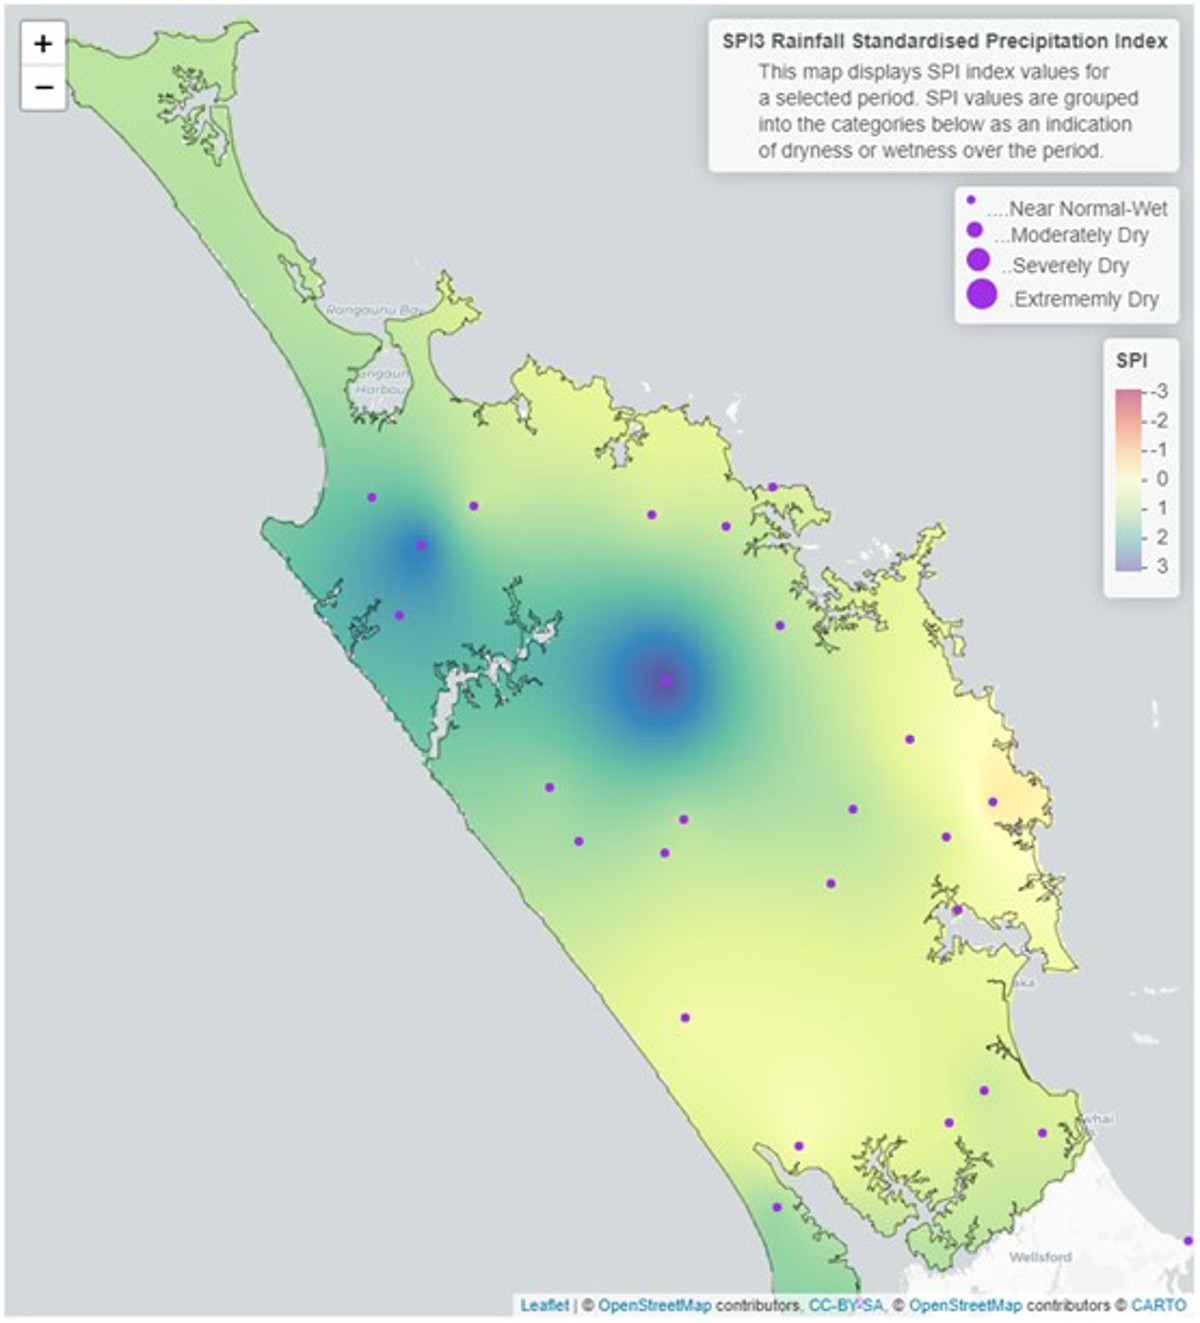
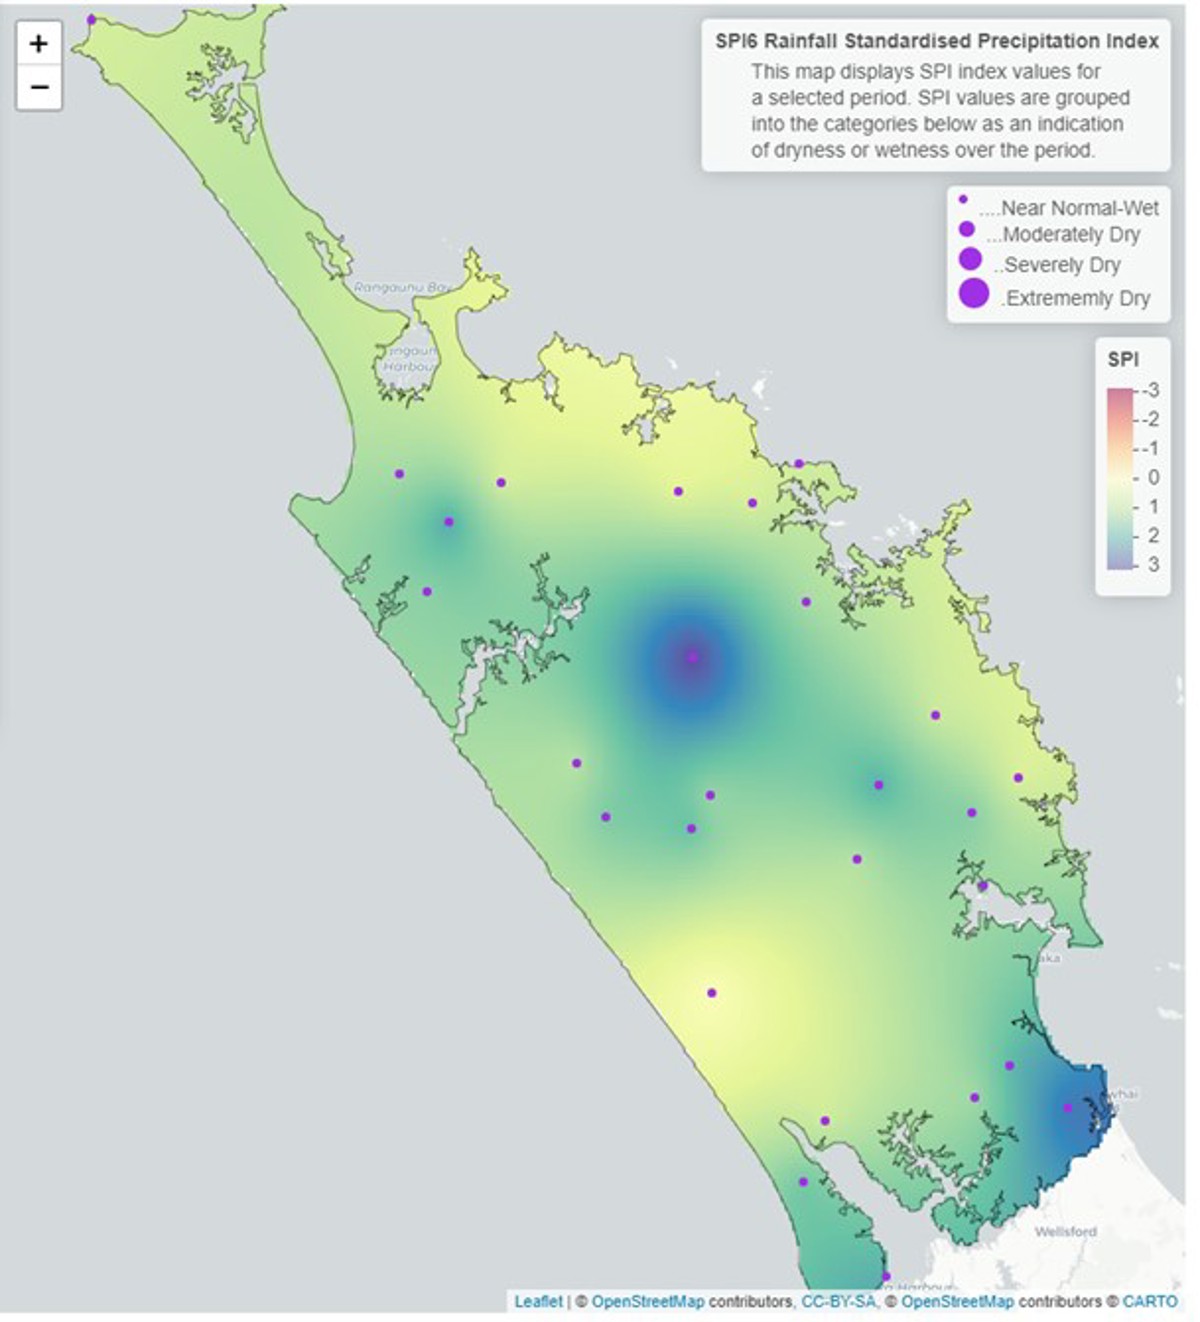
Standardised Precipitation index (SPI)
The Standardised Precipitation Index (SPI) on a three-month scale shows that all of Northland has been “near normal or wet”. The wettest areas in the region are spread from Kaikohe into the Hokianga and the upper areas of the west coast. The east coast and southern areas of the region are drier, with “near normal” rainfall compared to previous years between May - July.
On a six-month scale between February – July 2023, the standardised rainfall averages Northland to being wetter than normal, with the Kaikohe area and the south-eastern corner of the region being extremely wet, driven from extreme rain events in February, though the drier times in July and March have influenced the coastal areas to have “normal” rainfall on the six-month period.
3-month (May-July 2023) and 6-month (February to July 2023) SPI maps


River flow
River flows in Northland varied through July, following a similar pattern to the rainfall distribution, several river catchments are recording “below normal” flows for July, while the headwaters of the Hikurangi swamp are currently measuring “low” flows compared to July in previous years.
Along the west coast and into the north river flows are “normal” or “above normal”.
Monthly percentile River Flows for July 2023
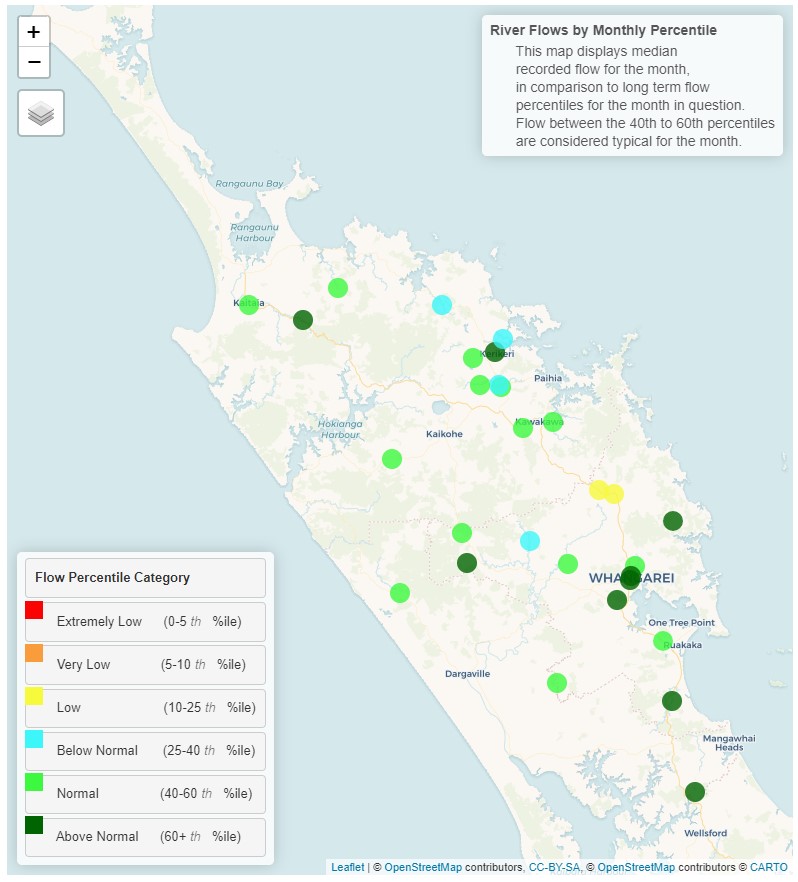
Map displaying monthly percentile river flows for July 2023.
Groundwater
Water levels at all key aquifers in Northland are currently recording “above normal” for July.
| Aquifer | Status | Percentile |
| Aupōuri | Above normal | 60th+ |
| Taipā | Above normal | 60th+ |
| Russell | Above normal | 60th+ |
| Kaikohe | Above normal | 60th+ |
| Poroti | Above normal | 60th+ |
| Whangārei | Above normal | 60th+ |
| Mangawhai | Above normal | 60th+ |
| Marsden - Ruakākā | Above normal | 60th+ |
| Ruawai | Above normal | 60th+ |
Groundwater map for July 2023
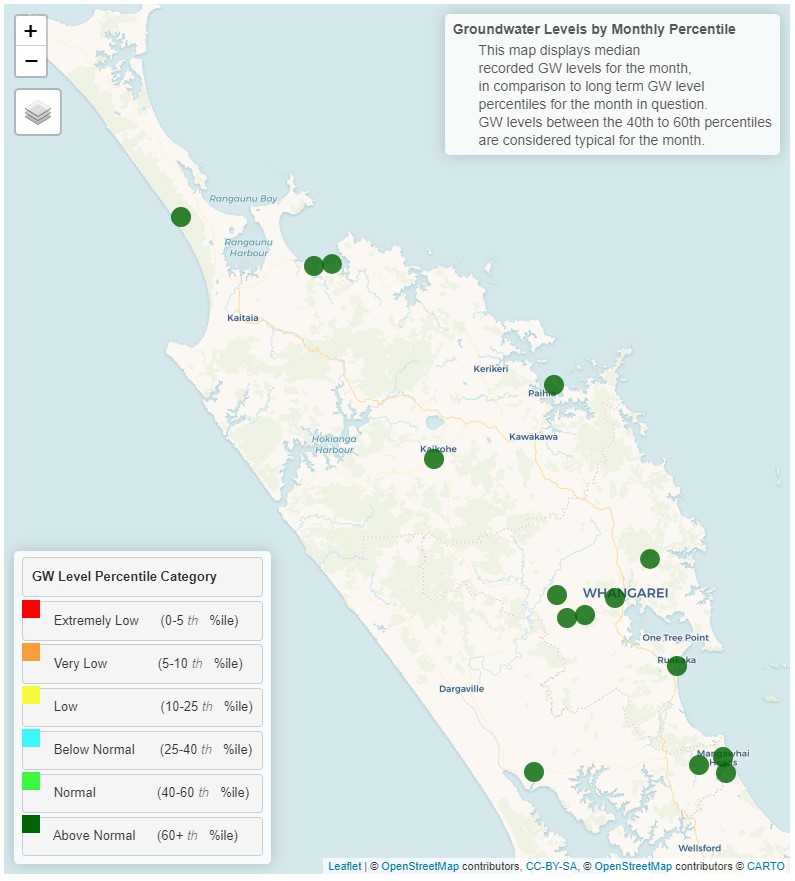
Map displaying groundwater levels by monthly percentile for July 2023.
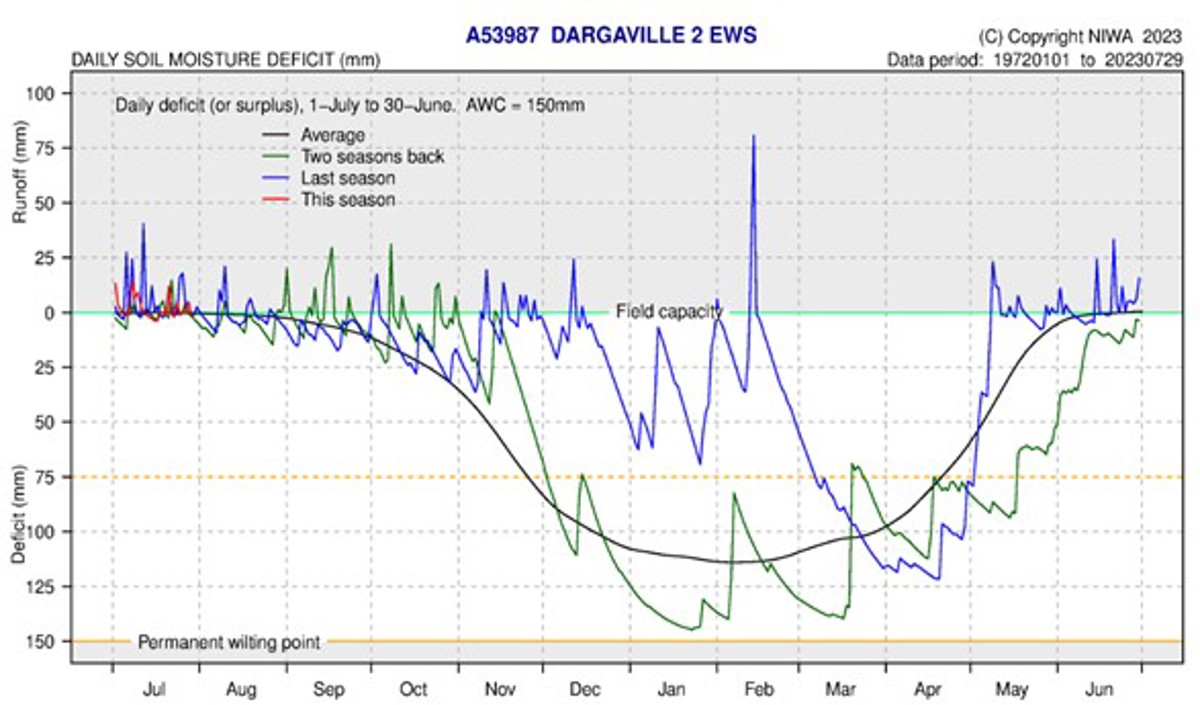
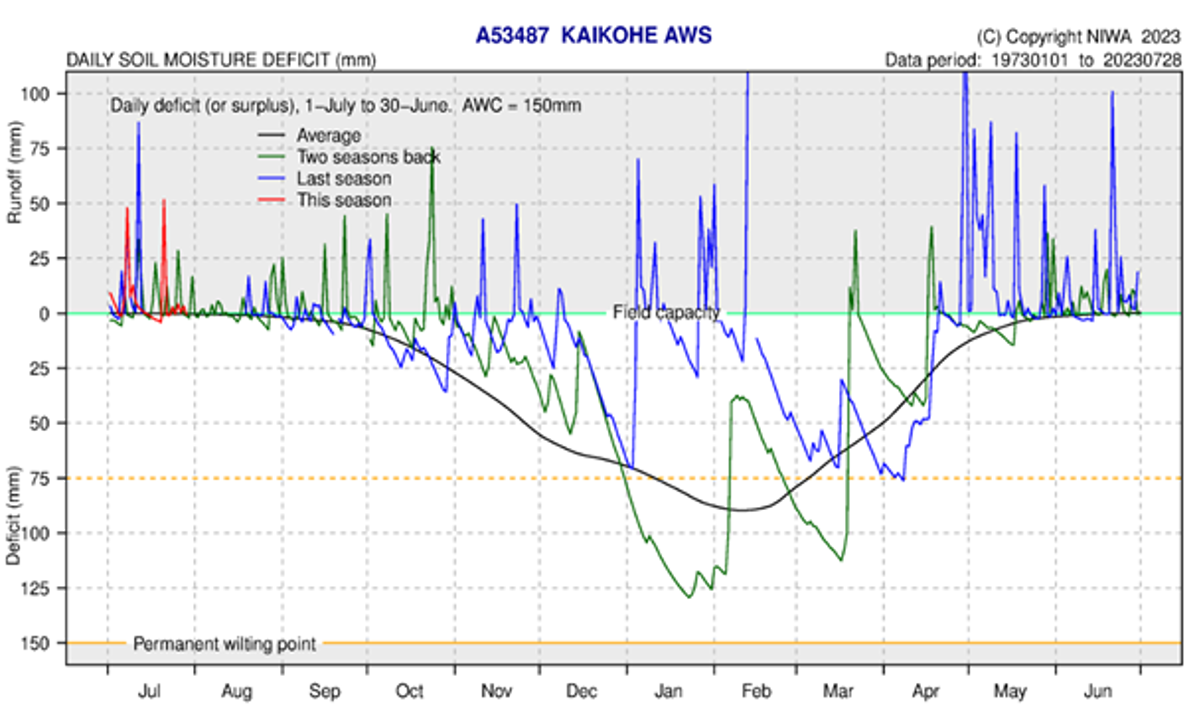
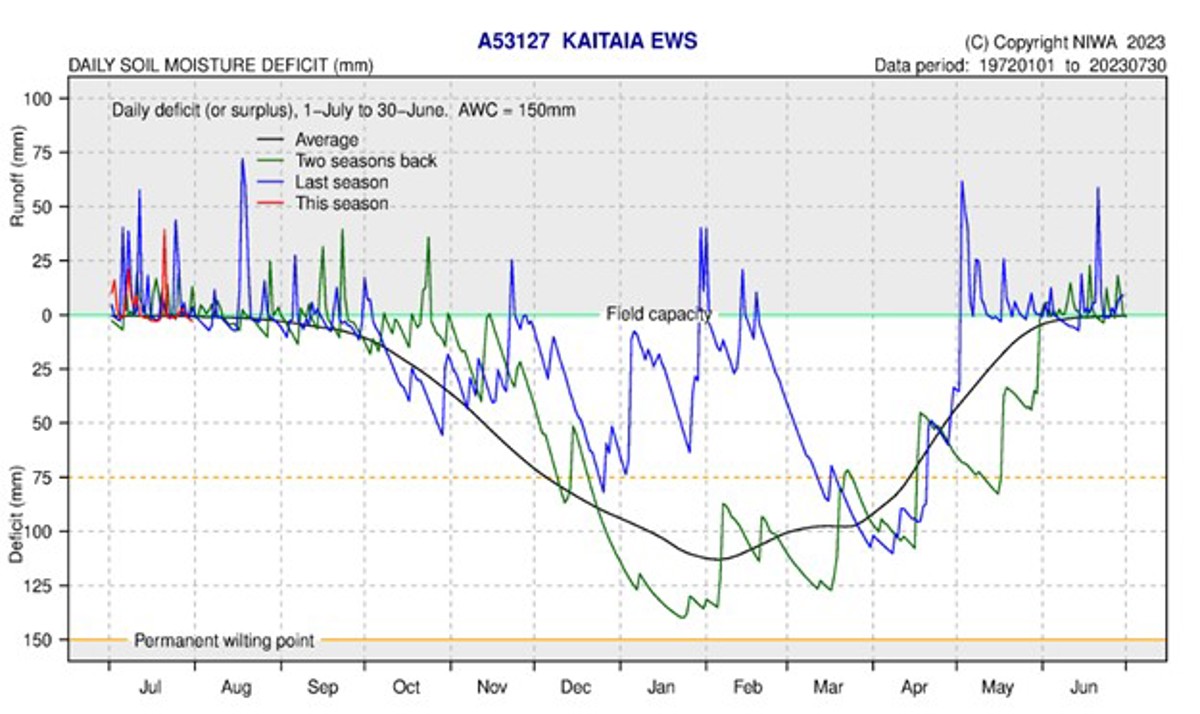
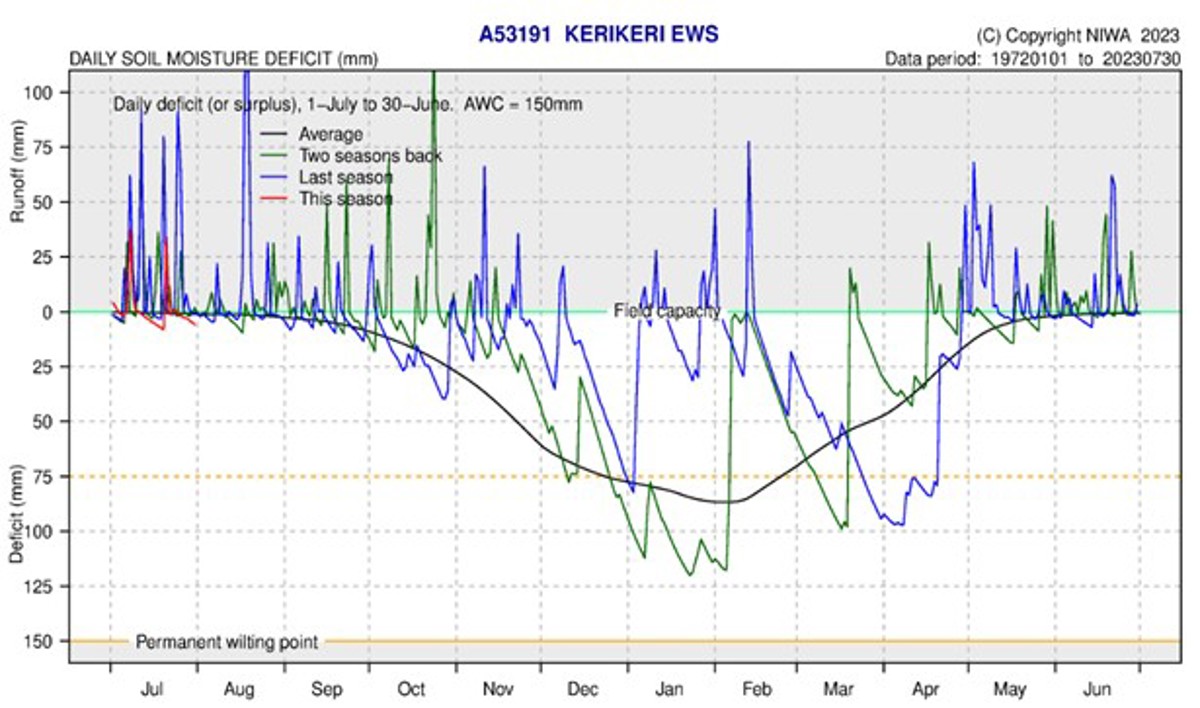
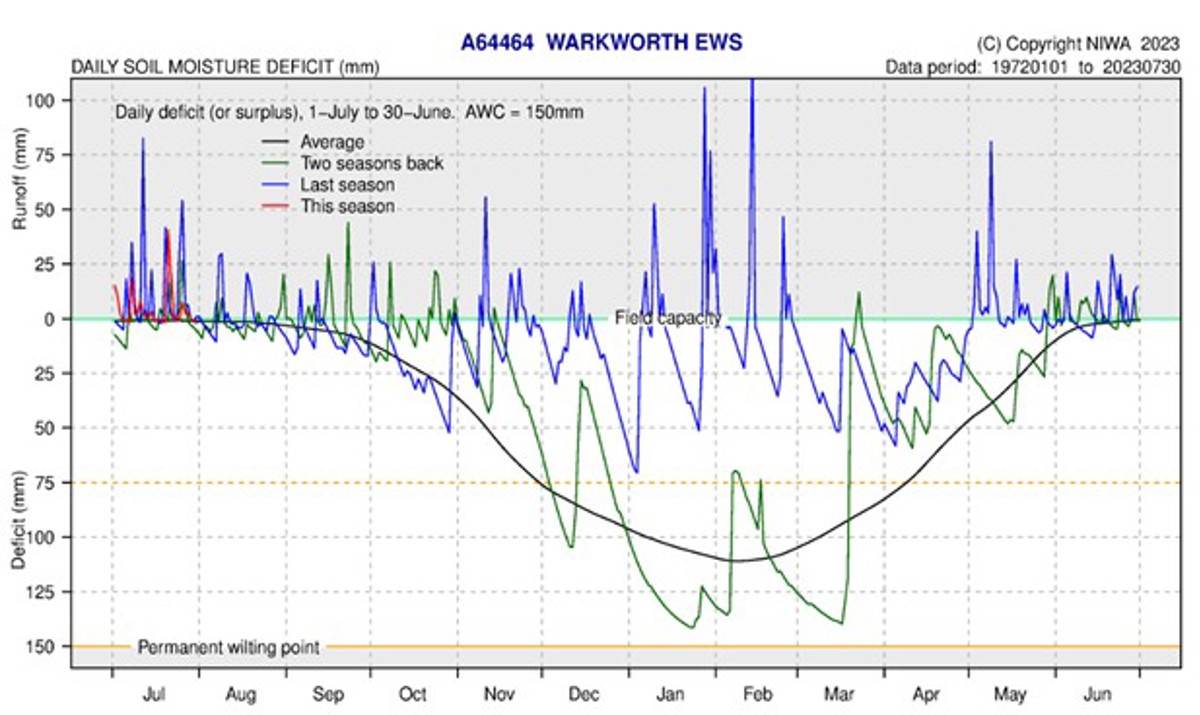
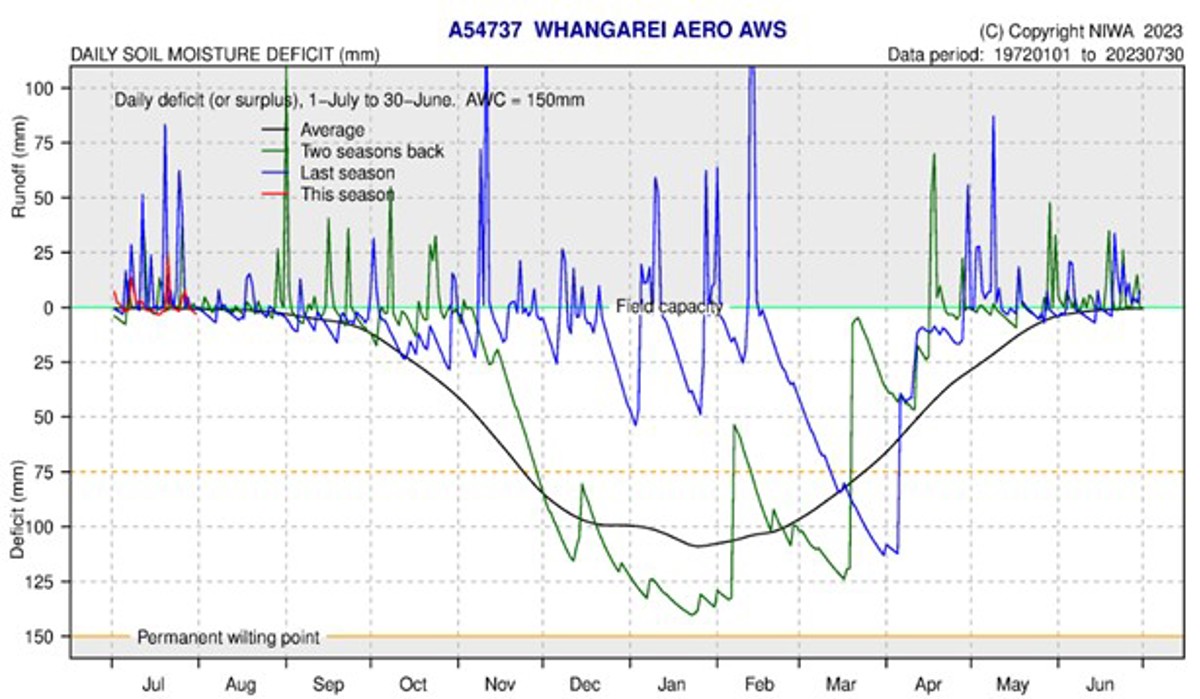
Soil Moisture
During July which is the start of the hydrological year all measurement sites have been sitting at field capacity, with small run off events when rainfall passed through the local areas.
The soil moisture deficit is calculated based on incoming daily rainfall (mm), outgoing daily potential evapotranspiration (mm), and a fixed available water capacity (the amount of water in the soil 'reservoir' that plants can use) of 150 mm” (NIWA).